

Abstract
The use of genotype imputation methods are becoming increasingly common. They are of particular use in meta-analyses, where data from different genotyping platforms are imputed to a reference set and combined in a joint analysis. We show here that such a meta-analysis can miss strong genetic association signals, such as that of the apolipoprotein-e in late-onset Alzheimer disease. This can occur in regions of weak LD; unobserved SNPs are not imputed with confidence so there is no consensus SNP set on which to perform association tests. Both IMPUTE and Mach software are tested, with similar results. This shows that results of imputation methods, particularly failure to replicate strong signals, should be considered critically and examined on a case-by-case basis.
Keywords: Imputation, meta-analysis, Alzheimer disease, apolipoprotein-E
Recent publications (Zeggini et al. 2007; Tenesa et al, 2008; Barrett et al, 2008; O’Donovan et al, 2008; Raychaudhuri et al, 2008; Rafiq et al, 2008) have highlighted the tremendous gains in power that can be achieved in genetic association studies using imputed genotype data. Indeed the application of imputation methods has become mainstream in the analysis of large-scale genome-wide association studies (GWAS) (Marchini et al, 2007; Browning and Browning, 2007; Scheet and Stephens, 2006; Purcell et al, 2007, Li and Abecasis, 2006; Guan and Stephens, 2008; Nothnagel et al, 2009). Importantly, imputation provides an efficient and cost-effective means of inferring missing data when performing a joint analysis (i.e., combining datasets then performing association testing) or a meta-analysis (i.e., performing association testing separately and then combining the test statistics) of datasets genotyped on different platforms. These combined analyses of all available data maximize the power to detect genetic risk factors in complex traits.
A direct combined analysis of GWAS data is only feasible on a small subset of overlapping data when multiple genotyping platforms are used. Each of the common genotyping platforms claims excellent (>85%) coverage of common genome-wide variation, but uses substantially different sets of actual SNPs. Imputation is one solution for harmonizing the SNP sets, since it allows the inference of genotypes for a common set of reference polymorphisms, usually the HapMap phase II data (The International HapMap Consortium, 2007), which can then be jointly analyzed. This combined analysis leverages the increased sample size of multiple datasets, and reduces the missing data for a more powerful test for association. While the potential utility of imputation is generally recognized, its application is not without difficulties and should be approached with caution. In this report, we provide a warning against a naïve implementation of imputation procedures, using our experience in an Alzheimer disease GWAS as an illustration.
We recently performed a GWAS for late-onset Alzheimer disease (LOAD [MIM 104300]) using the Illumina HumanHap 550K beadchip platform (Beecham et al, 2009). LOAD is the most common form of dementia in the elderly and has a complex etiology with a strong genetic component. Polymorphisms at the apolipoprotein-e gene (APOE, [MIM 107741]) are strongly associated with LOAD risk (Corder et al., 1993), with the homozygote odds ratio for the e4 allele estimated at 14.9 (Farrer et al, 1997). The APOE gene signal has been universally replicated in LOAD genetic studies and typically serves as a positive control (Bertram et al, 2007; http://www.alzforum.org/res/com/gen/alzgene/geneoverview.asp?geneid=83).
In our discovery dataset (Beecham et al., 2009), we observed several SNPs near APOE that were strongly associated with LOAD (rs2075650, p-value = 3.4 × 10⁻²³). To validate our GWAS findings, we performed a joint analysis using Affymetrix 500k GeneChip data from a published GWAS (Reiman et al, 2007). Both datasets contained individuals of European descent. In the Reiman et al study (2007), a strong signal near APOE was also observed (rs4420638, p-value = 5.3 × 10⁻³⁴; Coon et al, 2007). However, the exact SNPs genotyped in each dataset were different, making joint analysis impossible without imputation. To combine the two studies we independently examined two software packages, IMPUTE (Marchini et al, 2007) and MACH (Li and Abecasis, 2006), to generate genotypes for a common set of SNPs based on the HapMap CEU reference set. Genotypes were accepted when the genotype probability was over 0.90 (the default of the GTOOL software, a companion program for IMPUTE), and the joint analysis was performed on SNPs with less than 10% of genotypes missing (an alternative approach is discussed below). This approach was taken as it is analogous to our quality-control for genotype calling using DNA microarray assays; genotypes were called based on a quality score, and SNPs performing poorly across many samples were removed from the statistical analysis (Beecham et al, 2009). Statistical association with LOAD was tested using the Armitage test for trend (Armitage, 1955).
Figure 1 shows the results of the single dataset analyses and the joint analyses in the region around apoE (IMPUTE results shown, results from MACH were similar). This figure shows the –log10(p-value) for association with AD (points, left axis) and the percentage missing data (bars, right axis) in our GWAS, the Reiman GWAS, the joint analysis before quality-control and the joint analysis after quality-control (Figures 1A, 1B, 1C, and 1D, respectively). Though the APOE signal was strong in the independent datasets (Figure 1A, 1B), there was no association at SNPs near the APOE locus in the final joint analysis of the two datasets. Figure 1C shows that the associated SNPs near APOE were also missing much of their data. When quality-control thresholds were applied, there were no associated SNPs in the final analysis (Figure 1D). This effect occurs because the linkage disequilibrium (LD) in the region around APOE is weak (Figure 2; Barrett et al, 2005). Without strong disequilibrium the observed genotypes provide little information about the unobserved genotypes, and the imputation algorithm cannot infer genotypes with high confidence. With lower confidence comes more missing data, and the SNPs fail the quality-control thresholds.
Figure 1. Plot of –log10(p-value) and missing data in the region surrounding apoE.
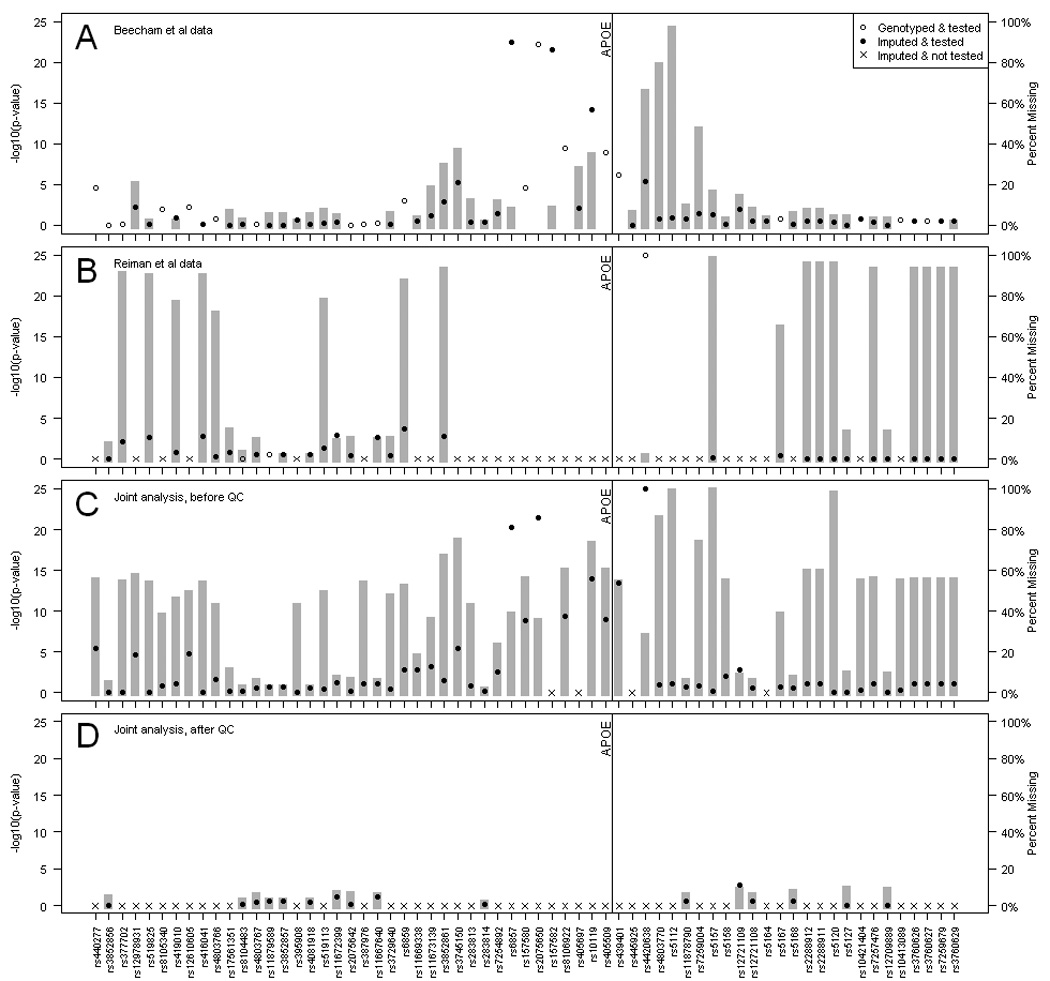
The plot shows results of the imputation analysis in our GWAS (Fig 1A), the Reiman et al GWAS (Fig 1B), the joint analysis of both GWAS before quality-control (Fig 1C), and the joint analysis after quality-control (Fig 1D). The points refer to –log10 (p-value) of the trend test. Open circles are SNPs that were genotyped on the platform for 1A and 1B. Closed circles mark SNPs inferred by the imputation algorithm. SNPs with crosses were monomorphic and not tested. The bar graph represents the percent of missing data of the tested SNPs.
Figure 2. Patterns of linkage disequilibrium (LD) around apoE.
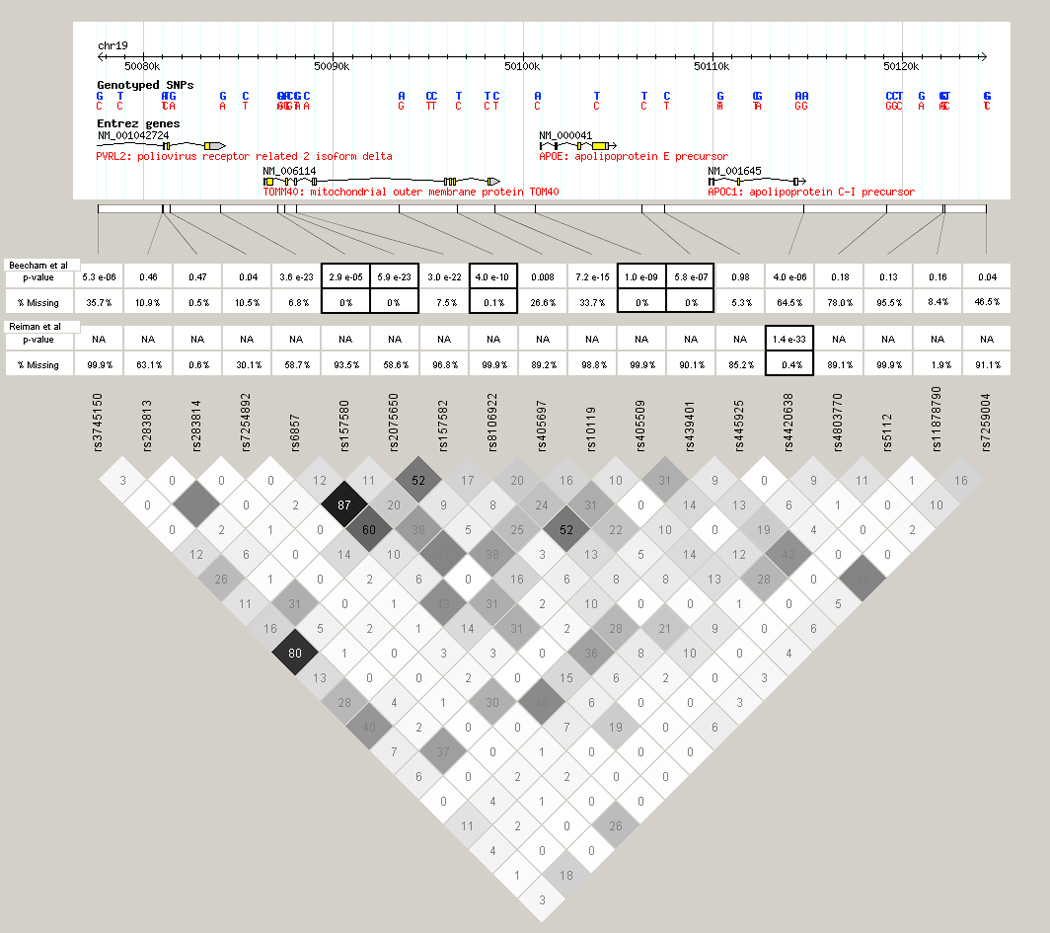
Plot of LD around the apoE gene. LD is measured by r2, in the Haploview program, and is calculated from the HapMap CEU parents. The table shows p-value of the trend test after imputation, and percent of samples with missing genotypes for that SNP. SNPs that were genotyped in the initial studies are outlined with black boxes.
The effect of low LD is largely independent of the statistical analysis method. A common alternative to making genotype calls in imputation is to perform the statistical analysis directly on the genotype distribution (e.g., using the SNPTEST software; Marchini et al., 2007). While this method does allow for more uncertainty in individual genotypes, the quality of the imputed SNPs must still be considered. In our APOE example, instead of making genotype calls we removed imputed SNPs with an average maximum posterior probability less than 0.90 in either study, and performed the association testing using the SNPTEST software. As with the genotyping calling approach, there were no SNPs near APOE that were successfully imputed in both datasets.
One alternative approach that can recover some signals in low-LD regions has been suggested by de Bakker et al (2008). Instead of directly combining datasets for a joint analysis, they advocate a meta-analysis in which the respective test statistics are weighted by a quality score (e.g., RSQR_HAT from MACH, INFO from PLINK, or PROPER_INFO from SNPTEST). Rather than entirely removing a SNP due to poor imputation quality in a single dataset, this method down-weights the suspect dataset without ignoring the signals from other datasets. For example, the rs405509 SNP was genotyped in the Beecham dataset and was highly significant (SNPTEST, p-value = 9.6 × 10⁻¹¹; PROPER_INFO = 0.996). The SNP was not genotyped in the Reiman dataset, and was imputed poorly (PROPER_INFO score of 0.13). However, the Reiman test statistic was highly significant (p-value = 7.4 × 10⁻⁷). We then performed a meta-analysis (METAL, www.sph.umich.edu/csg/abecasis/metal), weighting the two studies by the sample size times the respective info score. This kept the Beecham signal as-is, but severely down-weighted the Reiman dataset. In the end, the down-weighted Reiman dataset still contributed to the association and the meta-analysis p-value strengthened to 3.2 × 10⁻¹⁵.
This example illustrates how a naïve combined analysis with imputed data can miss even strong association when LD is weak, and serves as a warning against an uninformed combined analysis on multiple datasets. In the case of APOE, if we had insisted on a strict rule of “significance plus replication at the same SNP” to define regions of interest we would have wrongly ignored the APOE association, and missed one of the strongest known genetic effects in common complex disease. We suggest that if a signal is not present in a combined analysis of imputed data, it should not necessarily evidence of a type-1 error in the initial analysis. The region should be further investigated to determine why the signal was not replicated. If there is strong LD and genotypes were inferred with confidence, then it may be evidence of a type-1 error. However, if there is little confidence in the imputation and there is much missing data there may be a legitimate association that a standard joint analysis will not find. A meta-analysis approach such as that proposed by de Bakker et al can sometimes recover the signal. The application of novel and powerful tools for fully characterizing GWAS data holds much promise for scientific discovery, but requires us to think critically about their meaning and interpretation.
ACKNOWLEDGEMENTS
This work was supported by grants from the National Institutes of Health: National Institute on Aging (AG20135, AG19757), National Institute of Neurological Disorders and Stroke (NS31153) the Alzheimer’s Association, and the Louis D. Scientific Award of the Institut de France. A subset of the participants was ascertained while Margaret A. Pericak-Vance was a faculty member at Duke University.
REFERENCES
- Zeggini E, Scott LJ, Saxena R, Voight BF, et al. Meta-analysis of genome-wide association data and large-scale replication identifies additional susceptibility loci for type 2 diabetes. Nat Gen. 2008;40:638–645. doi: 10.1038/ng.120. [DOI] [PMC free article] [PubMed] [Google Scholar]
- Tenesa A, Farrington SM, Prendergast JGD, et al. Genome-wide association scan identifies a colorectal cancer susceptibility locus on 11q23 and replicates risk loci at 8q24 and 18q21. Nat Gen. 2008;40:631–637. doi: 10.1038/ng.133. [DOI] [PMC free article] [PubMed] [Google Scholar]
- Barrett JC, Hansoul S, Nicolae DL, et al. Genome-wide association defines more than 30 distinct susceptibility loci for Crohn's disease. Nat Gen. 2008;40:955–962. doi: 10.1038/NG.175. [DOI] [PMC free article] [PubMed] [Google Scholar]
- O'Donovan MC, Craddock N, Norton N, et al. Analysis of 10 independent samples provides evidence for association between schizophrenia and a SNP flanking fibroblast growth factor receptor 2. Nat Gen 40. 2008;40:1053–1055. doi: 10.1038/mp.2008.108. [DOI] [PMC free article] [PubMed] [Google Scholar]
- Raychaudhuri S, Remmers EF, Lee AT, et al. Common variants at CD40 and other loci confer risk of rheumatoid arthritis. Nat Gen. 2008;40:1216–1223. doi: 10.1038/ng.233. [DOI] [PMC free article] [PubMed] [Google Scholar]
- Rafiq S, Melzer D, Weedon MN, et al. Gene variants influencing measures of inflammation or predisposing to autoimmune and inflammatory diseases are not associated with the risk of type 2 diabetes. Diabetologia. 2008;51:2205–2213. doi: 10.1007/s00125-008-1160-3. [DOI] [PMC free article] [PubMed] [Google Scholar]
- Marchini J, Howie B, Myers S, McVean G, Donnelly P. A new multipoint method for genome-wide association studies by imputation of genotypes. Nat Gen. 2007;39:906–913. doi: 10.1038/ng2088. [DOI] [PubMed] [Google Scholar]
- Browning SR, Browning BL. Rapid and accurate haplotype phasing and missing-data inference for whole-genome association studies by use of localized haplotype clustering. Am J Hum Genet. 2007;81:1084–1097. doi: 10.1086/521987. [DOI] [PMC free article] [PubMed] [Google Scholar]
- Scheet P, Stephens M. A fast and flexible statistical model for large-scale population genotype data: applications to inferring missing genotypes and haplotypic phase. Am J Hum Genet. 2006;78:629–644. doi: 10.1086/502802. [DOI] [PMC free article] [PubMed] [Google Scholar]
- Purcell S, Neale B, Tood-Brown K, et al. PLINK: a tool set for whole-genome association and population-based linkage analyses. Am J Hum Genet. 2007;81:559–575. doi: 10.1086/519795. [DOI] [PMC free article] [PubMed] [Google Scholar]
- Li Y, Abecasis GR. Mach 1.0: Rapid Haplotype Reconstruction and Missing Genotype Inference. Am J Hum Genet. 2006 S79:2290. [Google Scholar]
- Guan Y, Stephens M. Practical issues in imputation-based association mapping. PLoS Genet. 2008;4(12):e1000279. doi: 10.1371/journal.pgen.1000279. [DOI] [PMC free article] [PubMed] [Google Scholar]
- Nothnagel M, Ellinghaus D, Schreiber S, Krawczak M, Franke A. A comprehensive evaluation of SNP genotype imputation. Hum Genet. 2009;125:163–171. doi: 10.1007/s00439-008-0606-5. [DOI] [PubMed] [Google Scholar]
- Corder EH, Saunders AM, Strittmatter WJ, et al. Gene dose of apolipoprotein E type 4 allele and the risk of Alzheimer's disease in late onset families. Science. 1993;26(5123):921–923. doi: 10.1126/science.8346443. [DOI] [PubMed] [Google Scholar]
- Bertram L, McQueen MB, Mullin K, Blacker D, Tanzi RE. Systematic meta-analyses of Alzheimer disease genetic association studies: the AlzGene database. [Accessed on March 1, 2009];Nat Genet. 2007 39(1):17–23. doi: 10.1038/ng1934. [DOI] [PubMed] [Google Scholar]
- Beecham GW, Martin ER, Li YJ, Slifer MA, Gilbert JR, Haines JL, Pericak-Vance MA. Genome-wide association study implicates a chromosome 12 risk locus for late-onset Alzheimer disease. Am J Hum Genet. 2008;84(1):35–43. doi: 10.1016/j.ajhg.2008.12.008. [DOI] [PMC free article] [PubMed] [Google Scholar]
- Farrer LA, Cupples LA, Haines JL, et al. Effects of age, sex, and ethnicity on the association between apolipoprotein E genotype and Alzheimer disease. A meta-analysis. APOE and Alzheimer Disease Meta Analysis Consortium. JAMA. 1997;278:1349–1356. [PubMed] [Google Scholar]
- Reiman EM, Webster JA, Myers AJ, et al. GAB2 alleles modify Alzheimer's risk in APOE epsilon4 carriers. Neuron. 2007;54:713–720. doi: 10.1016/j.neuron.2007.05.022. [DOI] [PMC free article] [PubMed] [Google Scholar]
- Coon KD, Myers AJ, Craig DW, et al. A high-density whole-genome association study reveals that APOE is the major susceptibility gene for sporadic late-onset Alzheimer's disease. J Clin Psychiatry. 2007;68:613–618. doi: 10.4088/jcp.v68n0419. [DOI] [PubMed] [Google Scholar]
- Armitage P. Tests for Linear Trends in Proportions and Frequencies. Biometrics. 1955;11:375–386. [Google Scholar]
- Barrett JC, Fry B, Maller J, Daly MJ. Haploview: analysis and visualization of LD and haplotype maps. Bioinf. 2005;21:263–265. doi: 10.1093/bioinformatics/bth457. [DOI] [PubMed] [Google Scholar]