Abstract
The Gene Expression Omnibus (GEO) is the largest resource of public gene expression data. While GEO enables data browsing, query and retrieval, additional tools can help realize its potential for aggregating and comparing data across multiple studies and platforms. This paper describes DSGeo - a collection of valuable tools that were developed for annotating, aggregating, integrating and analyzing data deposited in GEO. The core set of tools include a Relational Database, a Data Loader, a Data Browser and an Expression Combiner and Analyzer.
The application enables querying for specific sample characteristics and identifying studies containing samples that match the query. The Expression Combiner application enables normalization and aggregation of data from these samples and returns these data to the user after filtering, according to the user’s preferences. The Expression Analyzer allows simple statistical comparisons between groups of data. This seamless integration makes annotated cross-platform data directly available for analysis.
Keywords: gene expression data, cross-platform analysis, biomedical data annotation, integration
I. Introduction
The Gene Expression Omnibus (GEO) is a large repository of gene expression and molecular abundance data, with currently over 300,000 data samples deposited.(1) This is the largest of several repositories of gene expression data, and it has enabled widespread distribution and analysis of related data from different studies.(2–4) While aggregated data analysis and comparative studies are desirable given a huge source of data samples, the process of accessing data, the variability of measured expression across platforms, and unstructured annotations of phenotypic characteristics present barriers to such analysis.(5;6) The goal of this article is to describe a set of tools to enable the analysis of cross-platform gene expression data as well as integration with phenotypic characteristics. This paper describes a collection of valuable tools that researchers at the Decision Systems Group (DSG) developed for use in analyzing data deposited in GEO – a software suite called DSGeo.
Many studies have created software tools for providing access to single-platform microarray data as well as for enabling data visualization, and high-throughput data analyses using hierarchical clustering and univariate analyses.(7;8) In addition, multiple studies have attempted to integrate data manually from various platforms, as well as from various generations of a single platform in order to achieve a more robust analysis utilizing a greater number of related data samples.(8;9) Finally, several researchers focused on the standardization of probe-level annotation as well as phenotypic annotation of data samples.(6;10–13) All these studies fail to provide an integrated method for data retrieval and aggregation that enables large-scale analysis of cross-platform high-throughput data, including data visualization, normalization, user-specified filtering mechanisms and data annotation. The design and development of the various components of DSGeo will be described in detail.
Implementation
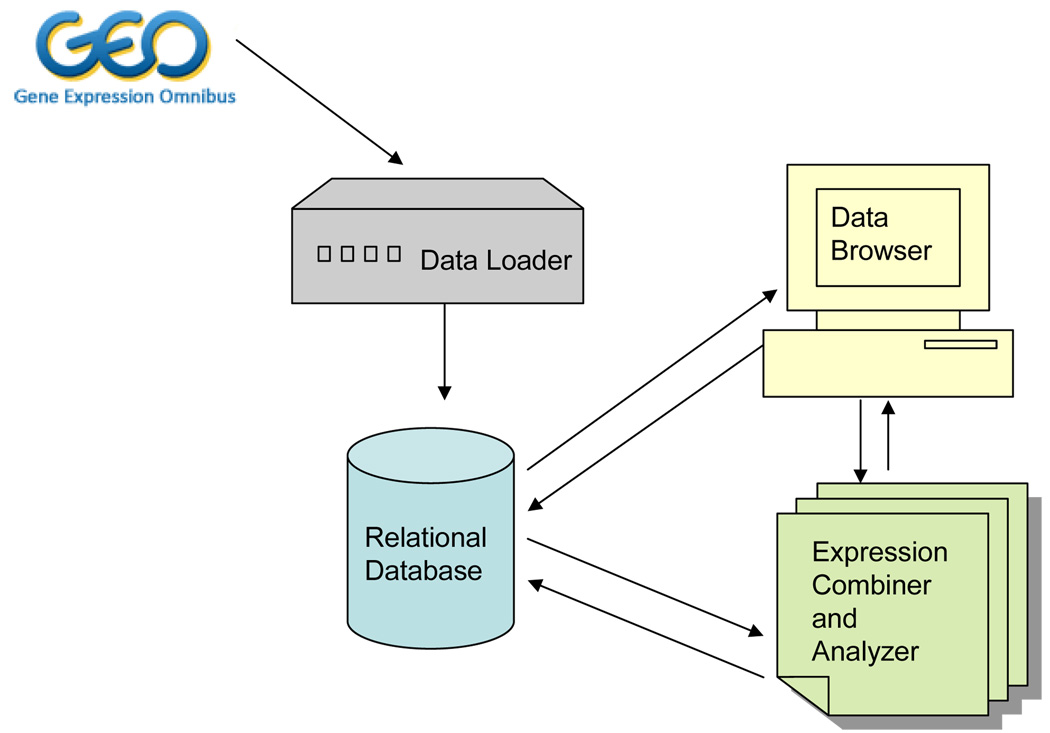
DSGeo is comprised of a core set of tools, including a Relational Database, a Data Loader, a Data Browser, and an Expression Combiner and Analyzer. Figure 1 illustrates the overall system architecture, describing the relationships between the core set of tools. The use case example in the subsequent section will further illustrate the flow of information between these components.
Figure 1.
Overall System Architecture
Materials
The programming language for all these programs was Python. It was chosen for its ease of use and extensive library support. Apache 2 was used to host all web applications. MySQL was used as the primary database. For all smaller databases, like the probe-to-gene mapping, gene locations, alternatively spliced regions and SNP positions, SQLite was used because of its more portable setup and excellent Python support.
DSGeo Relational Database
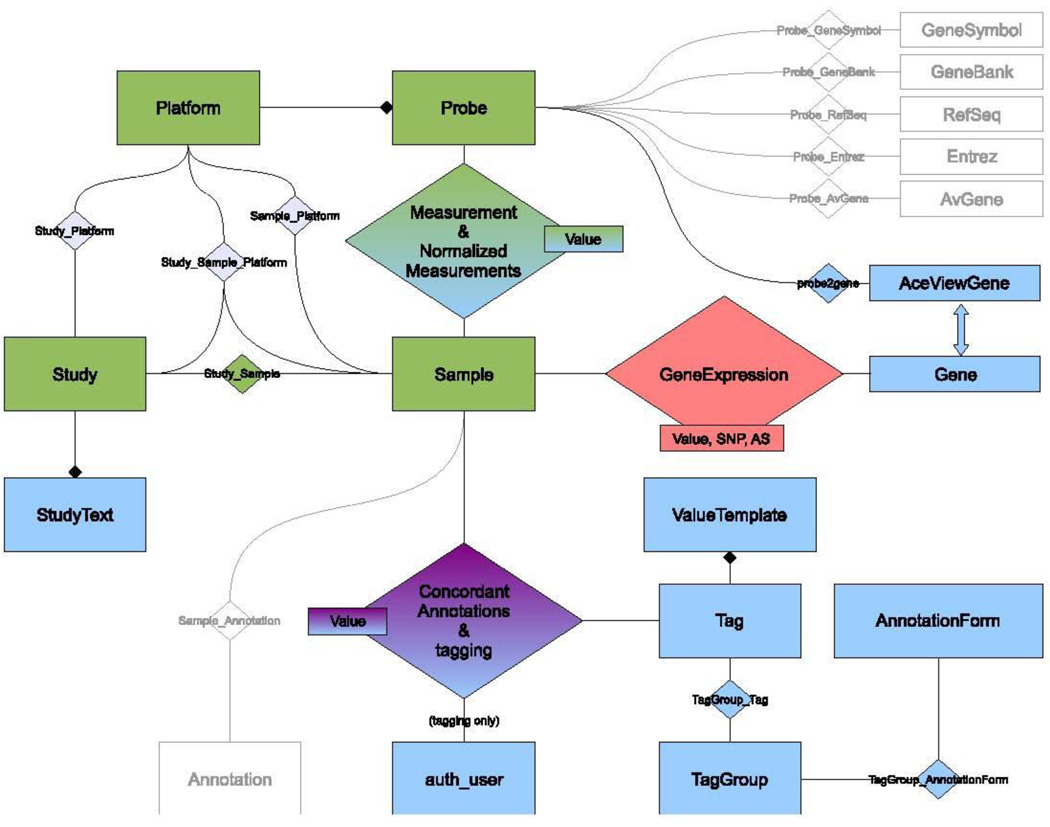
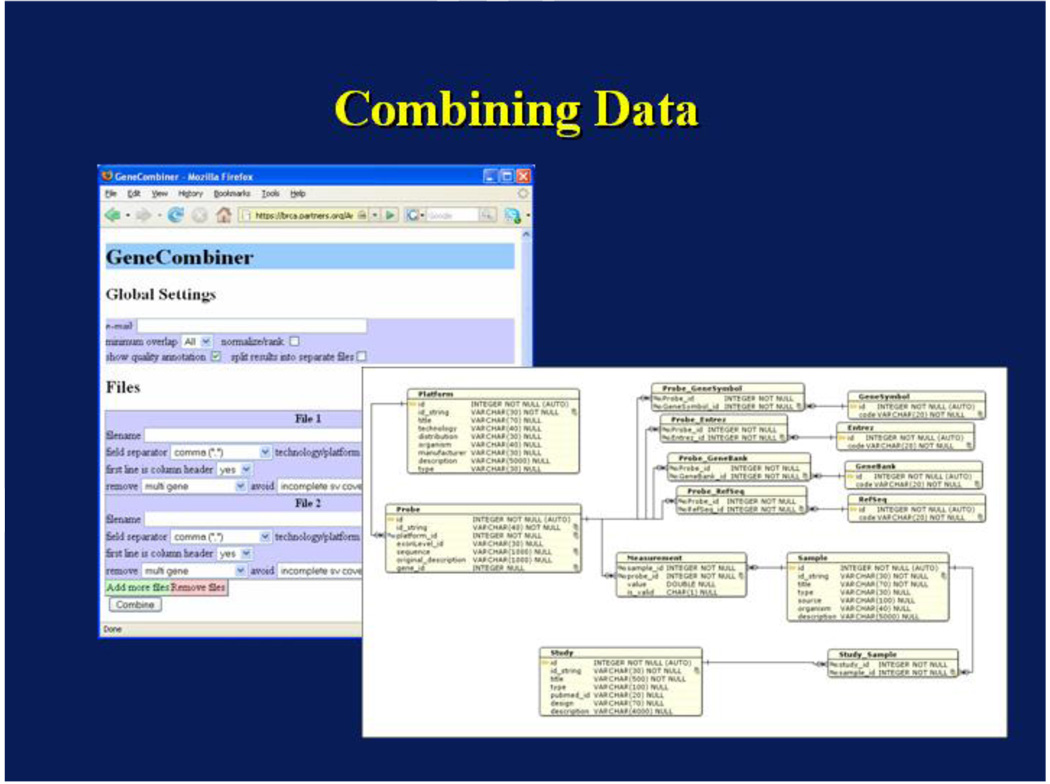
Figure 2 illustrates an overview of the DSGeo database schema. The tables Platform, Probe, Measurement, Sample, Study and their intermediate associations were directly imported from GEO and are highlighted in green. A local copy of the GEO repository enables quicker access to data for manipulation and display. When necessary, directly imported data are analyzed, annotated, or normalized. Once this is done, derived data are stored in the database for future retrieval. Tables highlighted in blue contain derived data that were calculated using various algorithms developed at DSG.
Figure 2.
DSGeo Database Schema
The tables Tag, Value Template, Tag Group and Annotation Form are used to dynamically create annotation forms in the web front end. An Annotation Form is comprised of a collection of Tag Groups, which in turn, are composed of logically coherent Tags. Value templates are proposed values for a certain tag. The table Tagging captures the annotations made in the web front end. It is a ternary association that stores the tag’s value a user makes for a certain sample. After completing the annotation process, this table is distilled into the table Concordant Annotations that contains unequivocal annotations. These annotations are further used to enable querying for specific sample characteristics.
Our custom probe annotation is stored in the following tables, Probe2gene and AceViewGene. Normalized measurements, using quantile normalization, are stored in the table NormalizedMeasurements.(14) The normalized and aggregated gene expression values created by the Expression Combiner component are stored in the AggregatedGeneExpression table, which will be discussed in the next section.
Data Loader
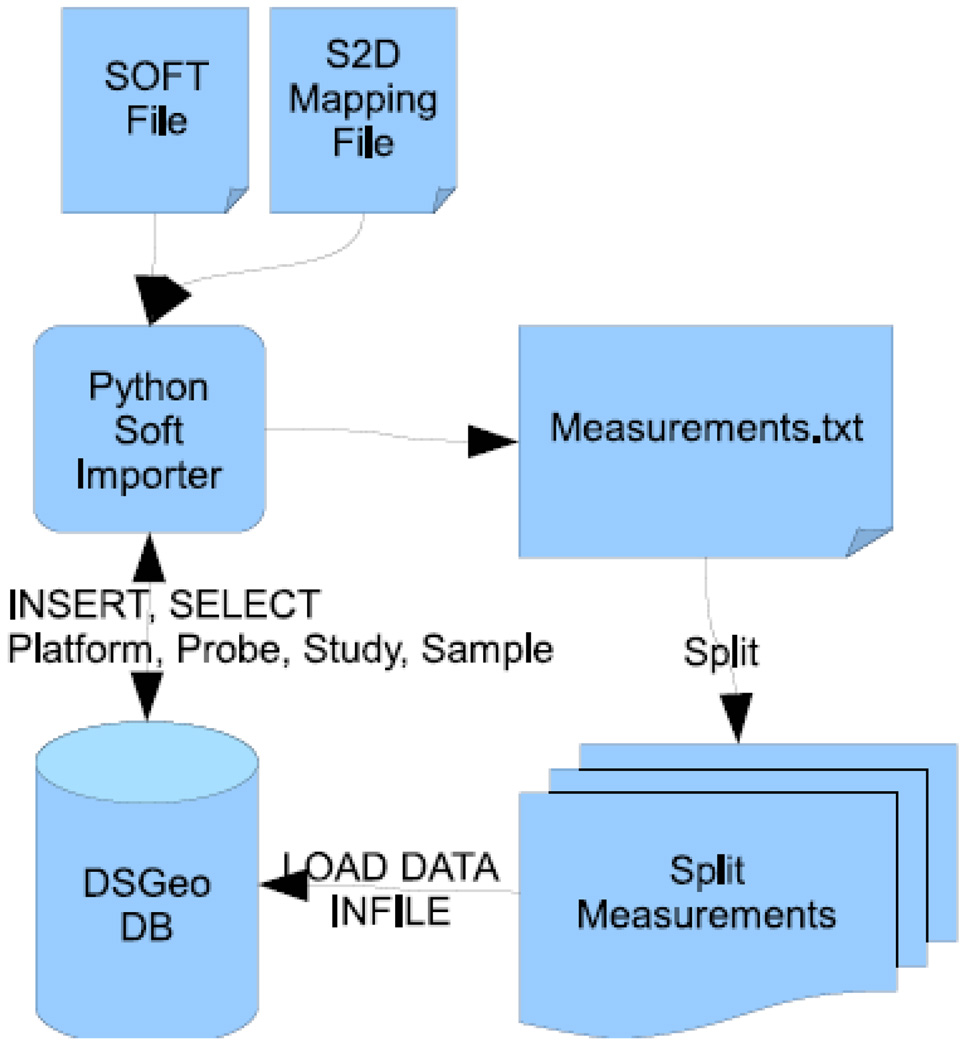
The Data Loader stores data directly imported from GEO into the relational database described above (Figure 3). The central engine of the Data Loader is a file parser. The file parser imports a Simple Omnibus Format in Text (SOFT) file from GEO and an appropriately adapted S2D file that describes the translation of SOFT attributes into database columns (thus called S2D). A recognizer parses the SOFT files and creates mapping files, which describe which fields in the SOFT file are mapped to which column in the relational database. Once the mapping is completed, the following process occurs – platforms, probes, studies and samples are directly inserted into the database. A python script subsequently pulls in the GEO dataset (GDS) annotations from GEO. GDS are manually developed to systematically categorize statistically and biologically similar samples that were processed using a similar platform within a single study.(1) Information regarding mapping problems from the SOFT file into the database, including capturing superfluous or missing fields, is recorded.
Figure 3.
Importer Schematics
One important optimization is that raw measurements are not directly inserted into the database, but are initially collected into a text file, which is then read by the database. This bulk import strategy reduced the import time from several weeks to a total of about two days.
CEL Parser
One popular input format are Affymetrix’ CEL files. These files are available for direct import from GEO. For this purpose, a specially configured parser was developed and works only for platforms where a coordinate to probe ID mapping is established.
Data Browser
The Data Browser provides a web front end to the relational database. This is composed of several subsystems. A browser renders the studies in the database available for text queries. This browser returns research studies when samples or platforms contain the search term. An annotation interface is available for phenotypic sample annotation for use by human curators. An annotation explorer enables querying the phenotypic annotations that were deposited in the relational database from the annotation web interface, after internal verification is completed by the investigators. It also enables querying for specific genes. Finally, a data visualization component provides a graphical display for sample measurements. Most parameter passing is done explicitly and, except for very obvious cases, hardly any data are stored in any session.
Browser
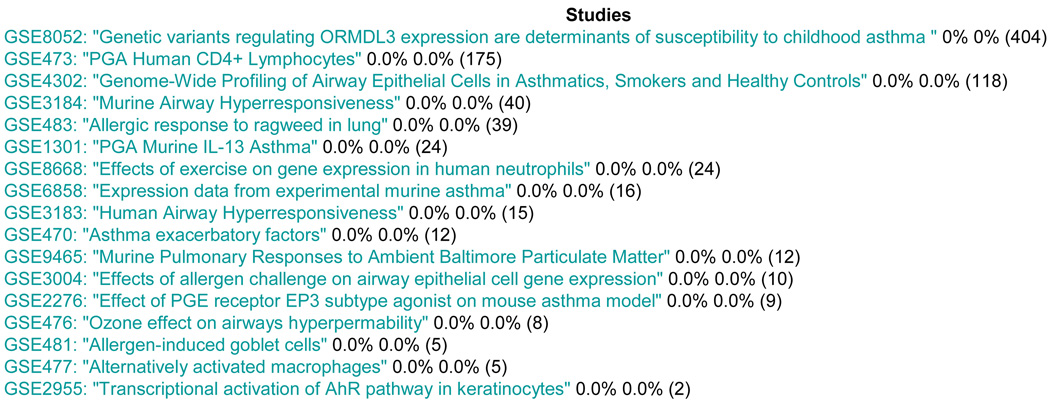
For browsing the data in the database, we utilized object-relational data mapping using the Django framework. A search function that is currently implemented enables query for specific search terms. Figure 4 illustrates the resulting list of GEO studies for a query on “Asthma”. The mechanism is similar for platforms and probes. This data browser is a simple interface to data that are directly imported from GEO. It does not query derived data, such as phenotypic annotations, as described in the next paragraph.
Figure 4.
Asthma Query Result. Percentages reflect the amount of completed annotations per annotator (number of samples in each study in parenthesis).
Annotation
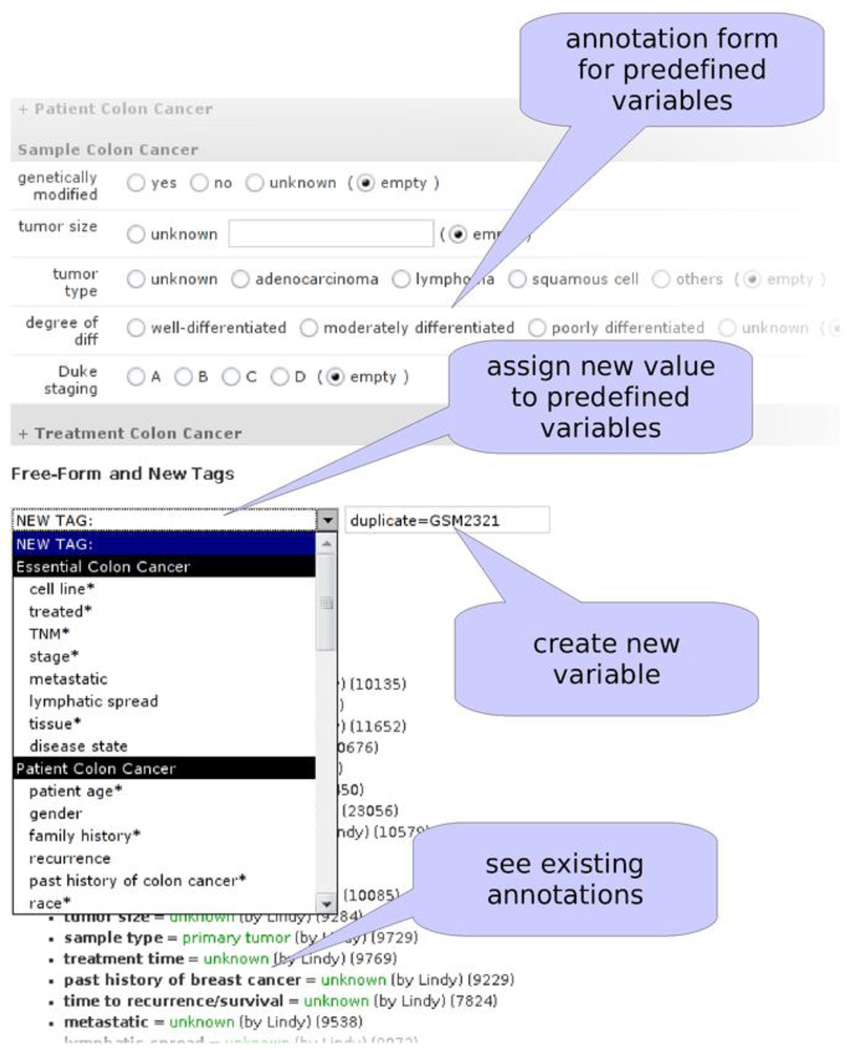
The annotation interface is utilized by human curators who manually perform phenotypic annotation of samples that are deposited in GEO (Figure 5). Domain-specific annotation forms need to be developed because each disease contains distinct tags. For instance, breast cancer contains tags for cancer staging, whereas rheumatoid arthritis contains a tag for CD classification. For this purpose, a relatively complex template is used to dynamically generate annotation forms. To create new tags, a Python script parses a text file containing descriptions of new tags developed by experts and creates necessary entries to update the database. These tags subsequently appear in the web interface when the annotation forms are dynamically generated.
Figure 5.
Annotation Tool for Assigning Values to Tags
Annotation Explorer
Once annotations are internally validated,(20) the annotation explorer provides an interface for querying samples for specific phenotypic characteristics. The annotation explorer form contains three distinct forms: (1) a form for selecting samples, (2) one for gene selection, and (3) a filter selection form. Finding samples is performed when either a tag is selected from a drop down box or search terms have been entered into a text box. Gene selection is performed by searching for a gene whenever text is entered in a corresponding textbox. Filter selection is performed when a specific filter is selected from a drop down box. Available filters include those for removing multi-gene expressions, avoiding single nucleotide polymorphisms (SNPs), and avoiding alternative splicing (AS)
Data Visualization
In order to accomplish cross-platform normalization, a plotting feature was developed to visualize the distribution of non-normalized measurements. This includes plotting a histogram of a single sample‘s measurements and boxplots of all samples’ measurements from a whole study.
Expression Combiner and Analyzer
The final DSGEO component is the Expression Combiner and Analyzer. This component provides methods to combine data from different studies, when deemed appropriate by a user.
Parsing, Annotating & Merging
The Expression Combiner performs the bulk of parsing, annotating and merging data. It consists of two methods: Probe Annotation and Translation. Probe annotation represents a combined gene and quality annotation of a given probe. Translation represents the interface to the backend database. Every row (i.e. probe) is initially annotated with its own Probe Annotation. When probes measure the same gene, not only are their measurement values averaged, but their ProbeAnnotation objects are merged.
After parsing, other methods are implemented, including filtering and quantile normalization. There are sequential dependencies that exist when calling these methods. For instance, after parsing, normalization should be performed right away as the annotation process merges probes for the same gene. Filtering has to be done after the probes have been annotated. The following settings for filtering in ExpressionCombiner are enabled: removing gene expression measurements that map to more than one gene, avoiding single nucleotide polymorphisms (SNPs), and avoiding alternative splicing (AS). The filtering process returns data to the user, according to the user’s preferences. There is an interface that allows assigning individual samples to groups and performing simple statistical comparisons (e.g. t-test). This allows users to compare arbitrary groups of samples with each other.
Quantile Normalization
To facilitate cross-platform comparison of microarray measurement values, normalization was necessary for this application. A popular method is quantile normalization.(15) An extension of this method is implemented by replacing every value with the average of all values in the same quantile. This implementation has been extensively tested and compared with the R implementation from the original authors.
When applied to inhomogeneous data from different vendors, however, a barrier to directly applying the algorithm is having different numbers of rows per platform. To enable quantile normalization, shorter columns have to be temporarily lengthened. This is accomplished by utilizing several interpolation and decimation functions, specifically linear and random interpolation.
Probe Matcher
An important step in this process consisted of preparing a comprehensive genome database, containing a list of genes, their positions on the genome, their transcripts, estimates about alternative splicing and high quality SNPs. We selected AceView as a comprehensive assembly of transcripts and gene clustering. It contains a huge amount of genes and transcripts, including tentative ones, which had to be filtered out. The resulting transcripts are subsequently stored in an SQLite3 database. This database is then used to prepare a list of alternatively spliced regions based on overlapping but disagreeing transcripts. All accepted transcripts from the previous step are subsequently read and terminal exons are marked. Once the database is prepared, exons overlapping with introns are identified. The last step involves merging equal, overlapping and consecutive alternatively spliced regions into one, to reduce subsequent calculation overhead.
It is then necessary to select high quality SNPs for probe annotation. First, dbSNP and dbSNP exceptions were downloaded from USCS. Subsequently, SNP filtering was performed and the resulting list of high quality SNPs is then imported into the database. In order to obtain genomic positions from probe sequences, BLAT and the chromosome sequences were utilized to identify respective alignment with the genome. The resulting files are the primary input for ProbeExpert.
Probe expert consists of a generic matcher component that efficiently finds overlapping genomic regions.(16) After probe sequences have been mapped to the genome, the probe expert identifies which probes lie within a gene, and which probes overlap with alternatively spliced regions or with SNP-containing regions.
Evaluation
In order to demonstrate that DSGeo enables analysis of cross-platform gene expression data as well as integration with phenotypic data in an automated manner, we describe two use cases: one where a typical user interacts with the browser to search for studies using the data browser, and subsequently combines the data samples from two different studies; and a second use case where a human curator uses the annotation tool within the data browser to perform phenotypic annotation of samples. These two use cases illustrate the flow of data between various DSGeo components. In order to illustrate both cases, the Data Loader is utilized to enable parsing of SOFT files from GEO, and extracting all relevant data from GEO into the DSGeo Relational Database. The full import was optimized and only took two days.
Use Case 1: Combining Data Samples from Two Studies
Using the Data Browser component, the user enters the following text query, “breast cancer gene expression.” As expected, several GEO studies (GSE) are returned instantly from the local DSGeo Relational Database. Using the results returned by the DSGeo browser, the user reviews the description for each study and decides to combine the data files from two studies: (17) and (18) with the goal of more effectively identifying differentially expressed genes between grade 1 and 3 breast cancer .(19)
In order to decide whether the measurements can be combined, the user attempts to visualize the distribution of non-normalized measurements. First, boxplots of all samples’ measurements from each of the two studies are obtained. This assures the user that the data distribution would be preserved when values are combined using quantile normalization. The next step will utilize the Expression Combiner and Analyzer to merge the data files. Figure 6 shows the user interface for the Expression Combiner.
Figure 6.
Expression Combiner Interface
The automated process using ExpressionCombiner took less than an hour using our tools. Further removing undesirable probes according to the filter setting based on probe characteristics could be obtained within seconds. This included (i) targeting a unique-gene, (ii) targeting a constitutive exon, and (iii) only SNP-free. The output of the ExpressionCombiner is a gene-symbol by sample matrix of quantile-converted measurement values. The effect of combining data sets in order to identify differentially expressed genes between grade 1 and 3 breast cancer yielded greater integration-driven discovery rate (IDDR) for new genes. This result suggests that novel genes could be discovered with combined data that individual studies would not be able to detect.
The next use case further illustrates the capabilities of the Data Browser, utilizing an interface for users of the DSGeo toolkit, as well as for human curators.
Use Case 2: Sample Annotation
In the first use case, a user enters a text query – breast cancer gene expression – and using the Django framework for querying the database, returns all studies containing these terms. These studies include those where the search terms are mentioned in the descriptive section of the studies, even when they do not really apply to the study. For instance, studies comparing colon cancer gene expression will show up if there is mention in the description section that similar analysis were conducted to those for breast cancer. In order to provide a more accurate set of results, phenotypic annotation of samples is necessary. In this case, a user’s goal is to identify samples where in order to compare gene expression between women with breast cancer with and without family history of breast cancer.
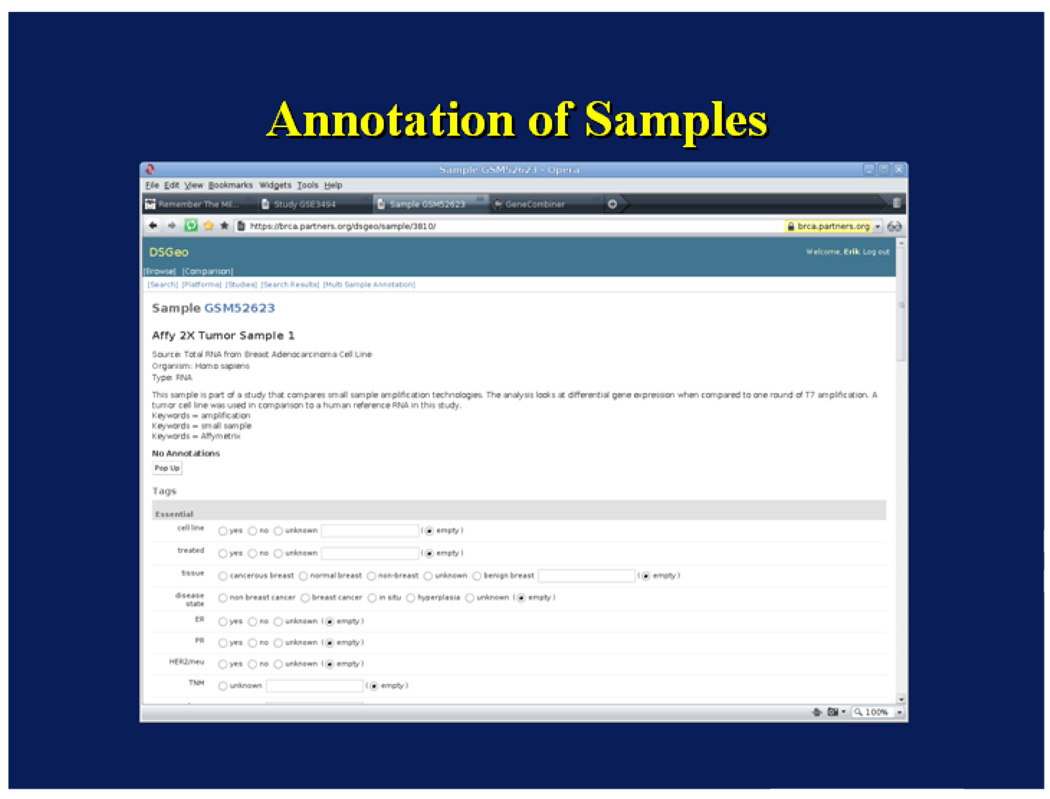
This module utilizes the web-based annotation platform for creating sample annotations in the database. The annotation interface used by the human curators is shown in Figure 7. As reported in Lacson et. al., 12,500 samples were annotated, mostly by two redundant annotators with excellent inter-annotator agreement (92%).(20) Each sample received an average of 32 annotations and there were a total of almost half a million variable assignments performed. After verification, annotations were stored in the relational database as derived data and this enables the annotation explorer to answer queries regarding samples and studies with similar phenotypic characteristics. For the breast cancer domain, there were 41 tags annotated. For this use case, the following tags were appropriately curated: sex, disease (e.g. breast cancer), and family history. By using the data browser, the query returns four samples of women with breast cancer who had a family history of breast cancer, and one sample of a woman with no family history of breast cancer. If the user desires, samples from the four women who had a family history of breast cancer can be combined using the Expression Combiner and Analyzer. This seamless integration makes data available for analysis within minutes.
Figure 7.
Annotation Tool User Interface
Discussion
This project utilizes a validated large-scale phenotypic annotation of samples that can enable aggregating similar samples for comparative studies.
This study differs from (9) in that it automates the process of acquiring data from multiple studies and platforms, annotates and appropriately merges the data, and normalizes them, thus making the data amenable to large-scale analysis. The entire process, including annotation, filtering, and comparative analysis, facilitates acquiring multiple sets of relevant data samples for analysis, without having to manually identify and aggregate data analytic files. In addition, unlike CrossChip and GEO,(1;8) this suite of tools allow cross-platform aggregation and analysis of data. This is the first large-scale implementation of tools with this capability that we know of.
Currently, DSGeo only focuses on combining data when appropriate, with minimal statistical analysis involved (e.g. t-test). Once differentially expressed genes are identified, it is left to the user to map the gene to the appropriate biological process. There are tools that are currently available to do this task.(21) Similarly, when most effective treatments across different sample data sets are compared, we also leave it to the users’ discretion to map the drugs to the appropriate class.
A ubiquitous problem with reusing data is the sparsity of phenotypic annotations for each sample. That is, several tags have unknown values even when human annotators diligently tried to fill out each tag. For instance, age was only available in 53% of samples. Data on race was only available less than one percent of the time. Thus, querying for tags that do not have substantial coverage presents limitations, as shown in the second use case. There were very few samples identified in each group; and this is clearly not sufficient to perform statistical analysis. To facilitate the decision-making, a visualization tool is available for plotting non-normalized measurements within a sample and comparing multiple samples within a study. Users then decide whether they want to combine measurements to perform further analyses.
Future work will focus on performing more validation tests using several other combinations of platforms. For the Probe matcher, the next generation sequencing technologies (454, ABI/SOLiD, Illumina/Solexa) can generate a much higher volume of new sequences that have to be mapped and annotated.(22;23) We are currently working on a version of this program that uses the same algorithms to quickly map reads generated from these technologies to transcripts. Finally, we will perform more phenotypic data annotation, allowing for confirmation or development of novel hypothesis that relates gene to phenotypic expression to disease development and treatment response.
Conclusion
Integrating cross-platform gene expression data and clinical and phenotypic patient characteristics is feasible. The enhanced capability to identify similar data, aggregate and analyze samples from a large public repository of gene expression data is important to translational bioinformatics research.
Acknowledgements
P. Galante was funded by grant D43TW007015 from the Fogarty International Center, NIH. This work was funded in part by grant FAS0703850 from the Komen Foundation. L. Ohno-Machado was funded in part by grant R01LM009520 from the National Library of Medicine, NIH.
Footnotes
Publisher's Disclaimer: This is a PDF file of an unedited manuscript that has been accepted for publication. As a service to our customers we are providing this early version of the manuscript. The manuscript will undergo copyediting, typesetting, and review of the resulting proof before it is published in its final citable form. Please note that during the production process errors may be discovered which could affect the content, and all legal disclaimers that apply to the journal pertain.
Reference List
- 1.Barrett T, Suzek TO, Troup DB, Wilhite SE, Ngau WC, Ledoux P, et al. NCBI GEO: mining millions of expression profiles--database and tools. Nucleic Acids Res. 2005;33(Database issue):D562–D566. doi: 10.1093/nar/gki022. [DOI] [PMC free article] [PubMed] [Google Scholar]
- 2.Parkinson H, Kapushesky M, Shojatalab M, Abeygunawardena N, Coulson R, Farne A, et al. ArrayExpress--a public database of microarray experiments and gene expression profiles. Nucleic Acids Res. 2007;35(Database issue):D747–D750. doi: 10.1093/nar/gkl995. [DOI] [PMC free article] [PubMed] [Google Scholar]
- 3.Parkinson H, Sarkans U, Shojatalab M, Abeygunawardena N, Contrino S, Coulson R, et al. ArrayExpress--a public repository for microarray gene expression data at the EBI. Nucleic Acids Res. 2005;33(Database issue):D553–D555. doi: 10.1093/nar/gki056. [DOI] [PMC free article] [PubMed] [Google Scholar]
- 4.Ikeo K, Ishi-i J, Tamura T, Gojobori T, Tateno Y. CIBEX: center for information biology gene expression database. C R Biol. 2003;326(10–11):1079–1082. doi: 10.1016/j.crvi.2003.09.034. [DOI] [PubMed] [Google Scholar]
- 5.Kuo WP, Jenssen TK, Butte AJ, Ohno-Machado L, Kohane IS. Analysis of matched mRNA measurements from two different microarray technologies. Bioinformatics. 2002;18(3):405–412. doi: 10.1093/bioinformatics/18.3.405. [DOI] [PubMed] [Google Scholar]
- 6.Dudley J, Butte AJ. Enabling integrative genomic analysis of high-impact human diseases through text mining. Pac Symp Biocomput. 2008:580–591. [PMC free article] [PubMed] [Google Scholar]
- 7.Liu CL, Prapong W, Natkunam Y, Alizadeh A, Montgomery K, Gilks CB, et al. Software tools for high-throughput analysis and archiving of immunohistochemistry staining data obtained with tissue microarrays. Am J Pathol. 2002;161(5):1557–1565. doi: 10.1016/S0002-9440(10)64434-3. [DOI] [PMC free article] [PubMed] [Google Scholar]
- 8.Kong SW, Hwang KB, Kim RD, Zhang BT, Greenberg SA, Kohane IS, et al. CrossChip: a system supporting comparative analysis of different generations of Affymetrix arrays. Bioinformatics. 2005;21(9):2116–2117. doi: 10.1093/bioinformatics/bti288. [DOI] [PMC free article] [PubMed] [Google Scholar]
- 9.Barnes M, Freudenberg J, Thompson S, Aronow B, Pavlidis P. Experimental comparison and cross-validation of the Affymetrix and Illumina gene expression analysis platforms. Nucleic Acids Res. 2005;33(18):5914–5923. doi: 10.1093/nar/gki890. [DOI] [PMC free article] [PubMed] [Google Scholar]
- 10.Lu J, Lee JC, Salit ML, Cam MC. Transcript-based redefinition of grouped oligonucleotide probe sets using AceView: high-resolution annotation for microarrays. BMC Bioinformatics. 2007;8:108. doi: 10.1186/1471-2105-8-108. [DOI] [PMC free article] [PubMed] [Google Scholar]
- 11.Chen R, Li L, Butte AJ. AILUN: reannotating gene expression data automatically. Nat Methods. 2007;4(11):879. doi: 10.1038/nmeth1107-879. [DOI] [PMC free article] [PubMed] [Google Scholar]
- 12.Yu H, Wang F, Tu K, Xie L, Li YY, Li YX. Transcript-level annotation of Affymetrix probesets improves the interpretation of gene expression data. BMC Bioinformatics. 2007;8:194. doi: 10.1186/1471-2105-8-194. [DOI] [PMC free article] [PubMed] [Google Scholar]
- 13.Barrett T, Edgar R. Reannotation of array probes at NCBI's GEO database. Nat Methods. 2008;5(2):117. doi: 10.1038/nmeth0208-117b. [DOI] [PubMed] [Google Scholar]
- 14.Bolstad BM, Irizarry RA, Astrand M, Speed TP. A comparison of normalization methods for high density oligonucleotide array data based on variance and bias. Bioinformatics. 2003;19(2):185–193. doi: 10.1093/bioinformatics/19.2.185. [DOI] [PubMed] [Google Scholar]
- 15.Bolstad BM, Irizarry RA, Astrand M, Speed TP. A comparison of normalization methods for high density oligonucleotide array data based on variance and bias. Bioinformatics. 2003;19(2):185–193. doi: 10.1093/bioinformatics/19.2.185. [DOI] [PubMed] [Google Scholar]
- 16.Pitzer E, Galante P, Ohno-Machado L. TagExpert: Fast custom transcript mapping. Bioinformatics, (accepted) 2009 [Google Scholar]
- 17.Sotiriou C, Wirapati P, Loi S, Harris A, Fox S, Smeds J, et al. Gene expression profiling in breast cancer: understanding the molecular basis of histologic grade to improve prognosis. J Natl Cancer Inst. 2006;98(4):262–272. doi: 10.1093/jnci/djj052. [DOI] [PubMed] [Google Scholar]
- 18.Chanrion M, Negre V, Fontaine H, Salvetat N, Bibeau F, Mac GG, et al. A gene expression signature that can predict the recurrence of tamoxifen-treated primary breast cancer. Clin Cancer Res. 2008;14(6):1744–1752. doi: 10.1158/1078-0432.CCR-07-1833. [DOI] [PMC free article] [PubMed] [Google Scholar]
- 19.Kim J, Galante P, Hinske C, Kuo W, Lacson R, Ohno-Machado L. ExpressionCombiner: A web based tool for cross-platform analysis of gene expression data. AMIA Summit (accepted) 2009 [Google Scholar]
- 20.Lacson R, Pitzer E, Hinske C, Galante P, Ohno-Machado L. Evaluation of a Large-Scale Biomedical Data Annotation Initiative. BMC Bioinformatics (accepted) 2009 doi: 10.1186/1471-2105-10-S9-S10. [DOI] [PMC free article] [PubMed] [Google Scholar]
- 21.Khatri P, Bhavsar P, Bawa G, Draghici S. Onto-Tools: an ensemble of web-accessible, ontology-based tools for the functional design and interpretation of high-throughput gene expression experiments. Nucleic Acids Res. 2004;32(Web Server issue):W449–W456. doi: 10.1093/nar/gkh409. [DOI] [PMC free article] [PubMed] [Google Scholar]
- 22.Whiteford N, Skelly T, Curtis C, Ritchie ME, Lohr A, Zaranek AW, et al. Swift: primary data analysis for the Illumina Solexa sequencing platform. Bioinformatics. 2009;25(17):2194–2199. doi: 10.1093/bioinformatics/btp383. [DOI] [PMC free article] [PubMed] [Google Scholar]
- 23.Morozova O, Marra MA. Applications of next-generation sequencing technologies in functional genomics. Genomics. 2008;92(5):255–264. doi: 10.1016/j.ygeno.2008.07.001. [DOI] [PubMed] [Google Scholar]


