

Abstract
Using in situ atomic force microscopy (AFM), we investigate the inhibition of calcium oxalate monohydrate (COM) step growth by aspartic acid-rich peptides and find that the magnitude of the effect depends on terrace lifetime. We then derive a time dependent step-pinning model in which average impurity spacing depends on the terrace lifetime as given by the ratio of step spacing to step speed. We show that the measured variation in step speed is well fit by the model and allows us to extract the characteristic peptide adsorption time. The model also predicts that a crossover in the timescales for impurity adsorption and terrace exposure leads to bistable growth dynamics described mathematically by a catastrophe. We observe this behavior experimentally both through the sudden drop in step speed to zero upon decrease of supersaturation as well as through fluctuations in step speed between the two limiting values at the point where the catastrophe occurs. We discuss the model’s general applicability to macromolecular modifiers and biomineral phases.
Introduction
Growth and dissolution of crystals from aqueous solutions are ubiquitous phenomena in industrial, biological and environmental settings. Whether these processes occur through technological or natural processes, the effect of impurities is a central issue because they are often unavoidable constituents or intentionally added to control growth rate, crystal habit, or physical properties. Much of what is understood about impurity-crystal interactions comes from investigations of atomic or small-molecule modifiers such as metal cations or oxy-anions.1-6 But one of the defining features of biomineral systems is that the interactions of proteins, peptides and other macromolecules with inorganic constituents are responsible for directing crystallization and dissolution.7 Even in environmental settings where mineral formation and dissolution is not under biologic control, organic molecules that adsorb at mineral surfaces are likely to impact the reaction kinetics.8
The dynamics of macromolecular interactions with crystal surfaces should differ from those of small ionic species because biomolecules are often highly-charged polyelectrolytes and their adsorption rates should be slow due to their large size. Moreover, in the case of long-chain polypeptides or proteins, conformational relaxation is likely to further slow the transition to the surface-bound state. While some studies have looked at the role of sequence,9 chain length,10 and charge11 in the effects of peptides on kinetics and morphology, none have investigated the role of adsorption rates on step dynamics.
The reason why the adsorption rate should be significant is that terraces between steps are only exposed to the surrounding solution for the time it takes a step to advance one terrace width. If a step has speed ν and the terrace is of width L, the terrace lifetime is τT = L/ν (Fig. 1a). As long as the characteristic adsorption time τι of the impurity is much less than τT, all steps see the same impurity coverage θ. However, if τι is comparable to τT, then θ becomes a function of ν and L and a set of time-dependent phenomena such as step bunching12,13 and growth-rate fluctuations14,15 are expected. Moreover, the dependencies of these effects on terrace lifetime offer an opportunity to probe the impurity adsorption dynamics.
Fig. 1.

(a) Diagram illustrating addition of solute to step and relationship between terrace exposure time, step speed and terrace width. (b-e) AFM images of growth hillocks on COM face during growth in (b) peptide-free solution and (c-e) following exposure to 10nM D3S solution. White and black arrows in (c) indicate small (d) and large (e) hillocks, respectively. Horizontal dimensions: (b) 13 μm; (c) 12 μm; (d,e) 5 μm.
Here we report results from an in situ AFM investigation of step kinetics on calcium oxalate monohydrate (COM) surfaces in the presence of synthetic peptides. We previously found that, at sufficiently high coverage, these peptides slowed steps by creating pinning sites that induced step curvature,16 thereby increasing the chemical potential of the step in accordance with the classic Gibbs-Thomson effect.17 However, we showed that the dependence of growth rate on driving force displayed an anomalous non-linear dependence. We proposed that the reason for the non-linearity was that the slow rate at which these peptides adsorbed led to a crossover in the ratio of τι to τT. As a result, ν became a function of L, leading to the observed effect. Here we provide a direct measurement of the dependence of step speed on terrace lifetime and interpret the measured dependence by deriving a time-dependent step-pinning model. The model correctly predicts the observed dependence and enables us to extract the value of τι. It also predicts, as a consequence of the crossover, a discontinuous jump in step speed with decreasing supersaturation from a value close to that of the peptide-free system to zero. This result is supported by experiments that show the step speed does indeed exhibits this jump. Morover, in the vicinity of τT = τι, growth is observed to be bi-stable and is marked by fluctuations in step speed between the two end-states.
Calcium oxalate monohydrate (COM, CaC2O4·H2O), is the dominant mineral phase of human kidney stones.18 COM growth is inhibited by acidic urinary molecules, particularly the small molecule citrate19,20 and the protein osteopontin (OPN).21,22 Like many proteins associated with biominerals, OPN is rich in aspartic acid (D) residues.22,23 But OPN is a complex molecule of unknown structure and is difficult to obtain with high purity. So, to look at the effects of adsorption rates in a well-controlled system, we employed a 27 residue linear D-rich peptide that was designed to act as a surrogate for previously-studied D-rich domains of OPN.24 The abbreviated sequence for the peptide is (DDDS)6DDD (S = serine), referred to here as D3S.
Methods
AFM imaging of COM growth was carried out via in situ AFM in contact mode at 25°C, under flowing solution using methods described in detail elsewhere.20 The concentration of the peptides, which were synthesized and purified using standard techniques.25,26 was varied between 0 and 10 nM. The COM crystals used for these experiments were grown in vitro using a gel method.21 Aqueous solutions of calcium oxalate with calcium-to-oxalate ratio = 1 were prepared using reagent-grade K2C2O4 and CaCl2·2H2O dissolved in distilled deionized (18MΩ) water. The ionic strength was fixed using reagent-grade KCl, pH was adjusted to 7.0 ± 0.5 before each experiment and supersaturation was held constant at values in the range of 0 to 1.1. (Supersaturation is defined by where Δμ represents the difference in chemical potential per COM molecule between solution and crystal, kB is Boltzmann’s constant, T is the absolute temperature, the ais are the activities of the respective components and Ksp is the solubility constant determined from the activity of calcium and oxalate for ν = 0. See reference 20 for details.)
Results and Discussion
Growth of COM on the face in peptide-free solution occurred on elementary steps generated at dislocation hillocks. These hillocks had a range of sizes due to natural differences in source activity, but all exhibited the characteristic triangular shape (Fig. 1b) with three step orientations, the crystallographically identical and and the distinct [101]. The presence of D3S modified the morphology of all growth hillocks, but small and large hillocks were affected differently. Figure 1c-e shows the in situ morphology of large and small hillocks during growth after 240 minutes exposure to 8 nM D3S (supersaturation σ = 0.84). The images show that, within micron-scale regions, small hillocks became discoid while larger hillocks essentially retained their triangular shape.
In general, the extent to which these differences were observed strongly depended on solution supersaturation σ and peptide concentration Ci. At low σ, all hillocks became fully discoid at the peptide concentrations used here (2 nM, 5 nM, 10 nM) and hillock rounding was less pronounced as σ increased or Ci decreased. But changes to smaller hillocks were always more drastic and appeared more rapidly than did changes to larger hillocks. At higher values of σ, small hillocks became rounded at concentrations where no changes were seen in the morphology of large hillocks.
The source of these differences is related to the reason why some hillocks are larger than others, which is well understood from numerous theoretical and experimental studies.27,28 The relative heights of hillocks are determined by their growth rates normal to the surface R = νh/L, where h is the step height. Hillocks that grow faster become taller. In pure solution, because v is the same for all steps, differences in R are completely controlled by L, which is a function of both the number of steps emitted from a dislocation source and the period of rotation of the growth spiral. The reasons why these factors differ amongst sources are unimportant for this study. The salient point is that, in peptide-free solution, hillock size reflects L and therefore τT.
To investigate the relationship between peptide effects and τT, we directly measured both L and ν for the [101] steps on a variety of hillocks in both peptide-free and peptide-containing growth solutions for a range of σ’s and Ci’s. To extract the peptide effect, we first accounted for the fact that, even in the peptide-free system, ν exhibits a dependence on L because both are dependent on σ.
For COM — as for many other solution-grown crystals — step speeds follow20:
| (1) |
where ω is the molecular volume of COM (1.1 ×10⁻²² cm−3) and β is the kinetic coefficient for attachment of growth units to the step edge.
L is related to σ via the Gibbs-Thomson effect27,28:
| (2) |
where Γ is a constant (~19) that takes into account hillock geometry and the dependence of ν on step length, rc is the critical step radius, α is the average step edge energy per unit step height, kB is Boltzmann’s constant and T is the absolute temperature. P is the perimeter of the dislocation source and is zero for hillocks with simple sources (i.e., source for which the steps are emitted from a single point). The hillocks analyzed here appear to be generated by simple sources, but we cannot rule out a spread in the dislocation sources below our resolution or the effects of strain near the dislocation core. However, compared to the first term in Eq. 2, P is expected to be small. Rearranging Eq. 1, combining it with Eq. 2 with P=0 and setting τT = L/ν gives:
| (3) |
Figure 2 shows the measured dependence of ν on τT for the peptide-free system. As expected, large ν corresponds to high σ and small τT, while small ν corresponds to low σ and large τT. The solid curve is a fit to the data according to Eq. 3 and the inset presents the data in the natural variables of Eq. 3 where A’ and b have been taken from that fit. The scatter in the data within the inset is greater along the abscissa (τT−1) than the ordinate. Moreover, the greatest scatter occurs at the highest values of σ. The source of this scatter is most likely the effect of perimeter P. As Eq. 3 shows, non-zero values of P reduce the value of (τT−1) and are most significant at high σ where rc is the smallest.28 The scatter in ν is consistent with previous analyses of fluctuations in AFM data, which are typically between ±10 and 20%. The close agreement between the measured dependence of ν on τT and the prediction of Eq. 3 demonstrates that this analysis provides an excellent description of the data for the pure system.
Fig. 2.

Relationship between step speed on terrace lifetime in peptide-free solution for COM . Main plot shows raw data and inset presents data in form given by Eq. 3. Solid curves are fits to data according to that equation.
Fig. 3 gives the measured dependence of ν on L for the peptide-bearing solutions. Each color in Fig. 3 represents one peptide concentration, and includes data from each supersaturation. The data are raw, unaveraged values of ν and τT. Comparing the results for 2 nM D3S and 10 nM D3S is helpful for understanding the data. Consider first, the data for 2 nM, which are given by the red circles. The data for σ = 0.84, 0.65 and 0.51 are represented by the red clusters at ν ~ 30 nm/s, 20 nm/s, 15 nm/s respectively. The tight clustering of these groups, and their positions along the peptide-free curve (dotted line, as in inset of Fig. 2) is a reflection of the lack of peptide effect. However, for σ = 0.37 (red cluster at ν ≤ 8 nm/s), all data points for this σ lie below the curve for the peptide-free system (dotted line), reflecting the effect of the peptide. Moreover, these data are spread out and include all red circles at larger values of τT(smaller values of ν). Because measurements for this study were made on multiple hillocks of difference sizes and at different stages of peptide effect, this data group includes steps affected to both greater and lesser degrees by the peptide, accounting for the wide spread of the data over τT.
Fig. 3.

Relationship between step speed and terrace exposure time for COM during growth in presence of D3S peptide. Solid curve is fit to data according to Eq. 8. It gives a characteristic adsorption time of ~40s. Dashed curves are illustrations of parameter variations encompassing all data, with main contribution to variation coming from approximation eσ ≈ (A’ b / τT)1/2. Dotted curve is the fit to peptide–free data from Fig. 2, indicated here as “Pure curve”.
As Ci was increased, inhibition was observed at successively higher σ’s. For example, at 10 nM D3S, only the highest supersaturation (σ = 1.04) was unaffected by the peptide. Therefore, in the 10 nM series, only the data for that supersaturation (blue circles near v ~ 40 nm/s) lie on the peptide-free curve, while the data for all lower values of σ lie below the peptide-free curve at very high values of τT and very low step speeds. Consistent with these results, the value of σ at which the data for Ci = 5 nM deviate from the peptide-free curve is intermediate between those observed at 2 and 10nM. Taken in aggregate, the τT’s at which the various data sets deviate from the curve for the peptide-free system are in range of 10 to 100 seconds, indicating that τi is somewhere in this range.
In order to quantitatively interpret these results, we use the classic step-pinning model of Cabrera and Vermilyea (C-V model)29, which we successfully employed to explain citrate inhibition of COM15. Support for this model comes from two observations. First, for a given peptide level, step speed was near zero at low values of σ, while at higher σ the step moved at the velocity of the peptide-free system. Second, under conditions where inhibition was observed, the step edges of the hillocks became roughened and serrated, as expected from this model. In addition, a priori one would expect D3S to exhibit a mechanism of COM inhibition similar to that of citrate because both interact through carboxylic groups, three in the case of citrate and 21 for D3S.
To apply the C-V model, we introduce a time-dependent equation for the surface coverage, θ obtained from a simple Langmuir adsorption model:
| (4) |
where Ci is the peptide concentration and kA and kD are the rate coefficients for peptide adsorption and desorption, respectively. This leads to:
| (5) |
To incorporate this into the model, we begin with a general equation for step velocity with step pinning16:
| (6) |
where σd is the value of σ below which growth is completely inhibited and the term in square brackets captures the Gibbs-Thomson effect. (B1 is a proportionality constant that includes the fraction of adsorbed surface impurities that pin steps, a geometric factor that relates linear spacing to areal density, and a percolation threshold for a step moving through a field of pinning sites.20)
Combining Eqns. (5) and (6) gives:
| (7) |
where A3 = A1 θe1/2 At low σ (< 1), eσ ≈ 1+σ . In this regime, both ν and 1/L ~ σ (Eqns. 1 and 2), giving eσ ≈ A4 τT−1/2 and:
| (8) |
This expression must be solved numerically since τT is itself dependent on v through τT=L/v. In Fig. 3, the solid line is a best fit of Eq. 8 to the data and gives a characteristic peptide adsorption time of about 40s. The dashed lines are illustrations of variations in the parameterization of this model that encompass all data, with the most of the variation coming from the approximation eσ ≈ (A’b/τT)1/2. Thus the dependence of inhibition on τT is well described by this time-dependent C-V model. The consistency of all analyses for both the peptide-free and peptide-bearing systems is further illustrated by the value of ωβae, which is found to be approximately 23 nm/s whether calculated from 1) the raw step speed data for the peptide-free system, 2) the fit of Eq. (3) to the peptide-free data, or 3) the fit of Eq. (7) to the data from the peptide-containing systems.
Because τT is between 10 s (high σ) and 100 s (low σ) over the range of conditions used here, there is a crossover in the timescales for peptide adsorption (~40 s) and terrace exposure. As shown previously,16 the consequences for the evolution of growth rate with changing σ are severe. At high σ, τT << τi and peptide adsorption is negligible. However, upon reduction of σ, the value of L increases while ν decreases and, as a result, τT rapidly increases. Consequently, at sufficiently low σ, the coverage of well-bound peptides becomes large enough to appreciably slow the steps. As the steps slow, there is a further increase in τT, which results in yet higher peptide coverage. This then again reduces ν, raising the peptide coverage yet again, and so on. The eventual effect of this positive feedback mechanism is that the step speed exhibits the characteristic feature of a mathematical “catastrophe”,30 i.e., there is a point at which ν spontaneously jumps from a finite value to zero and does not exhibit intermediate values. According to Eq. 7, the supersaturation at which this discontinuous jump to zero occurs is given by:
| (9) |
Thus, at σ* the growth kinetics are bistable, with growth transitioning between two distinct states.
Experimental results shown in Fig. 4 validate this prediction. As σ is reduced, ν rapidly drops to zero with a small shift in supersaturation (Fig. 4a). This behavior is in sharp contrast to the very gradual decrease in growth rate that occurs in systems where τi << τT, as was demonstrated in the COM-citrate system.20,21 The bistable nature of growth in this regime is clearly demonstrated by examining many individual measurements of step speed in the vicinity of the jump. As Fig. 4b shows, v fluctuates between the two predicted end-states.
Fig. 4.

(a) Relative average step speed ν/ν0 vs. σfor the [101] step where ν0 is the speed in the peptide-free system. Two fits of our model are shown for a D3S concentration of 2 nM. The dotted curve is the simple adsorption model in Eq. 7 and the solid curve is the solution of the two-step model given by Eqs. 10 and 11. Dashed lines are guides to eye for D3S concentrations of 5 and 10 nM. (b) Series of individual step speed measurements for σ = 0.37 and a D3S concentration of 2 nM.
While Eq. 7 does capture the sudden drop in step speed, as the dotted curve for Ci = 2nM in Fig. 4a demonstrates, this simple model is unable to reproduce the sharpness of the transition between v=0 and the speed of the pure system. Instead the speed is not predicted to reach that of the peptide-free system until much higher supersaturation was were used in this study. This discrepancy can be removed by recognizing that polypeptides are unlikely to bind in a single event. Rather, there is a series of barriers that slows the adsorption of polypeptides,31 resulting in their passage through multiple configurations before reaching a lowest-energy collapsed state.32 Under supersaturated conditions, step growth should compete with this slow process of peptide binding: When an approaching step arrives at a peptide binding site, if the peptide is well-bound, it can block solute access to kinks; but if it is weakly adhered, as the peptide bonds to the crystal fluctuate, step-propagation can proceed past the site. Thus, whether a peptide impedes step motion depends not only on the characteristic adsorption time, but also on the time to relax into the well-bound state.
In order to incorporate the dynamics of peptide binding into the time dependent C-V model, the assumption of one-step binding must be replaced with a hierarchy of adsorbed states, categorized by the number and strength of surface-peptide contacts as well as the overall configurational entropy. While including the physical details of the complete process are beyond the scope of this paper, we demonstrate a mechanistic improvement to our model by simply including an additional step in the adsorption pathway,
where D, A, and B are respectively the desorbed, weakly adsorbed, and well-bound states. Evidence for a two-step process of peptide adsorption was presented by Zepeda et al,33 who used fluorescence microscopy to study anti-freeze protein adsorption on ice crystals. An analysis of this process was presented in the supporting material of reference 16, but is further developed below. The rates at which the coverage of peptides in the two states evolves with time is given by the following differential equation for the fraction of bound states with time θB(t),
| (10) |
| (11) |
where kAB and kBA are the rates of relaxation into, and out of, the bound state. With θA(t = 0) = θA’(t = 0) = θB(t = 0) = 0, Eqs. 10 and 11 can be solved analytically. The solution to these coupled equations is given by:
| (12) |
The difference between the time dependence of θ for the one- and two-step models is shown in Fig. 5. The most significant change is that the initial rise is no longer linear, but rather has a quadratic dependence, which delays the onset of inhibition. Incorporating the expression for θB(t) into Eq. 6 in place of θ(t) from Eq. 5 gives the dependence of v on σ for the two step model. As the comparison between the single-step and two-step models in Fig. 4a shows (compare dotted and solid curves for Ci = 2nM), the two-step model gives a much better fit to the data. While only two steps were used here, the dramatic improvement suggests that better agreement will follow from kinetic models that contain higher degrees of cooperative collapse.
Fig. 5.
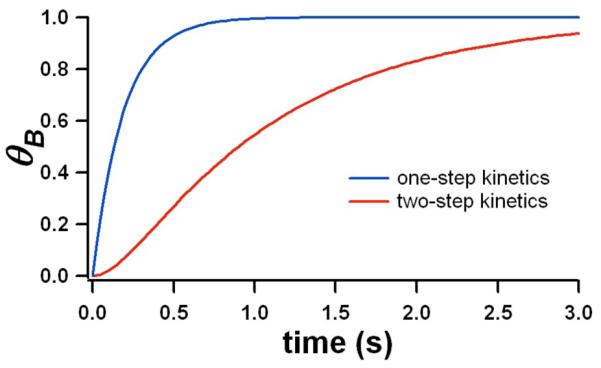
Dependence of fully-bound peptide coverage on time in the one-step and two-step adsorption models for a particular choice of kA, kAB, and kD.
In previous studies, time-dependent impurity coverage was invoked to account for fluctuations in the growth rates of crystal faces observed optically14,15. In one case, the crystals were dislocation-free and thus growth was assumed to occur via 2D nucleation. The stochastic nature of nucleation was hypothesized to produce variations in surface exposure time to unknown impurities in the starting materials, thus leading to episodic growth at essentially constant conditions. In another study, growth of a crystal face during decreasing supersaturation on dislocation-generated steps also exhibited episodic growth. In this case, the researchers assumed that growth on hillocks producing widely spaced steps was poisoned by unknown impurities in the starting solution and the recovery of growth occurred by influx of more closely spaced steps from neighboring growth hillocks. But dependence of step speed on terrace lifetime could not be measured, the impurity species were unknown, and the characteristic adsorption time could not be determined. Because the results presented here are based on a study using impurities specifically designed to exhibit strong binding and an imaging method that enables one to directly measure terrace lifetimes, the detailed models can be adequately tested against experiment and the characteristic adsorption time obtained.
To put the adsorption time determined here in context, we make two observations that highlight the uniqueness of macromolecular modifiers in modulating growth and dissolution of crystals. The first is that the adsorption time derived for Fe3+ on KDP through other means was only ~1s.5 Because terrace lifetimes for COM are ~10 - 100s, no time-dependent effects would be observed for such rapidly adsorbing species. Second, values of β for inorganic crystals all fall within a narrow range (~0.1-1cm/s)28. Thus Eq. 1 shows explicitly that step speed roughly scales with equilibrium solubility, ae. Since biomineral structures must be stable in natural aqueous environments, they are almost always comprised of sparingly soluble materials, such as calcium phosphates and carbonates. In fact most biominerals are even less soluble than COM34 so their step speeds will be slower still. Consequently, obtaining the sharp dependence on supersaturation and modifier concentration seen here would require adsorption times that are as long or longer than for the peptides used in this study. Because small-molecule and atomic impurities are unlikely to exhibit such slow adsorption dynamics, we conclude that macromolecular modifiers are uniquely suited to producing dramatic changes in growth rates over small ranges of supersaturation and modifier concentration in biomineral systems.
Conclusion
In conclusion, using in situ AFM, we find that the magnitude of the inhibition of COM step growth by the aspartic acid-rich peptide (D3S)7D3 depends on the exposure time of the terraces to the surrounding solution. To interpret these results, we developed a time dependent step-pinning model in which average impurity spacing depends on the terrace lifetime as given by the ratio of step spacing to step speed. Application of this model to the measured variation in step speed shows that the experimental results are well described by the model. Furthermore, this analysis enables us to extract the characteristic peptide adsorption time. The model predicts that a crossover in the timescales for impurity adsorption and terrace exposure leads to bistable growth dynamics described mathematically by a catastrophe. We observe this behavior experimentally both through the sudden drop in step speed to zero upon decrease of supersaturation as well as through fluctuations in step speed between the two limiting values at the point where the catastrophe occurs. However, the fit of the model to the experimental results is considerably improved by assuming that the peptides first form a weakly adsorbed state and subsequently relax to a well bund state. The consequence of this two-step process is to sharpen the transition from the freely growing state to the inhibited state.
Acknowledgements
The AFM experiments were supported by grant DK61673 from the National Institutes of Health. Theoretical developments were supported by the Office of Basic Energy Sciences, U.S. Department of Energy, under Contract No. DE-AC02-05CH11231 to Lawrence Berkeley National Laboratory. This work was performed under the auspices of the U.S. Department of Energy by Lawrence Livermore National Laboratory, under Contract DE-AC52-07NA27344.
References
- 1.Sangwal K. Additives and Crystallization Processes: From Fundamentals to Applications. John Wiley and Sons; NJ: 2007. [Google Scholar]
- 2.Sander LM, Tkachenko AV. Phys. Rev. Lett. 2004;93:128102.1. doi: 10.1103/PhysRevLett.93.128102. [DOI] [PubMed] [Google Scholar]
- 3.Jung T, et al. Langmuir. 2004;20:8587–8596. doi: 10.1021/la0488755. [DOI] [PubMed] [Google Scholar]
- 4.Orme CA, et al. Nature. 2001;411:775–778. doi: 10.1038/35081034. [DOI] [PubMed] [Google Scholar]
- 5.Land TA, et al. Nature. 1999;399:442–445. [Google Scholar]
- 6.Rashkovich LN, Kronsky NV. J. Cryst. Growth. 1997;182:434–441. [Google Scholar]
- 7.Mann S. Biomineralization: Principles and concepts in bioinorganic materials chemistry. Oxford University Press; New York: 2001. Ch. 6. [Google Scholar]
- 8.Berner RA, Westrich JT, Graber R, Smith J, Martens CS. Am. J. Sci. 1978;278:816–837. [Google Scholar]
- 9.Kim IW, Darragh MR, Orme C, Evans JS. Cryst. Growth Des. 2006;6:5–10. [Google Scholar]
- 10.Elhadj S, et al. Cryst. Growth Des. 2006;6:197–201. [Google Scholar]
- 11.Elhadj S, et al. Proc. Nat’l. Acad. Sci. USA. 2006;103:19237–19242. doi: 10.1073/pnas.0605748103. [DOI] [PMC free article] [PubMed] [Google Scholar]
- 12.van der Eerden JP, Muller-Krumbhaar H. Electrochim. Acta. 1986;31:1007–1012. [Google Scholar]
- 13.Ristic RI, De Yoreo JJ, Chew CM. Crys. Growth Des. 2008;8:1119–1122. [Google Scholar]
- 14.Chernov, et al. Soviet Phys. Crystallogr. 1981;26:640–645. [Google Scholar]
- 15.Chernov AA, Malkin AJ. J. of Cryst. Growth. 1988;92:432–444. [Google Scholar]
- 16.Friddle RW, Weaver M, Qiu SR, Hoyer JH, Casey WH, De Yoreo JJ. Proc. Nat’l. Acad. Sci. USA. 2010;107:11–15. doi: 10.1073/pnas.0908205107. [DOI] [PMC free article] [PubMed] [Google Scholar]
- 17.Kashchiev D. Nucleation: Basic theory with applications. Butterworths, Heinemann; Oxford: 1999. [Google Scholar]
- 18.Coe FL, Parks JH, Asplin JR. New Eng. J. Med. 1992;327:1141–1152. doi: 10.1056/NEJM199210153271607. [DOI] [PubMed] [Google Scholar]
- 19.Pak CY. Miner. Electr. Metab. 1994;20:371–377. [PubMed] [Google Scholar]
- 20.Weaver ML, et al. J. Cryst. Growth. 2007;306:135–145. [Google Scholar]
- 21.Qiu SR, et al. Proc. Natl. Acad. Sci. USA. 2004;101:1811–1815. doi: 10.1073/pnas.0307900100. [DOI] [PMC free article] [PubMed] [Google Scholar]
- 22.Asplin JR, et al. Kidney Int. 1998;53:194–199. doi: 10.1046/j.1523-1755.1998.00739.x. [DOI] [PubMed] [Google Scholar]
- 23.Shiraga H, et al. Proc. Nat’l. Acad. Sci. USA. 1992;89:426–430. doi: 10.1073/pnas.89.1.426. [DOI] [PMC free article] [PubMed] [Google Scholar]
- 24.Wang L, et al. Langmuir. 2006;22:7279–7285. doi: 10.1021/la060897z. [DOI] [PubMed] [Google Scholar]
- 25.Fields GB, Noble RL. Int J Peptide Protein Res. 1990;35:161–214. doi: 10.1111/j.1399-3011.1990.tb00939.x. [DOI] [PubMed] [Google Scholar]
- 26.Hoyer JR, Asplin JR, Otvos L. Kidney Int. 2001;60:77–82. doi: 10.1046/j.1523-1755.2001.00772.x. [DOI] [PubMed] [Google Scholar]
- 27.Rashkovich LN, Mkrtchyan AA, Chernov AA. Sov. Phys. Crystallogr. 1985;30:219. [Google Scholar]
- 28.De Yoreo JJ, Vekilov P. Biomineralization. In: Dove PM, De Yoreo JJ, Weiner S, editors. Reviews in Mineralogy. Vol. 54. Mineralogical Society of America; Washington, DC: 2003. pp. 57–93. [Google Scholar]
- 29.Cabrera N, Vermilyea DA. In: Growth and Perfection of Crystals. Doremus RH, Roberts BW, Turnbull D, editors. Wiley; New York: 1958. pp. 393–410. [Google Scholar]
- 30.Arnold VI. Catastrophe Theory. Springer; New York: 1986. [Google Scholar]
- 31.Harding JH, et al. Chem Rev. 2008;108:4823–4854. doi: 10.1021/cr078278y. [DOI] [PubMed] [Google Scholar]
- 32.Bachmann M, Janke W. Phys Rev Lett. 2005;95:058102. doi: 10.1103/PhysRevLett.95.058102. [DOI] [PubMed] [Google Scholar]
- 33.Zepeda S, Yokoyama E, Uda Y, Katagiri C, Furukawa Y. Cryst. Growth Des. 2008;8:3666–3672. [Google Scholar]
- 34.Sohnel O. J. Cryst. Growth. 1982;57:101–108. [Google Scholar]