

Abstract
Humans show tremendous phenotypic diversity across geographically distributed populations, and much of this diversity undoubtedly results from genetic adaptations to different environmental pressures. The availability of genome-wide genetic variation data from densely sampled populations offers unprecedented opportunities for identifying the loci responsible for these adaptations and for elucidating the genetic architecture of human adaptive traits. Several approaches have been used to detect signals of selection in human populations, and these approaches differ in the assumptions they make about the underlying mode of selection. We contrast the results of approaches based on haplotype structure and differentiation of allele frequencies to those from a method for identifying single nucleotide polymorphisms strongly correlated with environmental variables. Although the first group of approaches tends to detect new beneficial alleles that were driven to high frequencies by selection, the environmental correlation approach has power to identify alleles that experienced small shifts in frequency owing to selection. We suggest that the first group of approaches tends to identify only variants with relatively strong phenotypic effects, whereas the environmental correlation methods can detect variants that make smaller contributions to an adaptive trait.
Keywords: climate, subsistence, genome-wide association studies, pigmentation, energy metabolism, soft sweeps
1. Introduction
In the past 150 years since Darwin first described the process of natural selection in ‘On the origin of species’ (Darwin 1859), extensive progress has been made towards understanding how evolutionary processes have shaped diversity within and between species. One landmark was the Human Genome Project, which led to tremendous advances in the development of technologies for studying genetic variation at the DNA level. As a result, the volume of genetic variation data available for humans and other species has increased enormously. Although we are still far from understanding how the code contained within the human genome—combined with environmental factors—results in the particular details of a human phenotype, technologies that aid in genome-wide annotation are providing a wealth of information. By integrating information from disparate sources, it may be possible to synthesize this knowledge to clarify the genetic basis for complex phenotypes and to improve our understanding of the selective forces that shaped these phenotypes.
Over 400 genome-wide association studies (GWASs) have been published in the past few years (Hindorff et al. 2009), significantly increasing our knowledge of the genetic variation that influences a large number of traits, especially clinical phenotypes, relative to the insights gained from previous candidate genes and low coverage family-based linkage approaches. However, the results of these GWASs have been somewhat disappointing because for most traits, the genetic variants identified can explain only a small proportion of the variation in risk (Manolio et al. 2009). These results suggest that most human phenotypes tend to be complex, with contributions from variants at many loci, each with a relatively small effect (Hill 2010).
In parallel to the studies of the genetic basis of common traits, the availability of dense genome-wide single nucleotide polymorphism (SNP) data for worldwide populations (Consortium 2005; Hinds et al. 2005; Frazer et al. 2007) has made it possible to scan the human genome for signals of positive natural selection. These studies have detected outliers based on differentiation of allele frequencies between broadly defined populations (Barreiro et al. 2008; Coop et al. 2009; Pickrell et al. 2009), on extended regions of haplotype homozygosity (Voight et al. 2005; Wang et al. 2006; Coop et al. 2009; Pickrell et al. 2009), on frequency spectrum-based statistics (Carlson et al. 2005; Williamson et al. 2007) or on some combination of these methods (Jakobsson et al. 2008). Much of the work aimed at detecting signals of selection has been strongly influenced by the so-called ‘hitch-hiking’ or ‘hard sweep’ model, in which a new advantageous mutation is driven quickly to high frequency and ultimately to fixation (Smith & Haigh 1974). As a consequence, these methods are likely to be strongly biased towards detecting advantageous variants at high frequency (for a discussion, see Pritchard et al. 2010).
Additional modes of selection that are likely to apply to human populations include temporally and spatially varying selective pressures (Gillespie 1991). Since the human species first appeared in Africa 100–200 thousand years ago, human populations have faced a number of new selective pressures arising from changes in the environment. Notable examples include the dispersal out of Africa, climatic changes in the Ice Ages and changes in food availability and subsistence strategies (which in turn influence other aspects of the environment, e.g. diet or pathogen exposure). As humans faced these new selective pressures, there were likely to be cases in which new advantageous mutations increased in frequency quickly, as expected under the hard sweep model. Relative to new advantageous variants, which are expected to arise only rarely (the exact rate depends on mutational target size and population size), standing variation may afford a faster adaptive response. As a result, in cases in which selection pressures changed rapidly, selection on standing variation may have played an especially important role in adaptation. Compared with models of selection on new variants, models of selection acting on standing variation make different predictions about the population dynamics of the favoured allele and the signature of selection. This is mainly because a previously neutral allele that has been present for a long time in the population underwent an initial phase of random drift before being driven to high frequency by selection. This initial neutral phase has important consequences for the expected patterns of linked variation, and, as a result, for the effectiveness of tests based on this variation (Hermisson & Pennings 2005; Przeworski et al. 2005; Pennings & Hermisson 2006a,b). For example, tests based on the extended haplotype homozygosity and the allele frequency spectrum have limited power to detect selection on standing variation. Therefore, if such selection was a frequent response to the environmental changes that occurred during human evolution, signals of temporally varying selection may have been missed by selection scans based on the hard sweep model.
Human environments and selective pressures related to these environments vary greatly across geographical regions and across populations. Human adaptations to spatially varying selective pressures are evident in the geographical distributions of many traits. Classical work showed that significant correlations exist between body mass and temperature (Roberts 1953; Katzmarzyk & Leonard 1998), consistent with the long-standing hypotheses that variation in body size and proportions are adaptations to maintain temperature homeostasis (Bergmann 1847; Allen 1877). Further evidence for adaptations to cold stress in human metabolism comes from studies of arctic populations, which exhibit elevated basal metabolic rates compared with non-indigenous arctic populations (Leonard et al. 2002). Like body mass, variation in skin pigmentation is strongly correlated with geographical and climate variables, i.e. distance from the equator and solar radiation, and is likely to be adaptive (Jablonski & Chaplin 2000; Relethford 2002). Specifically, where levels of UV light are highest, dark pigmentation is protective against its negative effects, and where levels of UV light are lower, lighter pigmentation allows penetration of the skin to produce vitamin D, which is necessary for calcium absorption and bone growth. Further evidence for a correlation between adaptive phenotypes and geographical variation includes differences in the oxygen saturation of arterial haemoglobin observed between populations living at high and low altitudes (Beall 1997). These examples show that, in many cases, knowing the genetic basis of phenotypic variation is not necessary for determining the selective pressures that underlie phenotypic variation. However, clarifying the genetic architecture of a particular trait may shed light on the underlying evolutionary processes.
2. Genome scans for signals of hard sweeps
Most methods for identifying targets of selection do not use information about human ecology and, therefore, are agnostic about the underlying selective pressures. These methods, applied in the context of a genome scan for selection, tend to identify advantageous variants that were driven quickly to high frequency by selection. Among those that detect alleles that are still segregating among human populations, tests based on haplotype structure and on the divergence of allele frequencies among populations have been widely used. These approaches have revealed a number of strong signals at individual genes as well as in specific pathways.
Among the signals for individual genes, one of the strongest is for the lactase gene region in Europeans. This signal is associated with a mutation in an enhancer approximately 14 kb upstream to the LCT gene (Bersaglieri et al. 2004; Voight et al. 2006; Sabeti et al. 2007), which is responsible for lactase expression in adult life, a trait hypothesized to be advantageous in agro-pastoral populations where milk is a major staple of the adult diet. Interestingly, additional lactase persistence mutations have been observed in sub-Saharan African and Middle Eastern populations; these mutations occur within the same enhancer and are located only a few base pairs away from each other, suggesting that the mutational target for the lactase persistence phenotype is very small (Tishkoff et al. 2007; Enattah et al. 2008). These additional regional mutations also have signals of selection based on extended haplotype homozygosity. Another strong signal detected by tests of haplotype homozygosity (Tang et al. 2007) and allele frequency divergence (Akey et al. 2004; Sabeti et al. 2007; Barreiro et al. 2008; Myles et al. 2008) occurs at the EDAR gene, which is known to be involved in the development of hair follicles, teeth and sweat glands; this signal appears to be limited to East Asians.
An additional class of loci where strong signals have been observed across different selection scans is genes involved in pigmentation; many of these genes show both extended haplotype homozygosity and large differences in allele frequencies between African and non-African populations. Interestingly, the geographical patterns observed for variants in pigmentation genes suggest that parallel evolution resulted in light pigmentation in high latitude populations living in Europe and Asia (Norton et al. 2007; Coop et al. 2009). Overall, fewer than 20 pigmentation genes have been reported to carry signatures of positive natural selection, and most of them occur at near fixation frequencies in either Europeans or East Asians or both (reviewed in Hancock & Di Rienzo 2008).
3. Genome scans for environmental correlations
Given that the distributions of human phenotypes, such as skin pigmentation and body mass, are significantly correlated with geographical (e.g. latitude) or environmental (e.g. UV radiation) variables, the alleles underlying these phenotypes may also be correlated with the same variables.
Several studies have looked for evidence of selection by comparing the distributions of allele frequencies at variants in candidate genes with the distributions of climate variables across human populations. Two of these studies focused on variants implicated in salt-sensitive hypertension and found evidence for a decrease in the frequency of risk variants with increasing distance from the equator (Thompson et al. 2004; Young et al. 2005), consistent with the hypothesis that sodium retention plays a role in heat tolerance and is therefore greatest in hot, humid environments (Gleiberman 1973). Likewise, candidate genes for common metabolic disorders, such as type 2 diabetes and obesity, harbor variation that is strongly correlated with climate variables (Hancock et al. 2008).
Information about additional aspects of human environments can be used for the identification of alleles underlying local adaptations. Using this strategy, differences in allele frequencies have been observed among populations based on dietary specializations. For example, the lactase persistence variants discussed earlier tend to occur at higher frequency in agro-pastoral populations (Bersaglieri et al. 2004; Tishkoff et al. 2007). Another example is the increase in the number of amylase gene copies that was observed for populations that consume high levels of starch (i.e. horticultural and agricultural populations) relative to populations that do not (Perry et al. 2007); because amylase breaks down starch in the saliva, the increase in gene copy number is thought to be an adaptation to a specialized diet.
However, one challenge for approaches that aim to assess the evidence of selection from correlations between population allele frequencies and environmental variables is that correlations could result from population structure alone; therefore, one needs to test for an effect of environmental variables over and above the effect of population structure. An additional challenge is that subtle differences in allele frequencies due to environmental correlations may be masked by the geographical structure of human variation. Methods that control for these effects of population structure can overcome both types of problems.
We have recently developed an approach that uses information about human ecology to detect adaptations to different environmental pressures while also controlling for the important effect of population structure in shaping the spatial distribution of beneficial alleles. More specifically, we used the genotype data for 642 690 autosomal SNPs collected in 1344 unrelated individuals from 61 worldwide populations (Li et al. 2008; A. M. Hancock & A. Di Rienzo 2009, personal communication; Hancock et al. 2010) to scan the genome for adaptive alleles that are significantly correlated with any of several aspects of the environment, including climate, ecoregion, main dietary component and mode of subsistence. For each SNP, we assessed the evidence for a correlation between allele frequency and each environmental variable using a Bayesian linear model method that controls for the covariance of allele frequencies between populations due to population history and accounts for differences in sample sizes among populations (Coop et al. in press). This method yields a Bayes factor (Coop et al. in press), which is a measure of the support for a model in which an SNP allele frequency distribution is linearly dependent on an environmental variable in addition to population structure, relative to a model in which the allele frequency distribution is dependent on population structure alone. Consistent with the notion that environmental pressures shaped the spatial distribution of human polymorphisms, we found a striking enrichment of strong correlations at SNPs enriched for functional variation (i.e. genic and non-synonymous SNPs) relative to SNPs that are likely to be evolving neutrally (i.e. non-genic SNPs). Particularly strong signals were observed for several climate variables, polar ecoregion, foraging subsistence and a diet rich in roots and tubers. These results and the methods used are described in greater detail in a recent paper (A. M. Hancock & A. Di Rienzo 2009, personal communication; Hancock et al. 2010). Here, we review and present an overview of the main conclusions. The two examples in figure 1 illustrate the importance of controlling for population structure to expose these signals, many of which are due to subtle, but concordant, allele frequency shifts across geographical regions. These shifts are detectable even in the face of the large effect that population structure has in shaping the geographical distributions of allele frequencies.
Figure 1.

Variation in allele frequencies across populations for (a) rs7954576, a SNP 8 kb upstream of IL22, and (b) for rs7071213, a SNP in the PNLIPRP3 coding region, which show strong signals of selection with foraging as a mode of subsistence. Populations, ordered by geographical region, are shown on the x-axis and allele frequency is shown on the y-axis. Populations that use foraging as the mode of subsistence are shown in red and all others are shown in blue. Points represent allele frequencies for individual SNPs, and the horizontal bars represent the mean allele frequencies across regions.
The environmental correlation approach profoundly differs from previous selection scans because it uses multiple contrasts between populations that live in different environments while also controlling for population structure. This is illustrated in figure 1, which shows two examples of SNPs that have strong signals with the foraging subsistence strategy. If the patterns for these SNPs are examined on a worldwide scale, the differences in allele frequencies between foraging and non-foraging populations are not compelling because of the strong effect of population structure on variation in allele frequencies. However, when the populations are separated by region, a more striking pattern emerges. As a result, even variants with small phenotypic effects may show signatures of selection, making this approach suitable to detect selection acting on quantitative traits. In fact, selection models of quantitative traits predict that when a selection pressure changes, small allele frequency shifts will occur at many loci until the population reaches a new phenotypic optimum (Falconer & MacKay 1996; Pritchard et al. 2010). It is important to note, however, that our approach has the greatest power in cases in which an advantageous allele was present and was acted on by selection in multiple geographical regions. Because most human variation is shared across populations, this is not a major limitation. Under this scenario, the signals that we detect are likely to be cases of selection on standing—rather than new—alleles.
4. Properties of the selection signals detected by different approaches
(a). Overlap in selection signals
While approaches based on FST (which provides a measure of the amount of differentiation between populations at a given SNP) and on environmental correlations superficially ask similar questions (i.e. about differences in allele frequencies across populations), it is unclear a priori whether the results of the two approaches are similar. To ask this question, we compared the results of the climate correlation analysis with results of a simple FST analysis. For each of the Illumina 650Y SNPs, we calculated global FST values, based on the average squared deviation between regional allele frequencies and the global average (Weir & Cockerham 1984). For both the FST and climate analyses, we calculated the statistics within two geographically defined subsets of populations: one includes populations from Africa and Western Eurasia (AWE) and the other includes populations from Africa, East Asia and Oceania (AEA). We found that the overall correlation between the test statistics is very low (Spearman rank correlation lower than 0.041); however, there is a slight enrichment of overlapping signals between the upper 5 per cent tails of the test statistics (1.36- and 1.11-fold in the AWE and AEA subsets, respectively, relative to chance expectations).
Likewise, we investigated the overlap between signals detected in the climate correlation analysis and those based on haplotype structure using the integrated Haplotype Score (iHS), which summarizes information about the haplotype structure around a polymorphic site. We obtained iHS values for each of the Illumina 650Y SNPs from Kudaravalli et al. (2009), in which iHS was calculated separately for each of the three populations: Yoruba from Nigeria, CEPH Europeans and Asians (Han Chinese and Japanese) using the method of Voight et al. (2006). Because the iHS-based test has power to detect selection acting on new advantageous alleles, this analysis may shed light on the proportion of environmental correlation signals that are due to hard sweeps versus selection on standing variation. For the two types of methods, the overall correlation between the test statistics is very low (Spearman rank correlation lower than 0.018). By looking at the overlap in the 5 per cent tails of the two types of analyses, we found that the overlap in signals was the same as that expected by chance. However, some of the strongest signals for the AWE subset coincided between the two analyses. One possible explanation is that these signals are false positives in one or both analyses; alternatively, these climate signals may be due to hard sweeps.
(b). Shifts in allele frequencies for SNPs with signatures of selection
The sets of variants that are likely to be detected by each of the methods compared earlier (climate correlations, FST and iHS) may differ also with respect to their allele frequencies, as a consequence of the differences in the question asked by each method. For example, the climate correlation approach compares allele frequencies among populations that differ with respect to climate, whereas most implementations of the FST approach compare allele frequencies between pairs of populations that differ in terms of geographical location (and not necessarily climate or other aspects of the environment). Although iHS does not explicitly use information about allele frequency, its power is a function of the current allele frequency. Computer simulations of a hard sweep model showed that there is reasonable power (greater than 50%) only when the selected allele has frequency higher than 55 per cent and there is virtually no power (less than 5%) to detect advantageous alleles at frequency lower than 20 per cent ((Voight et al. 2005) figure 2). Moreover, if selection acts on standing variation, the power of neutrality tests based on haplotype homozygosity is inadequate if the beneficial allele occurred at frequency greater than 5 per cent prior to the onset of selection (Hermisson & Pennings 2005; Przeworski et al. 2005). This implies that, conditional on having a strong iHS signal, a variant is likely to have had very low or zero frequency at the onset of selection and, hence, that the current allele frequency for that variant can be taken as a crude estimate of the shift in frequency caused by selection.
Figure 2.

(Opposite.) Plots comparing the distributions of inferred allele frequency shifts caused by selection for SNPs with the strongest signatures (i.e. the top 0.01% signals). (a) Distributions of inferred frequency shifts for 36 populations in the AEA subset (see main text for details on calculations of frequency shifts). FST and climate correlations are calculated for the same set of 36 populations, and iHS is calculated for the HapMap Asian population. (b) Distributions of inferred frequency shifts for 33 populations in the AWE subset (see main text for details on calculations of frequency shifts). FST and climate correlations are calculated for the same set of 33 populations, and iHS is calculated for the HapMap CEPH European population. (c) Distributions of frequency shifts for worldwide populations with dichotomous variables. For these variables, the shift is defined as the average regional difference between allele frequencies for the two classes of populations. In all plots, SNPs are pruned so that only the SNP with the strongest signal is included for each 1 Mb genomic region.
Therefore, FST and iHS tend to detect variants with very strong patterns (e.g. large differences in allele frequencies for FST and high allele frequencies for iHS). However, the environmental correlation method, which uses information about environmental pressures while controlling for population structure, is likely to have power to detect more subtle changes in allele frequency. To investigate this question empirically, we considered variants with the most extreme signals detected by each of the methods mentioned earlier. Here, our goal is to estimate the shift in allele frequency caused by natural selection for each class of signals. Because estimating this shift accurately is challenging, we obtain a crude estimate by calculating for each signal the difference between the current allele frequency and an allele frequency that is assumed to be close to the frequency prior to the onset of selection; this pre-selection frequency varies across classes of signals owing to differences in power under different selection models and differences in the specific question asked by each test statistic. For SNPs correlated with climate, the shift is defined as the difference between the allele frequency of the populations with the maximum and minimum values for each climate variable. For SNPs with strong signals with iHS, the shift is defined as the frequency of the allele with evidence of selection; this assumes that the pre-selection allele frequency was 0. (To consider the possibility of selection on standing variation, we also calculated the difference between the allele frequency in the population with a significant iHS and the lowest frequency for that variant across HapMap populations and found very similar results; data not shown.) For SNPs with high FST values, the shift is defined as the difference between the maximum and minimum allele frequencies. As shown in figure 2a,b, the top iHS signals in the European and the Asian populations are all skewed towards high frequency, with a peak at frequency greater than 80 per cent. The top FST signals have even greater frequency shifts, with a peak at near-fixation frequency. Although the environmental correlation signals may sometimes involve allele frequency differences that are as large as those for the FST signals, there is still a marked difference between the two distributions. Therefore, these empirical results confirm the expectations based on power analyses that these two approaches tend to detect a particular class of beneficial alleles, i.e. those that occur at high frequency.
The allele frequency shifts for iHS and FST contrast sharply with those from the environmental correlation analyses (figure 2), which tend to detect signals associated with smaller allele frequency shifts. For the climate variables, the allele frequency shifts are less than 20 per cent, and for the dichotomous variables (i.e. ecoregions, foraging mode of subsistence and roots and tubers as the main dietary component), the average shifts in allele frequency centre around 30 per cent or less. This finding supports the idea that this approach has greater power to detect adaptive alleles that show subtle shifts in allele frequencies among populations. A possible caveat to this interpretation is that the allele frequency shifts could be greater in populations living in more extreme conditions than those sampled. However, for most environmental variables, we include populations that span the range of variability in humans.
(c). Ages of alleles with signatures of selection
If the signals detected by the environmental correlations are largely due to selection acting on standing variants with a broad geographical distribution, these variants are expected to be relatively old and to predate the onset of selection. To gain some insights about the age of these signals relative to random alleles in the genome, we used the algorithm of Voight et al. (2006), which provides crude estimates of the time since the most recent ancestor (TMRCA) for the selected allele. This approach was applied to the top 50 signals in the environmental correlation analysis as well as 5 sets of 50 alleles drawn at random and matched by allele frequency to be used as controls. There is no significant difference between the signals of environmental correlation and the random alleles (data not shown). Furthermore, the average TMRCAs tend to be quite old (i.e. older than 10 000 years ago), relative to the likely time of onset of the corresponding selective pressure; these old time estimates are particularly striking if one considers that simulation studies have shown that this estimator has a substantial downward bias (J. Kelley & M. Przeworski 2009, personal communication). These results are consistent with the idea that most of the signals of environmental correlations represent cases of selection on standing alleles.
5. Genetic architecture of genetic adaptations and common traits
The results of GWASs suggest that most human complex traits are shaped by a large number of variants, each with a small effect. Using data from the NHGRI GWAS catalogue (www.genome.gov/gwastudies), we find that large numbers of SNPs are implicated in cancer, immune response and metabolic phenotypes and that most SNPs (ranging from 71 to 81%) have odds ratios (ORs) for their effects on the trait of less than 1.5. However, phenotypes related to pigmentation are an exception to this general trend in that many of the pigmentation variants tend to have large effects: 82 per cent of SNPs have ORs greater than 1.5 and several of them have ORs greater than 10.
If an adaptive phenotype is due to a small number of variants with large phenotypic effects, these variants are expected to have risen to high frequencies and to show signatures of selection detectable by FST and iHS-based approaches. Conversely, if the genetic architecture of an adaptive phenotype involves many variants with small effects, these variants may have experienced only small changes in frequencies and will probably only be detected through the environmental correlation approach.
Because the phenotypic clines suggest that variation in pigmentation and metabolism is adaptive, these traits offer an opportunity to compare these scenarios empirically. For each SNP associated with pigmentation and energy metabolism, we compared the evidence for selection provided by the three different approaches. As shown in figure 3, the pigmentation SNPs tend to show signals with FST and iHS-based approaches, as well as with environmental correlations; signals are particularly strong when European populations are included in the analysis, probably reflecting the facts that most GWASs were performed in Europeans and that Europeans tend to have the lightest pigmentation among high latitude populations. As expected, among the environmental variables, climate (which includes UV radiation) has the strongest signal with pigmentation SNPs. Overall, the FST and the environmental correlation analyses in the AWE subset yield comparable results. Interestingly, when the same comparison is performed for SNPs associated with metabolism phenotypes, the environmental correlation method identifies many more signals relative to approaches that are agnostic to the selective pressure (figure 3). A relatively large number of significant correlations with subsistence variables are observed among SNPs associated with metabolism phenotypes. These findings suggest that iHS and FST-based approaches are not well suited to detect adaptive SNPs with small ORs, such as those observed for most common diseases.
Figure 3.
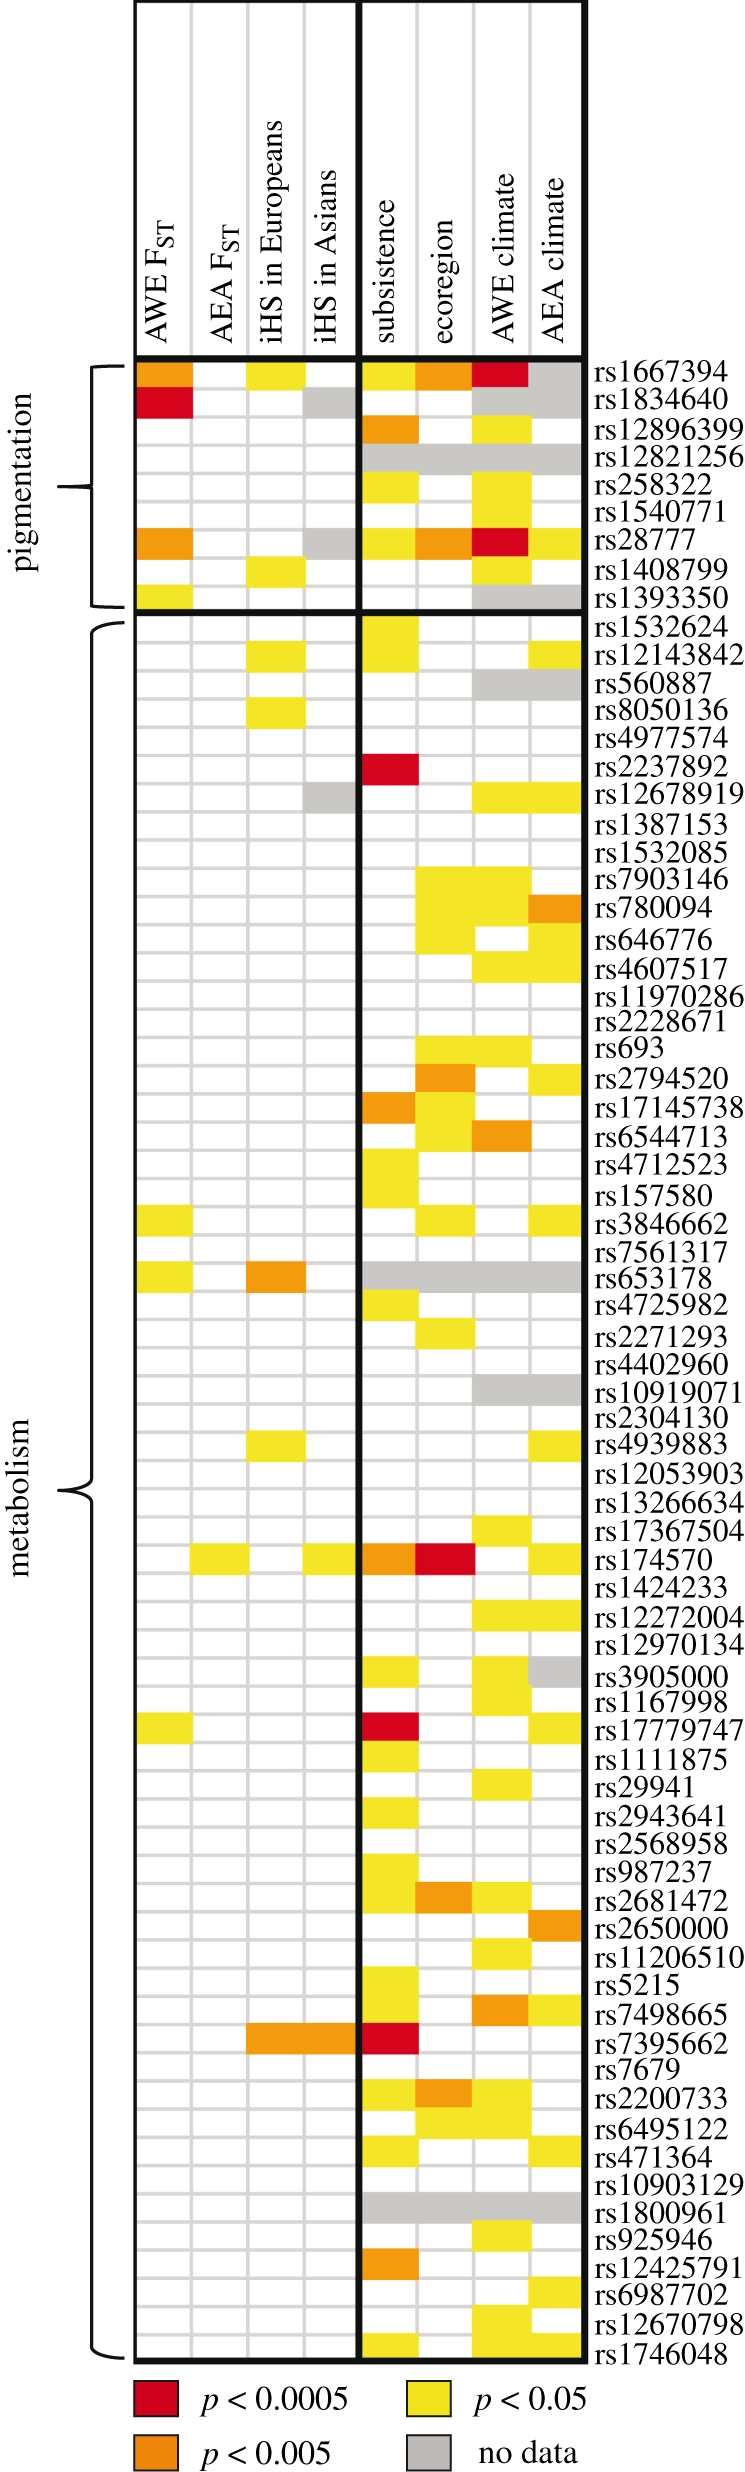
Signals of selection for SNPs associated with pigmentation and metabolism phenotypes (p < 1 × 10⁻⁸). SNPs were pruned so that only the SNP with the lowest GWAS p-value was included for any 1 Mb region. The colours of cells in the table denote the strength of evidence of selection for each SNP, based on the rank of the SNP in the genome-wide distribution of the selection test statistic, i.e. the ‘empirical p-value’. The empirical p-values on the right-hand side of the table are for environmental correlations. Each environmental variable empirical p-value is the rank of the minimum p-value calculated across a set of environmental variables related to subsistence, ecoregion or climate.
6. Conclusions
The results of selection scans using information about underlying selective pressures complement results using methods that are agnostic to the selective pressure and that tend to identify loci that were subject to hard sweeps. Therefore, the environmental correlation approach is valuable for learning about human genetic adaptations to local environments, and it can provide important information for elucidating the genetic architecture of human adaptations. With the rapid and continued growth of GWASs for common diseases and non-clinical traits, it will be possible to perform more in-depth analyses of the overlap between selection signals and SNPs associated with human phenotypes. The analyses reported here provide a glimpse into the diversity of patterns that may be observed. Association studies of quantitative traits, including expression levels in collections of cell lines or human primary tissues, may also play an important role in dissecting the genetic bases of adaptive phenotypes.
While we used information from candidate gene and GWASs in our analysis, the genetic basis of phenotypic variation in humans is still not well understood for most traits. More focused approaches to clarify the genetic basis of complex trait variation are underway using large-scale phenotyping and genotyping at tagging SNPs and using ‘next generation’ high-throughput sequencing techniques (Manolio et al. 2009). As the genetic underpinnings of common traits become clearer, this information can be used to learn about how selective forces have influenced disease traits and other phenotypes.
Acknowledgements
This research was supported in part by NIH grants DK56670 and GM79558. A.M.H. was partially supported by an AHA Graduate Fellowship (0710189Z).
Footnotes
One contribution of 18 to a Discussion Meeting Issue ‘Genetics and the causes of evolution: 150 years of progress since Darwin’.
References
- Akey J. M., Eberle M. A., Rieder M. J., Carlson C. S., Shriver M. D., Nickerson D. A., Kruglyak L.2004Population history and natural selection shape patterns of genetic variation in 132 genes. PLoS Biol. 2, e286 (doi:10.1371/journal.pbio.0020286) [DOI] [PMC free article] [PubMed] [Google Scholar]
- Allen J. A.1877The influence of physical conditions in the genesis of species. Rad. Rev. 1, 108–140 [Google Scholar]
- Barreiro L. B., Laval G., Quach H., Patin E., Quintana-Murci L.2008Natural selection has driven population differentiation in modern humans. Nat. Genet. 40, 340–345 (doi:10.1038/ng.78) [DOI] [PubMed] [Google Scholar]
- Beall C.1997Andean, Tibetan, and Ethiopian patterns of adaptation to high-altitude hypoxia. Integr. Comp. Biol. 46, 18–24 (doi:10.1093/icb/icj004) [DOI] [PubMed] [Google Scholar]
- Bergmann C.1847Über die Verhältnisse der wärmeökonomie der Thiere zu ihrer Grösse. Göttinger Studien 3, 595–708 [Google Scholar]
- Bersaglieri T., Sabeti P. C., Patterson N., Vanderploeg T., Schaffner S. F., Drake J. A., Rhodes M., Reich D. E., Hirschhorn J. N.2004Genetic signatures of strong recent positive selection at the lactase gene. Am. J. Hum. Genet. 74, 1111–1120 (doi:10.1086/421051) [DOI] [PMC free article] [PubMed] [Google Scholar]
- Carlson C. S., Thomas D. J., Eberle M. A., Swanson J. E., Livingston R. J., Rieder M. J., Nickerson D. A.2005Genomic regions exhibiting positive selection identified from dense genotype data. Genome Res. 15, 1553–1565 (doi:10.1101/gr.4326505) [DOI] [PMC free article] [PubMed] [Google Scholar]
- Consortium I. H.2005A haplotype map of the human genome. Nature 437, 1299–1320 (doi:10.1038/nature04226) [DOI] [PMC free article] [PubMed] [Google Scholar]
- Coop G., et al. 2009The role of geography in human adaptation. PLoS Genet. 5, e1000500 (doi:10.1371/journal.pgen.1000500) [DOI] [PMC free article] [PubMed] [Google Scholar]
- Coop G., Witonsky D. B., Di Rienzo A., Pritchard J. K.In press Using environmental correlations to identify loci underlying local adaptation. Genetics. (doi:10.1534/genetics.110.114819) [DOI] [PMC free article] [PubMed] [Google Scholar]
- Darwin C.1859On the origin of species by means of natural selection. London, UK: John Murray [Google Scholar]
- Enattah N. S., et al. 2008Independent introduction of two lactase-persistence alleles into human populations reflects different history of adaptation to milk culture. Am. J. Hum. Genet. 82, 57–72 (doi:10.1016/j.ajhg.2007.09.012) [DOI] [PMC free article] [PubMed] [Google Scholar]
- Falconer D. S., MacKay T. F. C.1996Introduction to quantitative genetics. Essex, UK: Longman; [DOI] [PMC free article] [PubMed] [Google Scholar]
- Frazer K. A., et al. 2007A second generation human haplotype map of over 3.1 million SNPs. Nature 449, 851–861 (doi:10.1038/nature06258) [DOI] [PMC free article] [PubMed] [Google Scholar]
- Gillespie J.1991The causes of molecular evolution. New York, NY: Oxford University Press [Google Scholar]
- Gleiberman L.1973Blood pressure and dietary salt in human populations. Ecol. Food Nutr. 2, 143–156 [Google Scholar]
- Hancock A. M., Di Rienzo A.2008Detecting the genetic signature of natural selection in human populations: models, methods, and data. Annu. Rev. Anthropol. 37, 197–217 (doi:10.1146/annurev.anthro.37.081407.085141) [DOI] [PMC free article] [PubMed] [Google Scholar]
- Hancock A. M., Witonsky D. B., Gordon A. S., Eshel G., Pritchard J. K., Coop G., Di Rienzo A.2008Adaptations to climate in candidate genes for common metabolic disorders. PLoS Genet. 4, e32 (doi:10.1371/journal.pgen.0040032) [DOI] [PMC free article] [PubMed] [Google Scholar]
- Hancock A. M., et al. 2010Human adaptations to diet, subsistence, and ecoregion are due to subtle shifts in allele frequency. Proc. Natl Acad. Sci. USA 107, 8924–8930 (doi:10.1073/pnas.0914625107) [DOI] [PMC free article] [PubMed] [Google Scholar]
- Hermisson J., Pennings P. S.2005Soft sweeps: molecular population genetics of adaptation from standing genetic variation. Genetics 169, 2335–2352 (doi:10.1534/genetics.104.036947) [DOI] [PMC free article] [PubMed] [Google Scholar]
- Hill W. G.2010Understanding and using quantitative genetic variation. Phil. Trans. R. Soc. B 365, 73–85 (doi:10.1098/rstb.2009.0203) [DOI] [PMC free article] [PubMed] [Google Scholar]
- Hindorff L. A., Junkins H. A., Mehta J. P., Manolio T. A.2009. A catalog of published genome-wide association studies. See www.genome.gov/gwastudies
- Hinds D. A., Stuve L. L., Nilsen G. B., Halperin E., Eskin E., Ballinger D. G., Frazer K. A., Cox D. R.2005Whole-genome patterns of common DNA variation in three human populations. Science 307, 1072–1079 (doi:10.1126/science.1105436) [DOI] [PubMed] [Google Scholar]
- Jablonski N. G., Chaplin G.2000The evolution of human skin coloration. J. Hum. Evol. 39, 57–106 (doi:10.1006/jhev.2000.0403) [DOI] [PubMed] [Google Scholar]
- Jakobsson M., et al. 2008Genotype, haplotype and copy-number variation in worldwide human populations. Nature 451, 998–1003 (doi:10.1038/nature06742) [DOI] [PubMed] [Google Scholar]
- Katzmarzyk P. T., Leonard W. R.1998Climatic influences on human body size and proportions: ecological adaptations and secular trends. Am. J. Phys. Anthropol. 106, 483–503 (doi:10.1002/(SICI)1096-8644(199808)106:4<483::AID-AJPA4>3.0.CO;2-K) [DOI] [PubMed] [Google Scholar]
- Kudaravalli S., Veyrieras J. B., Stranger B. E., Dermitzakis E. T., Pritchard J. K.2009Gene expression levels are a target of recent natural selection in the human genome. Mol. Biol. Evol. 26, 649–658 (doi:10.1093/molbev/msn289) [DOI] [PMC free article] [PubMed] [Google Scholar]
- Leonard W. R., Sorensen M. V., Galloway V. A., Spencer G. J., Mosher M. J., Osipova L., Spitsyn V. A.2002Climatic influences on basal metabolic rates among circumpolar populations. Am. J. Hum. Biol. 14, 609–620 (doi:10.1002/ajhb.10072) [DOI] [PubMed] [Google Scholar]
- Li J. Z., et al. 2008Worldwide human relationships inferred from genome-wide patterns of variation. Science 319, 1100–1104 (doi:10.1126/science.1153717) [DOI] [PubMed] [Google Scholar]
- Manolio T. A., et al. 2009Finding the missing heritability of complex diseases. Nature 461, 747–753 (doi:10.1038/nature08494) [DOI] [PMC free article] [PubMed] [Google Scholar]
- Myles S., Tang K., Somel M., Green R. E., Kelso J., Stoneking M.2008Identification and analysis of genomic regions with large between-population differentiation in humans. Ann. Hum. Genet. 72, 99–110 (doi:10.1111/j.1469-1809.2007.00390.x) [DOI] [PubMed] [Google Scholar]
- Norton H. L., et al. 2007Genetic evidence for the convergent evolution of light skin in Europeans and East Asians. Mol. Biol. Evol. 24, 710–722 (doi:10.1093/molbev/msl203) [DOI] [PubMed] [Google Scholar]
- Pennings P. S., Hermisson J.2006aSoft sweeps II—molecular population genetics of adaptation from recurrent mutation or migration. Mol. Biol. Evol. 23, 1076–1084 (doi:10.1093/molbev/msj117) [DOI] [PubMed] [Google Scholar]
- Pennings P. S., Hermisson J.2006bSoft sweeps III: the signature of positive selection from recurrent mutation. PLoS Genet. 2, e186 (doi:10.1371/journal.pgen.0020186) [DOI] [PMC free article] [PubMed] [Google Scholar]
- Perry G. H., et al. 2007Diet and the evolution of human amylase gene copy number variation. Nat. Genet. 39, 1256–1260 (doi:10.1038/ng2123) [DOI] [PMC free article] [PubMed] [Google Scholar]
- Pickrell J. K., et al. 2009Signals of recent positive selection in a worldwide sample of human populations. Genome Res. 19, 826–837 (doi:10.1101/gr.087577.108) [DOI] [PMC free article] [PubMed] [Google Scholar]
- Pritchard J. K., Pickrell J. K., Coop G.2010The genetics of human adaptation: hard sweeps, soft sweeps, and polygenic adaptation. Curr. Biol. 20, R208–R215 (doi:10.1016/j.cub.2009.11.055) [DOI] [PMC free article] [PubMed] [Google Scholar]
- Przeworski M., Coop G., Wall J. D.2005The signature of positive selection on standing genetic variation. Evolution 59, 2312–2323 (doi:10.1554/05-273.1) [PubMed] [Google Scholar]
- Relethford J. H.2002Apportionment of global human genetic diversity based on craniometrics and skin color. Am. J. Phys. Anthropol. 118, 393–398 (doi:10.1002/ajpa.10079) [DOI] [PubMed] [Google Scholar]
- Roberts D. F.1953Body weight, race and climate. Am. J. Phys. Anthropol. 11, 533–558 (doi:10.1002/ajpa.1330110404) [DOI] [PubMed] [Google Scholar]
- Sabeti P. C., et al. 2007Genome-wide detection and characterization of positive selection in human populations. Nature 449, 913–918 (doi:10.1038/nature06250) [DOI] [PMC free article] [PubMed] [Google Scholar]
- Smith J. M., Haigh J.1974The hitch-hiking effect of a favourable gene. Genet. Res. 23, 23–35 (doi:10.1017/S0016672300014634) [PubMed] [Google Scholar]
- Tang K., Thornton K. R., Stoneking M.2007A new approach for using genome scans to detect recent positive selection in the human genome. PLoS Biol. 5, e171 (doi:10.1371/journal.pbio.0050171) [DOI] [PMC free article] [PubMed] [Google Scholar]
- Thompson E. E., Kuttab-Boulos H., Witonsky D., Yang L., Roe B. A., Di Rienzo A.2004CYP3A variation and the evolution of salt-sensitivity variants. Am. J. Hum. Genet. 75, 1059–1069 (doi:10.1086/426406) [DOI] [PMC free article] [PubMed] [Google Scholar]
- Tishkoff S. A., et al. 2007Convergent adaptation of human lactase persistence in Africa and Europe. Nat. Genet. 39, 31–40 (doi:10.1038/ng1946) [DOI] [PMC free article] [PubMed] [Google Scholar]
- Voight B. F., Adams A. M., Frisse L. A., Qian Y., Hudson R. R., Di Rienzo A.2005Interrogating multiple aspects of variation in a full resequencing data set to infer human population size changes. Proc. Natl Acad. Sci. USA 102, 18 508–18 513 (doi:10.1073/pnas.0507325102) [DOI] [PMC free article] [PubMed] [Google Scholar]
- Voight B. F., Kudaravalli S., Wen X., Pritchard J. K.2006A map of recent positive selection in the human genome. PLoS Biol. 4, e72 (doi:10.1371/journal.pbio.0040072) [DOI] [PMC free article] [PubMed] [Google Scholar]
- Wang E. T., Kodama G., Baldi P., Moyzis R. K.2006Global landscape of recent inferred Darwinian selection for Homo sapiens. Proc. Natl Acad. Sci. USA 103, 135–140 (doi:10.1073/pnas.0509691102) [DOI] [PMC free article] [PubMed] [Google Scholar]
- Weir B. S., Cockerham C. C.1984Estimating F-statistics for the analysis of population structure. Evolution 38, 1358–1370 (doi:10.2307/2408641) [DOI] [PubMed] [Google Scholar]
- Williamson S. H., Hubisz M. J., Clark A. G., Payseur B. A., Bustamante C. D., Nielsen R.2007Localizing recent adaptive evolution in the human genome. PLoS Genet. 3, e90 (doi:10.1371/journal.pgen.0030090) [DOI] [PMC free article] [PubMed] [Google Scholar]
- Young J. H., Chang Y. P., Kim J. D., Chretien J. P., Klag M. J., Levine M. A., Ruff C. B., Wang N. Y., Chakravarti A.2005Differential susceptibility to hypertension is due to selection during the out-of-Africa expansion. PLoS Genet. 1, e82 (doi:10.1371/journal.pgen.0010082) [DOI] [PMC free article] [PubMed] [Google Scholar]