

Abstract
Heavy metal exposure in children has been associated with a variety of physiological and neurological problems. The goal of this study was to utilize proteomics to enhance the understanding of biochemical interactions responsible for the health problems related to lead and mercury exposure at concentrations well below CDC guidelines. Blood plasma and serum samples from 34 children were depleted of their most abundant proteins using antibody-based affinity columns and analyzed using two different methods, LC-MS/MS and 2-D electrophoresis coupled with MALDI-TOF/MS and tandem mass spectrometry. Apolipoprotein E demonstrated an inverse significant association with lead concentrations (average being one microgram/deciliter) as deduced from LC-MS/MS and 2-D electrophoresis and confirmed by Western blot analysis. This coincides with prior findings that Apolipoprotein E genotype moderates neurobehavioral effects in individuals exposed to lead. Fifteen other proteins were identified by LC-MS/MS as proteins of interest exhibiting expressional differences in the presence of environmental lead and mercury.
Keywords: Proteomics, children, blood, cardiovascular, lead, mercury, apolipoprotein E, Pb, Hg, ApoE
Introduction
Lead (Pb) and mercury (Hg) are well known toxicants, and their impact is assessed and monitored by different bodies of the World Health Organization1-3. Pb negatively affects the human central nervous system4, kidney5, liver6, and cardiovascular system7. Children are known to be particularly sensitive to Pb exposure 8-10. The negative effects of Pb have been documented at concentrations significantly below 10 μg/dL, which is considered by the Centers for Disease Control and Prevention (CDC) as a level of concern for children 1, 7, 9-11. While Pb blood levels in U.S. adults have continuously decreased in recent decades (from 13.1 μg/dL in 1976-1980 to 1.6 μg/dL in 1999-2002)12, it is still two orders of magnitude higher than its estimated concentration of 16 ng/dL in pre-industrial humans13. Hg is considered toxic to the kidneys, central nervous system, cardiovascular, gastrointestinal, and immune systems3, 14, 15. Prenatal exposure to Hg severely affects the neurobehavioral functioning of offspring14. Nationally, average blood Hg levels were reported in childbearing-aged women (0.92 μg/L) and for children aged 1-5 years (0.33 μg/L), below the threshold of concern (5.8 μg/L)16.
Proteomics is a versatile field of molecular biology dedicated to the study of the full complement of proteins expressed in an organism, tissue, body fluid, or cell17, 18. There have been several proteomic studies that addressed the effects of Pb and Hg exposure. Heavy exposure of the bacteria K. pneumonia to Pb caused the decreased expression of DNA gyrase A, as determined by 2D-PAGE followed by PMF using MALDI-TOF/MS19 (for the standard proteomic techniques' abbreviations, please refer to18). When rat glioma cells were subjected to prolonged exposure to Pb and analyzed by 2D-PAGE followed by N-terminal sequencing using Edman's method, glucose related protein GRP78 was found to accumulate20. Using 2D-PAGE followed by MALDI and ESI-MS/MS sequencing, exposure of rats to Pb acetate resulted in the identification of eleven proteins with altered expression in kidney cells, notably, calcium binding proteins, heat shock proteins, and glutathione S-transferases21. Rats lens exhibited changes on αA-crystallin protein profile upon exposure to Pb, as seen by 2D-PAGE followed by PMF using MALDI-TOF/MS22. When rabbits were exposed to low concentrations of Pb, no myocardial proteins were identified as significantly associated with Pb concentrations using 2D-PAGE23. The serum proteome profile was assessed in humans that were occupationally exposed to arsenic and Pb, and five peptides/proteins were found (not identified) to be significantly up- or down-regulated in exposed vs. unexposed controls using SELDI-TOF on the weak cationic exchange protein chip24.
With respect to Hg, effects on C. glutamicum were assessed using 2D-PAGE and MALDI/MS PMF, and six identified proteins responded to Hg, including redox and transport proteins25. Methylmercury (MeHg) exposure of cultured neurons from mice caused the decreased expression of 3-ketoacyl-CoA transferase I, as determined by 2D-PAGE and MALDI/MS PMF26. The recent extension of the above pilot work, analyzed the exposure of the mice neuronal cells to MeHg using better tools, namely 2D-PAGE, PMF MALDI-TOF and MALDI-TOF/TOF sequencing. The study identified cofilin's phosphorylation/dephosphorylation as a potential mechanism compatible with the signs of MeHg -induced nerotoxicity27.
To our best knowledge, no proteomic studies have been published on humans with low-level environmental Pb or Hg exposure. Additionally, there have not been any studies that have identified proteins related to children's exposure to these heavy metals. Previous studies by our group have established that prenatal (cord) blood Pb levels are associated with significantly higher baseline systolic blood pressure (SBP) in nine and a half year-olds10. In addition, early childhood Pb levels were associated with a significantly greater total peripheral resistance (TPR) response to acute stress10. It was shown that family socioeconomic status (SES) is significantly associated with higher blood Pb levels and SBP, diastolic blood pressure (DPB), and a TPR response to acute stress, while Pb was found to be mediating the SES-TPR reactivity association9. This proteomic study is meant to enhance the understanding of the above findings by exploring the associations between blood protein levels and sub-clinical heavy metal concentrations in a general population of children.
Experimental Section
Participants
Recruitment elicited participation from children that: 1) were 9–11 years old, 2) reported no current use of medication that might affect cardiovascular functioning (e.g. Ritalin), and 3) had no significant developmental disorders that might affect task performance. Participants signed the assent form while his/her parents signed a consent form; the study was approved by the Institutional Review Board of SUNY-Oswego. Blood draws for this study took place at Oswego Hospital's draw center located in a family physician's office. The first visit took place in February-March of 2005 in order to measure blood concentrations of Pb, Hg, glucose, triglycerides, cholesterol, HDL, and LDL. It was followed within 2 weeks by a 2-hour laboratory visit during which cardiovascular responses to acute stress were measured9 and additional data (patient's gender, education and occupation of parents) were recorded. A second blood draw took place in October- December of 2006 to measure the Pb and Hg concentrations again, to collect sufficient plasma and serum for the proteomic and follow-up studies, and to assess children's body mass index (BMI) and waist to hip ratio.
Trace metal concentration determination
Whole blood specimens (2 mL) were collected into Vacutainer tubes that had been pre-certified by the analyzing laboratory for low-level measurements of Pb and Hg. Blood specimens were stored at −80°C pending shipment to the Trace Elements section of the Laboratory of Inorganic and Nuclear Chemistry at the New York State Department of Health's Wadsworth Center, Albany, NY. This laboratory is New York State's principal reference laboratory for the measurement of trace metals in blood, as well as other fluids and tissues, and is responsible for operating that state's proficiency testing program for blood metals. The analyses for Pb and Hg in whole blood were carried out using a PE Sciex DRC Plus inductively coupled plasma-mass spectrometer (PerkinElmer Life and Analytical Sciences, Shelton, CT)28, 29. In brief, 200 μL of whole blood was diluted 1:50 with a diluent containing nitric acid, Triton X-100, two internal standards (iridium and rhodium), and gold to control Hg memory effects29. Method detection limits (MDL) calculated from recent data obtained over 20 independent runs were 0.34 μg/dL (2% RSD) for Pb and 0.24 μg/L (5% RSD) for Hg. Given the lower levels of blood Pb that were expected, the superior detection limits of ICP-MS were appropriate for this study and have been used in several biomonitoring studies28. The instrumental signal from each diluted specimen was measured in triplicate. Four levels of internal quality control materials were analyzed before, during, and after each run. The method has been validated against NIST SRM 966 toxic metals in bovine blood, as well as a new standard reference material (SRM 955c Pb in caprine blood) that has been certified for Pb and will be shortly certified for Hg as well.
2D-PAGE
A protease inhibitor cocktail (PIC) containing AEBSF, aprotinin, bestatin, E-64, leupeptin, and pepstain A (Sigma Aldrich, St. Louis, MO) was added to 5 mL of patient's blood collected in Vacutainers (BD Vacutainer K2, REF 367856), which contained EDTA (5.4 mg). Samples were centrifuged at 1000×g for 15 min at 4°C and the resulting plasma was respun at 2400×g for 10 min at 4°C to remove any cellular debris. Plasma was stored in Protein LoBind microcentrifuge tubes (Brinkmann Instruments Inc., Riverview, FL) at −80°C until further analysis. A 20 μL aliquot of initial plasma was depleted of albumin, IgG, α1-antitrypsin, IgA, IgM, transferrin, haptoglobin, α1-acid glycoprotein, α2-macroglobulin, apolipoprotein A-I, apolipoprotein A-II, and fibrinogen using an immunoaffinity avian-based IgY spincolumn (Bekman Coulter, Brea, CA). Depleted samples were further clarified using a ReadyPrep 2-D cleanup kit (Bio-Rad, Hercules, CA) to remove any remaining ionic detergents, salts, nucleic acids, and lipids. The pellet was air dried for five minutes and re–hydrated in 240 μL of 0.5% pH 4–7 carrier ampholyte DeStreak rehydration solution (GE Healthcare, Piscataway, NJ). The protein concentration was determined using the Better Bradford Assay kit (Pierce, Rockford, IL) and a KC Junior PowerWave XS microplate reader (Bio-Tek, Winooski, VT) with a modified protocol to account for any increases in absorbance due to the presence of DeStreak in the sample. A 40 μg aliquot of proteins were loaded in three replicates on 11 cm, pH 4–7, IPG strips (Bio-Rad). Twelve strips at a time were focused on a PROTEAN IEF instrument (Bio-Rad) until 35 kVHrs were reached. Focusing wicks were changed seven times over the first eight hours of focusing to remove excess salts and any remaining interfering compounds. After focusing, the strips were treated with dithiothreitol (Bio-Rad) and iodoacetamide (Bio-Rad). Twelve gels were placed in a dodecyl SDS-PAGE electrophoresis cell (Bio-Rad) and run at a constant 200 V for 1 hour in a Tris-glycine-SDS (TGS) buffer at 18°C. The gels were removed from their casing and fixed in a solution containing 10% methanol and 7% acetic acid for thirty minutes. After protein fixing, the gels were placed in approximately 80 mL of SYPRO Ruby Red dye (Bio-Rad) and stained overnight. After de-staining the gels were scanned using a Typhoon 9400 fluorescent scanner (GE Healthcare) at a resolution of 100 μm. Voltage was varied to allow for maximum intensity without saturation of signal. Scanned images were imported into ImageMaster 2D Platinum 5.0 (Amersham Biosciences, Piscataway, NJ) software for analysis. Gels were stored at 4°C for future processing. Gel images were cropped to the same dimensions to allow for accurate percent volume reporting of each protein spot. Protein spots were detected using the following scanning parameters: smoothness- 2, saliency- 15, and minimum spot area- 25. The gel with the highest number of paired matches across the top tier and low tier was selected as the master reference gel. A percent volume protein group report was generated using the master reference gel and exported for statistical analysis (see below). Groups that showed a significant (p ≤ 0.05), or marginally significant (0.05 < p < 0.10) linear trend across metal tertiles (see below) were manually processed using the image analysis software and resubmitted for statistical analysis30, 31. Groups that remained statistically relevant were then processed for identification. For excision, a depleted, cleaned preparative sample was manufactured in the same manner with some minor protocol adjustments. To achieve a protein load of 500 μg for 2-D gel electrophoresis, multiple post 2-D cleanup samples were pooled and concentrated using 10,000 MW cutoff filters (Brinkmann Instruments Inc). Two 2-D PAGE gels were stained with Coomassie Brilliant Blue G-250 (Bio-Rad) dye. Selected groups were excised manually with brass tubing provided in house with an inner diameter of 1.5 mm and analyzed by both, MALDI-TOF/MS PMF and LC-MS/MS.
Statistical analysis
Using SAS software version 9.1.3 service pack 4, protein spots across all gels (groups) were compared and ranked to generate an intra-class correlation (ICC) value to measure variability across a triplicate set of gels32. Groups with an ICC value of 0.6 or higher were kept for statistical evaluation31, 33. This procedure resulted in a set of groups that could be measured with sufficient reliability to warrant further analysis. Regression models can be sensitive to outliers due to the uneven distribution of blood metal levels. In addition, some participants had Pb or Hg levels below the method detection limit (MDL), making our data non-continuous. Both facts prompted the use of tertiles in our data analysis. Participants were divided into groups (low, medium, and high) consisting of approximately equal number of participants based on metal (Pb and Hg) serum concentration 9, 10. General linear modeling (PROC GLM) was performed for each protein group, testing the linear trend across tertiles. The confounders were limited to gender and SES to enhance data interpretation of blood metal concentration effects on protein expression while avoiding over-fitting of data34-37. Additional analyses considered blood Pb level (log-transformed) as a continuous variable. Also, the patients with five highest and lowest Pb concentrations were compared. The use of tertiles and the log transformation of data has been used previously in estimating effects of Pb on the mortality among US adults using the Third National Health and Nutrition Examination Survey7.
The threshold for significant (p ≤ 0.05), or marginally significant (0.05 < p < 0.10) associations adopted was not extremely conservative because the restricted sample size (a necessity, given the extensive testing using different analytic approaches) reduces the power to detect associations38. To avoid inflating Type II error (not detecting associations), the p value was not reduced. A too conservative p value might have been the cause for the lack of findings in the Pb study in rabbits23 noted in the introduction. We recognize that some associations may occur by chance (Type I error). To address this potential error, we have focused only on proteins that show confirmation using at least two analytical approaches and have a theoretical justification (see Results and Discussion).
MALDI-TOF/MS PMF and LC-MS/MS of proteins in gel pieces
Each gel piece was destained, treated with dithiothrietol, then iodoacetamide, shrunk by adding acetonitrile, and then air dried. To digest proteins, trypsin was added to each gel piece and incubated overnight in a 30°C water bath. The digestion mixture was transferred to a clean 1.5 mL LoBind tube, centrifuged under vacuum until dry in a vacufuge, re-suspended in 10 μL of a 0.1% trifluoroacetic acid solution, and concentrated using a Zip-tip (Millipore). The concentrated samples were then prepared in a 1:1 ratio with α-cyano-4-hydroxycinnamic acid matrix and analyzed using Autoflex time-of-flight mass spectrometer (Bruker Daltonik GmbH, Billerica, MA). Peptide mass to charge (m/z) spectra were collected using Flexcontrol software version 2.2 (Bruker Daltonik GmbH). Approximately 800 to 1500 laser shots were collected for each sample by varying the laser intensity and location on each target spot. Spectra were imported into Flexanalysis software version 2.2 (Bruker Daltonik GmbH). Spectra were smoothed and the baseline was subtracted prior to mass list identification. Initial mass lists were generated using the automated function of the software followed by a manual processing to add peaks not identified by the software. Contamination peaks due to auto cleavage of trypsin and keratin were removed using a list of known contaminants and the spectra were imported into the Biotools software version 2.2 for analysis. Peptide m/z lists were submitted to the MASCOT probabilistic scoring algorithm (www.matrixscience.com) for identification. Monoisotopic peaks were compared against online databases using the following parameters: database- SwissProt, taxonomy- Homo sapiens, enzyme- trypsin, allowable missed cleavages- 0, fixed modifications-carbamidomethyl (C), variable modifications- oxidation (M), peptide tolerance- 50–150 ppm, mass value- MH+. Peptide tolerance was increased from 50 ppm until a significant score was returned from the database search. Upon attainment of a significant score, identified peaks were documented for internal calibration use39. A new m/z list, which included known contaminants, was generated using Flexanalysis and exported to Microsoft Excel. Internal calibration was performed by generating a scatter plot of m/z ratios for contaminants and known peaks from the initial MASCOT search against experimental values. Calibrated m/z values were generated through a least squares method using a second order polynomial fitted to the data. The known contaminants were deleted from the calibrated m/z list and the list was exported into the MASCOT search engine and re-evaluated for significance using the same search parameters. The mass list was submitted recursively while lowering the tolerance setting from the initial search until identified peak deviation remained unchanged at 2σ. This procedure was performed to eliminate false positive peaks and improve the overall quality score39-41.
LC-MS/MS was performed at the METACyt Biocehmical Analysis Center (MBAC) located in the department of Chemistry at Indiana University, Bloomington, IN. Gel pieces were excised as described earlier. Samples were placed in a specimen box, packed in dry ice, and shipped overnight to Bloomington, IN. Briefly, gel pieces were destained, dried in an Eppendorf Vacufuge concentrator (Brinkmann Instruments), and digested with trypsin for 18 hrs at 37°C. Trypsin digests were dried in the Vacufuge concentrator and reconstituted in 10 μL of water. Six microliters of trypsin digested samples were separated and identified using LC-MS/MS as described below. A protein was reported to be found in a spot only when three or more sequenced peptides obtained a score at or above the “identity or extensive homology” score (95% confidence).
LC-MS/MS of serum samples
Blood was collected using Vacutainers (BD Vacutainer K2, REF 367856) and was centrifuged at 1000×g for 15 minutes and the resulting serum was respun at 2400×g for 10 min at 4°C to remove any cellular debris. Serum was stored in Protein LoBind microcentrifuge tubes (Brinkmann Instruments) at −80°C until further analysis. One mL of serum samples (N=31) were placed in a specimen box, packed in dry ice, and shipped overnight to Bloomington, IN. At MBAC, seven highly abundant proteins (albumin, IgG, IgA, transferrin, haptoglobin, anti-trypsin and fibrinogen) were depleted using Agilent Multi Affinity Removal System (MARS) column (4.6 mm × 100 mm, Agilent technologies, Santa Clara, CA) on an Akta purifier (Amersham Biosciences) using the manufacturer's protocol. The depleted sample was collected and buffer exchanged with 50 mM ammonium bicarbonate and pre-concentrated to ca. 0.5 μg/μL using a 5 kDa MWCO spin concentrator. After thermal denaturation at 95°C for 5 min, samples were reduced through the addition of DTT to a final concentration of 5 mM and incubated at 60°C for 45 min. Alkylation was achieved by adding iodoacetamide to a final concentration of 20 mM prior to incubation at room temperature for 45 min in the dark. A second aliquot of DTT was then added, increasing the final concentration of DTT to ca. 10 mM. The samples were then incubated at room temperature for 30 min to quench the alkylation reaction. Next, trypsin was added (1:30 w/w) and mixtures were incubated at 37°C for 18 hrs. The enzymatic digestions were finally quenched through the addition of neat formic acid. The following separation and identification procedure was used in triplicate for both serum samples and plasma samples from 2D-PAGE. LC-MS/MS analyses of the tryptic digests were performed using a Dionex 3000 Ultimate nano-LC system (Dionex, Sunnyvale, CA) interfaced to LTQ Orbitrap hybrid mass spectrometer (Thermo Scientific, San Jose, CA). Prior to separation, a 2 μl aliquot of trypsin digests (1 μg protein equivalent) was loaded on PepMap300 C18 cartridge (5 μm, 300 Å, Dionex) and eluted through a pulled-tip capillary column (150 mm × 75 μm i.d) packed with 90 Å Jupiter C12 bound phase (Phenomenex, Torrance, CA). Peptides originating from protein tryptic digests were separated using a reversed-phase gradient from 3-55% of 97% acetonitrile with 0.1% formic acid over 55 minutes for proteins isolated from the human blood, at 300 nl/min flow rate. The mass spectrometer was operated in an automated data-dependent mode that was switching between MS scan and CID-MS. In this mode, eluted LC products undergo an initial full-spectrum MS scan from m/z 300 to 2000 in the Orbitrap at 15,000 mass resolutions. Subsequently, CID-MS (at 35% normalized collision energy) was performed in the ion trap. The precursor ion was isolated using the data-dependent acquisition mode with a 2 m/z isolation width to select automatically and sequentially five most intense ions (starting with the most intense) in the survey scan. The total cycle (6 scans) is continuously repeated for the entire LC-MS run under data-dependent conditions with dynamic exclusion set to 60 sec. Performing MS scanning in the Orbitrap offers high mass accuracy and accurate charge state assignment of the selected precursor ions. Mascot version 2.1.3 was used. Data were searched against Homo sapiens Swiss-Prot database. Trypsin was selected as the enzyme and one missed cleavage was allowed. A carbomidomethyl was selected as a fixed modification of all cysteine residues and acetyl (N-term), oxidation (M), pyro-glu (N-term E) and pyro-glu (N-term Q) were selected as variable modifications. The mass tolerance of both MS and MS/MS data was set to 0.8 Da. Peptides with mass accuracy better than 2 ppm and Mascot ion score of 30 and above (above the “identity or extensive homology” score; 95% confidence) were considered as positive identification. The quantitative analysis of proteins was carried out using ProteinQuant Suit developed at Indiana University 42. Briefly, the raw data obtained from LTQ-Orbitrap XL mass spectrometer are converted to MASCOT generic file (MGF). MGF files were parsed with ProtParser subject to specific parsing criteria. Minimum MOWSE score was set to 30 and proteins with 2 peptides match or above were considered as a confident match. The peptide mass threshold, peak width and apex assignment window were set to 600 Da, 1.0 min and 0.5 min, respectively. Then, all parsed files were combined into a master file that contains the list of all proteins and peptides identified in all the processed LC-MS/MS analyses. Then the combined master files incorporated with their corresponding mzXML files were submitted to ProteinQuant as described previously.42 Two separate sets of data (runs for 10 patients and for 22 patients) were merged by removing proteins that were not found in any one set and renormalizing all data.
Western blot for Apolipoprotein E
An 11% SDS-PAGE gel was run with 0.2-1.0 mg of total proteins from PIC-treated plasma for a single patient to establish the linearity and the specificity of the response. Then, 0.5 mg of proteins of PIC-treated patients' plasma was loaded in triplicate onto nitrocellulose membrane using the slot-blot Bio-Dot SF Microfiltration Apparatus (Bio-Rad). Each blot was also loaded with an internal standard at two different concentrations in triplicate. The membrane was blocked by incubating in 25 mL of blocking solution (5% dried milk in TTBS, 0.1% Tween-20 in Tris-buffered saline pH 7.4) at room temperature for 1 hour. The membrane was incubated with a primary monoclonal anti-ApoE antibody ab1906 (Abcam, Cambridge, MA) 1:5,000 in a blocking solution for 1-3 hours at room temperature, rinsed six times with TTBS, incubated with a secondary goat poly-clonal anti-mouse IgG (conjugated to horse-radish peroxidase) 1:25,000 in blocking solution for 1 hour, and then rinsed with TTBS six more times. The membrane was immediately used for film exposure. Chemiluminescense was achieved with the SuperSignal® West Pico Chemiluminescent Substrate Kit (Pierce). Developed film was scanned using ImageScanner UTA-110 with compatible software, LabScan 5.0 1.0.8 (Amersham Biosciences). Each image was converted to a 300 dpi TIF file and exported to ImageQuant 5.0 (Molecular Dynamics). Identically sized boxes were placed around each exposed band and analyzed for exposure density with background correction.
In general, HUPO PPP guidelines were consulted 43, and most sensitive techniques and most rigorous protocols available to us were used. Detailed protocols are available in Supporting Information. The outline of proteomic work is summarized in Figure 1.
Figure 1.
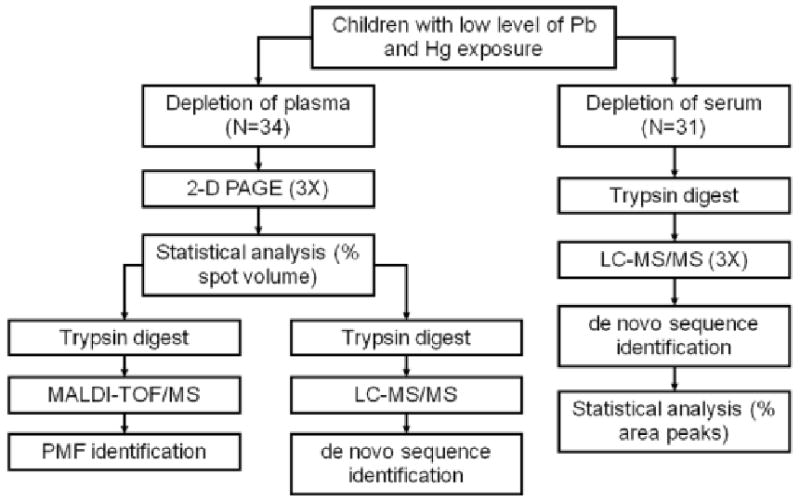
The general outline of proteomic studies of a general population of children exposed to low levels of environmental lead and mercury. Plasma proteins were separated by 2D-PAGE in triplicate and proteins were identified by PMF with MALDI-TOF/MS as well as by LC-MS/MS. Serum proteins were digested with trypsin and peptides were separated and analyzed using LC-MS/MS in triplicate.
Results and Discussion
Participants
The population of children in this study (N=34) had approximately equal number of both genders, and was predominantly Caucasian. These factors along with their body mass index and the measure of the socioeconomic status (Four Factor Index of Social Status according to Hollingshead44) were typical for children in this area9, 10, 45 (see Table 1).
Table 1.
Characteristics of participants.
| Number of children | 34 | |||
| Gender (male) | 47% | |||
| Race (Caucasian) | 94% | |||
| Average | SD | Min | Max | |
| Age (First Analysis) | 10.59 | 1.09 | 6.96 | 12.04 |
| Age (Second Analysis) | 12.24 | 1.13 | 8.61 | 13.72 |
| Socioeconomic Status | 40.44 | 10.01 | 12.00 | 64.50 |
| Body Mass Index, kg/m2 | 20.33 | 4.08 | 12.73 | 30.85 |
| Lead, microgram/dL | 0.99 | 0.54 | 0.27 | 3.16 |
| Mercury, microgram/L | 0.72 | 0.73 | 0.13 | 4.36 |
Pb and Hg concentrations were measured in triplicate at two different times. When available (N=28), averages of two measurements were used to get a better estimate of the long-term value of exposure to environmental toxicants. Mean Pb concentrations were found to be several-fold lower as compared to a previous study in this area (0.99 vs. 4.62 μg/dL10). The concentration was about 60% less than that of the national mean among adults in 1999-200212. The average Pb concentration of 0.99 μg/dL, while well below the 10 μg/dL limit, is in the range that may be relevant to both children and adult health7, 10. Hg blood concentrations are harder to evaluate. Concentrations we found were below the 5.8 μg/L limit of concern, and the average (0.72 μg/L) was about twice the national average found in 1-5 year old children (0.33 μg/L) and close to the national average in child bearing women (0.92 μg/L)46. We are unaware of any publications on Hg blood concentrations in this area or the medical relevance of such low blood Hg concentrations to human health.
2D-PAGE
The average protein concentration in PIC-treated plasma samples was determined to be 74±8 μg/μL, which was within the literature range of 62–100 μg/μL47, 48. Each patient's sample was depleted of the twelve most abundant proteins, which, as expected, removed about 93% of all proteins. To overcome the migratory variability of proteins in gels that arise from different running conditions, gels were run twelve at a time, four patients in triplicate, in a dodecyl cell at constant voltage, time, and temperature49. All 102 gels were digitized using a fluorescent scanner. The depletion, large size gels, and the use of fluorescent SYPRO Ruby Red allowed for the detection of a large number of distinct protein groups, with an average of 1377 and up to 1544 per gel. A single gel (patient 26, run 3) was selected as a reference gel based on a number of protein spots detected, resolution, minimum artifacts, and ability to generate significant number of groups across all gels. Groups (1286 in all) were identified across all gels with an average 86% RSD within triplicates (across all proteins for patient 26) in the raw data. During statistical analysis with SAS, 870 groups were eliminated as not passing the intraclass correlation (ICC) cutoff value of 0.6, eliminating most of the inconsistent triplicates. The remaining 416 groups (48% RSD, across all proteins for patient 26) were analyzed for associations with Pb or Hg tertiles. Pb tertiles were 0.27-0.74 μg/dL (11 patients), 0.74-0.978 μg/dL (12 patients), and 0.978-3.16 μg/dL (11 patients). Hg tertiles were 0.13-0.38 μg/L (11 patients) 0.38-0.75 μg/L (12 patients), and 0.75- 4.36μg/L (11 patients). While 48 groups were initially found to be associated with Pb or Hg, only 13 manually-processed groups exhibited either significant (p ≤ 0.05) or marginally significant (0.05 < p < 0.10) volume association with Pb tertiles and 11 with Hg tertiles (Figure 2).
Figure 2.
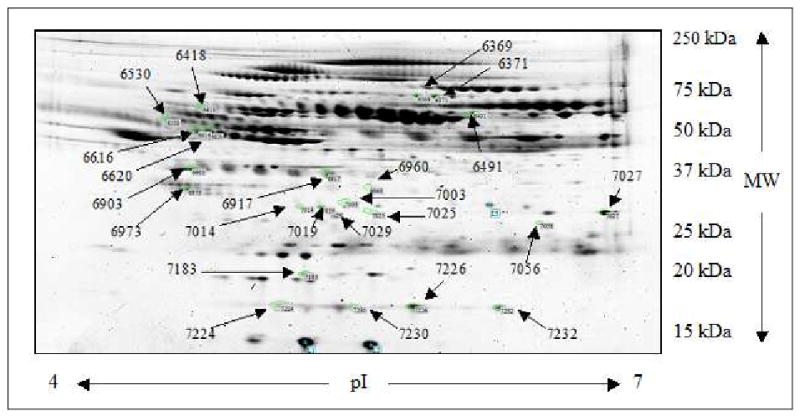
2-D map of significant protein groups. Representative 2-D polyacrylamide gel prepared with 40.0 μg of protein followed by staining with SYPRO Ruby. Twenty-four protein groups that associated with Pb or Hg tertiles are indicated by arrows.
Gender and SES were used as covariates for all statistical analyses. Twenty-two out of twenty-four groups were successfully identified with PMF using MALDI-TOF/MS with the MOWSE score from the SwissProt database being higher than 55 and average mass accuracy of 18 ppm (see Supplemental Information). Since the concentration of proteins was insufficient to confirm this identification using PSD on the MALDI-TOF/MS using even 500 μg of protein per gel, samples were reanalyzed using LC-MS/MS on an LTQ OrbiTrap mass spectrometer to accommodate HUPO PPP requirements43. Data was filtered from the master list of ninety-four proteins identified using total percent intensity (>15%), mass accuracy (exceeding 2 ppm), sequenced queries matched (less than two), mismatches between PMF and de-novo sequence identities, contaminants, depleted proteins, and molecular weight. The combined set of unequivocally identified groups (5 for Pb and 5 for Hg) is presented in Table 2. For Pb tertiles, two groups of apolipoprotein E, clusterin, chain C human complement component C3c, and vitronectin were found statistically significant or marginally significant. N-Acetylmuramoyl-L-alanine amidase, complement factor H-related protein 2, two groups of gelsolin, and vitronectin were associated with Hg. For groups that were identified using both methods, an average RSD for proteins triplicates across all patients was 26%. While it is very advantageous and sometimes necessary to see different isoforms and post-translational modifications of proteins using 2D-PAGE, the relatively large RSD in quantification of proteins made 2D-PAGE only partially useful in our case since an average observed up- or down-regulation across identified proteins was only 39%. Among the proteins in Table 2, two should be noted for a significant association with metal tertiles (p ≤ 0.05) and a significantly smaller RSD as compared to the corresponding regulation value. For Pb, that is apolipoprotein E (group 7019), and for Hg, that is gelsolin (group 6371).
Table 2.
Plasma proteins associated with Pb and Hg concentrations, quantified from 2D-PAGE data and identified with MALDI-TOF/MS and LC-MS/MS.
| 2D PAGE data | MALDI-TOF/MS | LC-MS/MS | |||||||||||
|---|---|---|---|---|---|---|---|---|---|---|---|---|---|
| Metal | Group | Swiss-Prot # | Protein ID | SAS p value | Regulation, % | RSD, % | Sm | ΔSm | Matched Peaks | Sequence Coverage, % | Sm | Queries matched | Sequence Coverage, % |
| Pb | 7019 | P02649 | Apolipoprotein E | 0.0268 | -49.17 | 14.64 | 178 | 144 | 18 | 52 | 793 | 14 | 59 |
| 6973 | P10909 | Clusterin | 0.0868 | -18.63 | 10.6 | 112 | 87 | 8 | 24 | 401 | 9 | 26 | |
| 6903 | P01024 | Chain C, Human Complement Component C3c | 0.0954 | 27.07 | 18.39 | 137 | 5 | 14 | 46 | 1346 | 24 | 21 | |
| 6418 | P04004 | Vitronectin | 0.0955 | 32.82 | 11.58 | 119 | 78 | 12 | 26 | 495 | 9 | 25 | |
| 7003 | P02649 | Apolipoprotein E | 0.0976 | 44.53 | 35.26 | 117 | 88 | 12 | 36 | 74 | 2 | 13 | |
| Hg | 6491 | Q96PD5 | N-acetylmuramoyl-L-alanine amidase | 0.0182 | 69.48 | 53.7 | 114 | 84 | 12 | 28 | 407 | 7 | 19 |
| 7029 | P36980 | Complement factor H-related protein 2 | 0.0236 | -43.76 | 34.76 | 98 | 59 | 10 | 30 | 220 | 4 | 18 | |
| 6371 | P06396 | Gelsolin | 0.0454 | -21.22 | 9.57 | 93 | 63 | 12 | 23 | 602 | 11 | 22 | |
| 6530 | P04004 | Vitronectin | 0.0472 | -59.46 | 61.51 | 82 | 61 | 8 | 18 | 368 | 6 | 19 | |
| 6369 | P06396 | Gelsolin | 0.0568 | -19.99 | 10.68 | 176 | 139 | 19 | 33 | 303 | 5 | 9 | |
Swiss-Prot # is the protein accession number, SAS p value is the significance of the association across tertiles, regulation is a percentage increase or decrease of the protein volume across tertiles, RSD is a relative standard deviation, calculated as standard deviation/average*100% within triplicates across all patients, Sm is the MOWSE score or the sum of the MOWSE scores for all queries, ΔSm is the difference in MOWSE scores of the identified protein and the next closest match, matched peaks is the number of peaks identified in the PMF, queries matched is the number of sequenced peptides identified by LC-MS/MS, and sequence coverage is the percentage of residues covered by the identified peaks.
To further validate our study, thirty-two serum samples of the original thirty-four patient samples were subjected to LC-MS/MS. Since this analysis starts with protease digestion, and inhibitors present in PIC-treated plasma would impede trypsin, serum samples were used instead. Serum was not available for the LC-MS/MS analysis of two patients. One patient had very inconsistent data (10-fold higher RSD than other samples), and was excluded as well. The overall RSD within triplicate LC runs across all proteins for patient 26, which was used as the reference in 2D-PAGE studies, was 3.1%; almost an order of magnitude less than that in 2D-PAGE. Pb tertiles were 0.27-0.70 μg/dL (10 patients), 0.70-0.975 μg/dL (11 patients), and 0.975-3.16 μg/dL (10 patients). Hg tertiles were 0.13-0.35 μg/L (10 patients), 0.35-0.75 μg/L (11 patients), and 0.75-4.36μg/L (10 patients). Proteins were identified with better than 2 ppm mass accuracy and a minimum of two peptides sequenced across all patients. Quantification reports consisting of 94 unequivocally identified proteins from thirty-one serum samples were generated according to the percent of total peak area intensity represented in the chromatogram for those peaks that were present in all samples. General linear modeling with an ICC cutoff value of 0.6 to identify significant regulation across tertiles controlling for gender and socioeconomic status using SAS did not exclude any proteins from this list. Sixteen proteins, four for Pb and twelve for Hg, were identified as having significant (p ≤ 0.05) or marginally significant (0.05 < p < 0.10) associations with metal tertiles (Table 3). Among the proteins identified, an average RSD for proteins triplicates across all patients was 7%, while an average observed up- or down-regulation across identified proteins was 44%. Since the precision and accuracy were significantly better in LC data as compared to 2D-PAGE data, we will further discuss the relevance of proteins identified with LC-MS/MS.
Table 3.
Serum proteins associated with Pb and Hg concentrations, quantified and identified by LC-MS/MS.
| Metal | Protein ID | Swiss-Prot # | SAS p-value | Regulation, % | RSD, % | Sm | Queries used in quantification | Sequence Coverage, % |
|---|---|---|---|---|---|---|---|---|
| Pb | Apolipoprotein E | P02649 | 0.0046 | −30.87 | 2.88 | 688 | 8 | 37 |
| Haptoglobin | P00738 | 0.082 | 55.02 | 1.46 | 1195 | 18 | 54 | |
| Coagulation factor XII | P00748 | 0.0842 | 18 | 11.97 | 144 | 2 | 4 | |
| Complement component C9 | P02748 | 0.0935 | 28.98 | 9.63 | 212 | 3 | 10 | |
| Hg | Peptidase inhibitor 16 | Q6UXB8 | 0.0031 | −32.11 | 6.79 | 68 | RPYQEGTPCSQCPSGY HCK | 4 |
| Complement component C7 | P10643 | 0.0069 | −38.75 | 6.44 | 104 | 2 | 5 | |
| Pigment epithelium-derived factor | P36955 | 0.0165 | 49.88 | 15.14 | 139 | 2 | 12 | |
| Insulin-like growth factor-binding protein complex acid labile chain | P35858 | 0.0232 | −17.59 | 5.79 | 83 | 2 | 6 | |
| Complement factor I | P05156 | 0.0324 | 23.31 | 3.98 | 143 | 2 | 4 | |
| Apolipoprotein D | P05090 | 0.0487 | −33.74 | 5.47 | 88 | MTVTDQVNCPK | 6 | |
| Ig mu related | P04220/P01871 | 0.0501 | 293.01 | 12.46 | 598/765 | 10/12 | 38/36 | |
| Inter-alpha-trypsin inhibitor heavy chain H3 | Q06033 | 0.0515 | −26.52 | 6.97 | 57 | LWAYLTIEQLLEK | 2 | |
| Alpha-1-acid glycoprotein 2 | P19652 | 0.0651 | 16.34 | 2.75 | 300 | 4 | 26 | |
| Thyroid receptor-interacting protein 11 | Q15643 | 0.0707 | 25.68 | 12.32 | 72 | 2 | 2 | |
| Gelsolin | P06396 | 0.0767 | −12.07 | 2.21 | 526 | 8 | 20 | |
| Alpha-2-macroglobulin | P01023 | 0.0979 | −8.86 | 0.54 | 4792 | 76 | 66 |
Swiss-Prot # is the protein accession number, SAS p value is the significance of the association across tertiles, regulation is a percentage increase or decrease of the protein volume across tertiles, RSD is a relative standard deviation, calculated as standard deviation/average*100% within triplicates across all patients, Sm is the sum of the MOWSE scores for all queries, Queries used in quantification is the number of LC peaks identified across all runs that was used to quantify the amount of protein, and sequence coverage is the percentage of residues covered by the peaks listed.
LC-MS/MS data with respect to blood Pb concentration
Apolipoprotein E (ApoE) was identified as a protein exhibiting a significant association (p<0.005) of negative 31% in volume across Pb tertiles with an RSD of 3%. Notably, ApoE was the only protein identified by 2D-PAGE analysis as well (p ≤ 0.05, 49% down-regulation, 15% RSD). For that reason, additional statistical evaluations of this linear trend were made. When the top five Pb concentration and bottom five Pb concentration patients were considered from LC-MS/MS data, ApoE was found to be down by 39%. In addition, the Pb concentrations were log transformed and the linear relationship was confirmed from LC-MS/MS data for ApoE across all 31 patients as significant (controlling for SES and gender all studies; p ≤ 0.05). Finally, Western blot was performed using monoclonal anti-ApoE antibody for plasma-PIC samples (N=34). ApoE was found to be significantly associated with Pb tertiles as well (p ≤ 0.05, 34% down-regulation, 20% RSD). Western blot had an RSD comparable to that of 2D-PAGE. Western's strong advantage was in its ability to discriminate against all other proteins, as ApoE was the only protein detected on the gel. ApoE's concentration was linear with the chemoluminescent signal produced. This particular antibody could not discriminate among different forms of ApoE, just like LC-MS/MS, while 2D-PAGE could. Different ApoE detection methods are summarized in Figure 3.
Figure 3.

Concentration of Apolipoprotein E across Pb tertiles using different detection methods. Groups 7014, 7019, 7003 on 2D-PAGE were identified as significantly associated with Pb tertiles, identified by PMF only; the sum of % protein intensities are added for PMF only bars; 7019 and 7003 were confirmed by LC-MS/MS, the sum of those two groups is shown in PMF+MS/MS bars; LC-MS/MS percent intensity of ApoE concentration was multiplied by 10 to fit the scale of the graph; Western blot units of ApoE concentration were multiplied by 10-9 to fit the scale of the graph.
ApoE is a member of a family of proteins known as apolipoproteins, which in part regulate lipid transport in the body, specifically, low-density lipoproteins (LDL)50. ApoE binds to LDL receptors along the lipid bilayer and facilitates the transport of fats50. Humans have three variants of the ApoE gene, ε2 (with two Cys in protein's structure), ε3 (with one Cys and one Arg), and ε4 (with two Arg), which can make six possible phenotypes51. In humans, ApoE genotyping provides modest positive associations with plaque and coronary heart disease outcomes51. This is important because it has been established that current blood Pb levels in children were associated with greater TPR and stroke volume (SV) responses to acute stress, parameters that may lead to cardiovascular disease10. The TRP and SV associations with lead tertiles were also observed in this study (data not shown), and we also found an association of Pb with ApoE. Most significantly, there is evidence that Pb exposure affects psychiatric symptoms in adults52. Moreover, neurobehavioral changes (executive ability, manual dexterity, psychomotor skills) due to Pb exposure have been associated with ApoE ε4 allele53. There is a presumed protective role of ApoE ε2 and ε3 in Pb53 and Hg54 toxicity for adults. When compared to ε4, these two genotypes are more frequent in a population, proteins are expressed more, have more Cys, and are capable of forming dimers55-57. Interestingly, in children, it is ApoE ε4 that protects them better than ApoE ε2 or ApoE ε3; among 311 subjects, the negative effects for umbilical cord Pb level on the Mental Development Index of the Baley Scale was almost 4-fold greater among ApoE ε2/3 carriers58. Neither of these two studies measured the levels of ApoE, and this is the first report to highlight the relationship between low-level Pb and ApoE in children. Unfortunately, lack of sample prohibits us from genotyping this cohort of subjects. Based on our studies in children with the environmental exposure to Pb, we cannot say whether Pb affects apoE levels or apoE affects Pb. To address these issues, the expanded studies with Pb and ApoE measurements, ApoE genotyping, and experiments designed to define the directionality of the relationship are underway in our laboratory.
In addition to ApoE, three more potential cardiovascular disease related proteins were identified (0.05 < p < 0.10). These include haptoglobin, which is an inflammatory response protein associated with CVD such as atherosclerosis59-61; coagulation factor XII, which is a cascade protein associated with coronary heart disease and increased artherosclerotic burden62-64; and complement component C9, which is an autoimmune response protein associated with inflammation65-68. These proteins should not be overlooked as participants in cardiovascular disease since a composite index of weakly associated factors can act as an indicator for disease progression30, 69.
Interestingly, ApoE and Pb have each been implicated in Alzheimer's disease (AD). The ApoE ε4 allele has been shown to play a role in AD 70, and exposure to Pb early in life induces AD-like pathology in aging rats71, 72 and monkeys73. Studies in adults with and without AD found that serum concentrations of ApoE are decreased in AD patients; however, those concentrations were not as useful a marker for AD as the presence of the ε4 allele 55, 74, 75. While AD is beyond the scope of this study, the above is in general agreement with our observations of the inverse association between Pb and ApoE serum concentrations.
LC-MS/MS data with respect to blood Hg concentration
The search for proteins that exhibited expressional difference with respect to Hg produced some relevant results. Peptidase inhibitor 16, complement component C7, pigment epithelium-derived factor, insulin-like growth factor-binding protein complex acid labile chain, complement factor I, and apolipoprotein D were identified as proteins exhibiting significant volume regulations (p ≤ 0.05) across Hg tertiles. Complement component C7 and complement factor I are inflammatory response proteins66, 76-78. Apolipoprotein D has been identified as a protein involved in lipid ransport79. Pigment epithelium derived factor protein and insulin-like growth factor-binding protein have been associated with vascular injury and heart failure, respectively80, 81. In addition to these proteins, four of the six marginally significant proteins (Table 3, 0.05 < p < 0.1) were characterized as proteins with cardiovascular roles. Immunoglobulin mu heavy chain disease protein, inter-alpha-trypsin inhibitor heavy chain H3, alpha-1-acid glycoprotein 2, thyroid receptor-interacting protein 11, gelsolin, and alpha-2-macroglobulin were identified as exhibiting marginally significant regulations across tertiles. Inter-alpha-trypsin inhibitor heavy chain H3, gelsolin, and alpha-1-acid glycoprotein 2 were identified as inflammatory sensitive proteins associated with myocardial infarction and heart failure.82-86 In addition to this, gelsolin has been identified as being down-regulated by gel electrophoresis followed by MALDI-TOF/MS and tandem mass spectrometry. Alpha-2-macroglobulin, a protease inhibitor, has been associated with the progression of cardiac disease87. Peptidase inhibitor 16 (PI16), Ig mu heavy chain disease protein, and thyroid receptor-interacting protein 11, were not readily identified through literature searches as having a known role in cardiovascular disease. The importance of these associations should not be overlooked despite the facts that at the blood concentrations of Hg in our patients, which are relatively low, no apparent effects on humans are known14 and none of these proteins are known to us as being involved in Hg-induced problems; this data might be useful in developing biological markers of metal toxicity later on88.
Experimental limitations
Limitations of the current study should be considered for future toxicological proteomic studies. The current sample size is insufficient to provide the breadth needed to statistically evaluate a complete model of Pb and Hg as predictors of cardiovascular functioning. The small size of our study cohort can only support the use of two confounders (SES and gender) without over-fitting the data resulting in a biased analysis. Similarly, a new larger sample size study would also allow us to consider the potential interaction between Pb and Hg and the potential association of ApoE genotype with concentrations of metals or cardiovascular parameters in our patients. Also, larger size of the sample might improve or disprove the significance of the associations we have so far identified38.
Further limitations imposed on us by our current sample are the racial composition (94% Caucasian) and the metal concentration distribution (relatively low) in our patients. While both were typical for the local population, they limit our ability to extrapolate our findings to the population across the US, and we also cannot extrapolate our findings to any other concentrations of heavy metals but the ones we have measured.
Shot-gun proteomics of human blood, a very complex system with a multitude of proteins present, may provide us with some associations that are not true. On the other hand, despite the increased sensitivity of the LC-MS/MS method used, only a fraction (94 proteins) of a conservative estimate of one thousand detectable proteins was identified in our study. Even if all these proteins were relevant to cardiovascular disease risk, this would only represent half of the previously identified cardiovascular proteins30. It is evident, technological advancements are still needed for a complete understanding of the human proteome.
Lastly, our cross-sectional approach does not allow us to determine the causal pathway explaining the association between metal levels and protein levels in our patients.
Conclusions
The present study demonstrates the vital role proteomics has in toxicological studies. We found that 2D-PAGE, LC-MS/MS, and Western blot had different strengths and weaknesses, and complimented each other and thereby provided a more complete picture of the associations being considered. We successfully identified sixteen proteins in children's blood that exhibited associations in the presence of low-level concentrations of Pb and Hg using LC-MS/MS. Of the sixteen proteins identified, thirteen were associated with cardiovascular disease, seven of which were significantly up- or down-regulated in the presence of Pb and Hg. These findings support previous evidence that have associated Pb and Hg exposure with an increase in risk factors related to cardiovascular disease such as elevated blood pressure and heightened vascular response to acute stress10, 78, 89. Of the seven significantly regulated proteins, ApoE was identified as being significantly regulated through three alternative methods of detection and analysis, gel electrophoresis, liquid chromatography, and Western blot, thus validating it for further assessment as a biomarker of CVD related to blood Pb levels in children35. ApoE polymorphisms influence plasma concentrations of total cholesterol, LDL cholesterol, ApoB, concentration of ApoE, confer a greater risk of coronary heart disease and, importantly, influence the risk of injury by Pb 51, 53, 58. This proteomic study has shown a statistically relevant association of ApoE with Pb in children's blood at levels that are well below the threshold of concern established by the CDC. The health risk to adults and children posed by persistent environmental toxicants such as heavy metals, validates the need to extend the current proteomic study to further explore the relationship between ApoE and Pb toxicity.
Supplementary Material
Acknowledgments
We thank Kristen Roosa (SUNY-Oswego, Oswego, NY) for her assistance with the organization of the data, Dr. Mark Schmidt (Upstate Medical University, Syracuse, NY) for allowing us to use the fluorescent scanner, and Dr. Robert Morgan and his assistants (Oswego Family Physicians, Oswego Hospital, Oswego, NY) for their help with blood specimen collection. Dr. Parsons and Dr. Palmer were responsible only for the blood Pb and Hg analyses carried out as part this work. This work was supported by the following grants: NIH-R15 (1R15ES015619-01), NSF-MRI (0420616), Merck-AAAS (1005881), a student SCAC grant from SUNY-Oswego, and the summer student support from the Department of Chemistry at SUNY at Oswego.
Footnotes
Supporting Information A table of 2D-PAGE proteins identified by PMF MALDI-TOF/MS, a table of anonymous patient data, and raw cumulative numerical data for 2D-PAGE, LC-MS/MS, and Western blot are available free of charge via the Internet at http://pubs.acs.org.
Contributor Information
Robert E. Birdsall, Email: rbirdsa@purdue.edu.
Michael P. Kiley, Email: mkile001@umaryland.edu.
Zaneer M. Segu, Email: zsegu@indiana.edu.
Christopher D. Palmer, Email: palmer@wadsworth.org.
Milan Madera, Email: milan.madera@gmail.com.
Brooks B. Gump, Email: brooks.gump@oswego.edu.
James A. MacKenzie, Email: james.mackenzie@oswego.edu.
Patrick J. Parsons, Email: pparsons@wadsworth.org.
Yehia Mechref, Email: ymechref@indiana.edu.
Milos V. Novotny, Email: novotny@indiana.edu.
References
- 1.Prus-Ustun Annette, F L, Landrigan Philip J, Ayuso-Mateos Jose Luis. Global and Regional Burden of Diseases Attributable to Selected Major Risk Factors; Chapter 19. [01/19/2010];Lead exposure. http://www.who.int/publications/cra/chapters/volume2/1495-1542.pdf.
- 2.WHO Chapter 6.7 Lead. [01/19/2010];Air Quality Guidelines. www.euro.who.int/document/aiq/6_7lead.pdf.
- 3.WHO Chapter 6.9 Mercury. [01/19/2010];Air Quality Guidelines. www.euro.who.int/document/aiq/6_9mercury.pdf.
- 4.White LD, Cory-Slechta DA, Gilbert ME, Tiffany-Castiglioni E, Zawia NH, Virgolini M, Rossi-George A, Lasley SM, Qian YC, Basha MR. New and evolving concepts in the neurotoxicology of lead. Toxicol Appl Pharmacol. 2007;225(1):1–27. doi: 10.1016/j.taap.2007.08.001. [DOI] [PubMed] [Google Scholar]
- 5.Ekong EB, Jaar BG, Weaver VM. Lead-related nephrotoxicity: a review of the epidemiologic evidence. Kidney Int. 2006;70(12):2074–84. doi: 10.1038/sj.ki.5001809. [DOI] [PubMed] [Google Scholar]
- 6.Mudipalli A. Lead hepatotoxicity & potential health effects. Indian J Med Res. 2007;126(6):518–27. [PubMed] [Google Scholar]
- 7.Menke A, Muntner P, Batuman V, Silbergeld E, Guallar E. Blood Lead Below 0.48 μmol/L (10 μg/dL) and Mortality Among US Adults. Circulation. 2006;114:1388–1394. doi: 10.1161/CIRCULATIONAHA.106.628321. [DOI] [PubMed] [Google Scholar]
- 8.Needleman HL, Schell A, Bellinger D, Leviton A, Allred EN. The long-term effects of exposure to low doses of lead in childhood. An 11-year follow-up report. N Engl J Med. 1990;322(2):83–8. doi: 10.1056/NEJM199001113220203. [DOI] [PubMed] [Google Scholar]
- 9.Gump BB, Reihman J, Stewart P, Lonky E, Darvill T, Matthews KA. Blood Lead (Pb) Levels: A Potential Environmental Mechanism Explaining the Relation Between Socioeconomic Status and Cardiovascular Reactivity in Children. Health Psychol. 2007;26(3):296–304. doi: 10.1037/0278-6133.26.3.296. [DOI] [PubMed] [Google Scholar]
- 10.Gump BB, Reihman J, Stewart P, Lonky E, Darvill T, Matthews KA, Parson PJ. Prenatal and early childhood blood lead levels and cardiovascular functioning in 9 1/2 year old children. Neurotoxicology and Teratology. 2005;27:655–665. doi: 10.1016/j.ntt.2005.04.002. [DOI] [PubMed] [Google Scholar]
- 11.Nawrot TS, Staessen JA. Low-level environmental exposure to lead unmasked as silent killer. Circulation. 2006;114(13):1347–9. doi: 10.1161/CIRCULATIONAHA.106.650440. [DOI] [PubMed] [Google Scholar]
- 12.Muntner P, Menke A, DeSalvo KB, Rabito FA, Batuman V. Continued decline in blood lead levels among adults in the United States: the National Health and Nutrition Examination Surveys. Arch Intern Med. 2005;165(18):2155–61. doi: 10.1001/archinte.165.18.2155. [DOI] [PubMed] [Google Scholar]
- 13.Flegal AR, Smith DR. Lead levels in preindustrial humans. N Engl J Med. 1992;326(19):1293–4. [PubMed] [Google Scholar]
- 14.Holmes P, James KA, Levy LS. Is low-level environmental mercury exposure of concern to human health? Sci Total Environ. 2009;408(2):171–82. doi: 10.1016/j.scitotenv.2009.09.043. [DOI] [PubMed] [Google Scholar]
- 15.Virtanen J, Rissanen T, Voutilainen S, Tuomainen T. Mercury as a risk factor for cardiovascular disease. Journal of Nutritional Biochemistry. 2007;18:75–85. doi: 10.1016/j.jnutbio.2006.05.001. [DOI] [PubMed] [Google Scholar]
- 16.Schober S, S T, Jones R. Blood Mercury Levels in Young Children and Childbearing-Aged Women- United States, 1999--2002. Journal of the American Medical Association [Online] 2003:1667–74. http://www.cdc.gov/mmwr/preview/mmwrhtml/mm5343a5.htm.
- 17.Hebestreit H. Proteomics: an holistic analysis of nature's proteins. Current Opinions in Pharmacology. 2001;1:513–520. doi: 10.1016/s1471-4892(01)00089-3. [DOI] [PubMed] [Google Scholar]
- 18.Twyman RM. Principles of Proteomics. Garland Science/BIOS Scientific; New York, N.Y.: 2004. p. 241. [Google Scholar]
- 19.Bar C, Patil R, Doshi J, Kulkarni MJ, Gade WN. Characterization of the proteins of bacterial strain isolated from contaminated site involved in heavy metal resistance--a proteomic approach. J Biotechnol. 2007;128(3):444–51. doi: 10.1016/j.jbiotec.2006.11.010. [DOI] [PubMed] [Google Scholar]
- 20.Qian Y, Harris ED, Zheng Y, Tiffany-Castiglioni E. Lead targets GRP78, a molecular chaperone, in C6 rat glioma cells. Toxicol Appl Pharmacol. 2000;163(3):260–6. doi: 10.1006/taap.1999.8878. [DOI] [PubMed] [Google Scholar]
- 21.Witzmann FA, Fultz CD, Grant RA, Wright LS, Kornguth SE, Siegel FL. Regional protein alterations in rat kidneys induced by lead exposure. Electrophoresis. 1999;20(4-5):943–51. doi: 10.1002/(SICI)1522-2683(19990101)20:4/5<943::AID-ELPS943>3.0.CO;2-A. [DOI] [PubMed] [Google Scholar]
- 22.Neal R, Aykin-Burns N, Ercal N, Zigler JS., Jr Pb2+ exposure alters the lens alpha A-crystallin protein profile in vivo and induces cataract formation in lens organ culture. Toxicology. 2005;212(1):1–9. doi: 10.1016/j.tox.2005.03.015. [DOI] [PubMed] [Google Scholar]
- 23.Toraason M, Moorman W, Mathias PI, Fultz C, Witzmann F. Two-dimensional electrophoretic analysis of myocardial proteins from lead-exposed rabbits. Electrophoresis. 1997;18(15):2978–82. doi: 10.1002/elps.1150181540. [DOI] [PubMed] [Google Scholar]
- 24.Zhai R, Su S, Lu X, Liao R, Ge X, He M, Huang Y, Mai S, Lu X, Christiani D. Proteomic profiling in the sera of workers ocupationally exposed to arsenic and lead: identification of potential biomarkers. BioMetals. 2005;18:603–613. doi: 10.1007/s10534-005-3001-x. [DOI] [PubMed] [Google Scholar]
- 25.Fanous A, Weiss W, Gorg A, Jacob F, Parlar H. A proteome analysis of the cadmium and mercury response in Corynebacterium glutamicum. Proteomics. 2008;8(23-24):4976–86. doi: 10.1002/pmic.200800165. [DOI] [PubMed] [Google Scholar]
- 26.Vendrell I, Carrascal M, Vilaro MT, Abian J, Rodriguez-Farre E, Sunol C. Cell viability and proteomic analysis in cultured neurons exposed to methylmercury. Hum Exp Toxicol. 2007;26(4):263–72. doi: 10.1177/0960327106070455. [DOI] [PubMed] [Google Scholar]
- 27.Vendrell I, Carrascal M, Campos F, Abian J, Sunol C. Methylmercury disrupts the balance between phosphorylated and non-phosphorylated cofilin in primary cultures of mice cerebellar granule cells. A proteomic study. Toxicol Appl Pharmacol. 2009 Oct 06;242(1):109–18. doi: 10.1016/j.taap.2009.09.022. epub. [DOI] [PubMed] [Google Scholar]
- 28.McKelvey W, Gwynn R, Jeffery N, Kass D, Thorpe L, Garg R, Palmer C, Parsons P. A Biomonitoring Study of Lead, Cadmium, and Mercury in the Blood of New York City Adults. Environmental Health Perspectives. 2007;115(10):1435–1441. doi: 10.1289/ehp.10056. [DOI] [PMC free article] [PubMed] [Google Scholar]
- 29.Palmer C, Lewis M, Geraghty C, Barbosa F, Parsons P. Determination of lead, cadmium and mercury in blood for assessment of environmental exposure: A comparison between inductively coupled plasma-mass spectrometry and atomic absorption spectrometry. Spectrochimica Acta Part B. 2006;61:980–990. [Google Scholar]
- 30.Anderson L. Candidate-based proteomics in the search for biomarkers of cardiovascular disease. Journal of Physiology. 2005;563(1):23–60. doi: 10.1113/jphysiol.2004.080473. [DOI] [PMC free article] [PubMed] [Google Scholar]
- 31.Chich J, David O, Villers F, Schaeffer B, Lutomski D. Statistics for proteomics: Experimental design and 2-DE differential analysis. Journal of Chromatography B. 2007;849:261–272. doi: 10.1016/j.jchromb.2006.09.033. [DOI] [PubMed] [Google Scholar]
- 32.Inc, S I SAS, 9.1.3 Service Pack 4. SAS Institute Inc.; Cary, NC: 2002–2003. [Google Scholar]
- 33.Pellis L, Nicole L, Franssen-Van H, Burema J, Keijer J. The intraclass correlation coefficient applied for evaluation of data correction, labeling methods, and rectal biopsy sampling in DNA microarray experiments. Physiological Genomics. 2003;16:99–106. doi: 10.1152/physiolgenomics.00111.2003. [DOI] [PubMed] [Google Scholar]
- 34.Ewout W, Harrell F., Jr . Statistical models for prognostication In: Symptom research: Methods and Opportunities. Bethesda: National Institutes of Health; 2009. [Google Scholar]
- 35.Babyak D. What you see may not be what you get: a brief, nontechnical introduction to overfitting in regression-type models. Psychosomatic Medicine. 2004;66:411–421. doi: 10.1097/01.psy.0000127692.23278.a9. [DOI] [PubMed] [Google Scholar]
- 36.Rodriguez-Pineiro A, Rodriguez-Berrocal F, Cadena M. Improvements in the search for potential biomarkers by proteomics: Application of principal component and discriminant analyses for two-dimensional maps evaluation. Journal of Chromatography B. 2007;849:251–260. doi: 10.1016/j.jchromb.2006.09.021. [DOI] [PubMed] [Google Scholar]
- 37.MacKinnon D, Krull J, Lockwood C. Equivalence of the Mediation, Confounding and Suppression Effect. Prevention Science. 2000;1(4):173–181. doi: 10.1023/a:1026595011371. [DOI] [PMC free article] [PubMed] [Google Scholar]
- 38.Perneger TV. What's wrong with Bonferroni adjustments. BMJ. 1998;316(7139):1236–8. doi: 10.1136/bmj.316.7139.1236. [DOI] [PMC free article] [PubMed] [Google Scholar]
- 39.Zubarev R, Mann M. On the Proper Use of Mass Accuracy in Proteomics. Molecular & Cellular Proteomics. 2007;6(3):377–381. doi: 10.1074/mcp.M600380-MCP200. [DOI] [PubMed] [Google Scholar]
- 40.Dodds E, Clowers B, Hagerman P, Lebrilla C. Systematic characterization of high mass accuracy influence on false discovery and probability scoring in peptide mass fingerprinting. Analytical Biochemistry. 2008;372:156–166. doi: 10.1016/j.ab.2007.10.009. [DOI] [PMC free article] [PubMed] [Google Scholar]
- 41.Olsen J, de Godoy L, Li G, Macek B, Mortensen P, Pesch R, Makarov A, Lange O, Horning S, Mann M. Parts per Million Mass Accuracy on an Orbitrap Mass Spectrometer via Lock Mass Injection into a C-trap. Molecular & Cellular Proteomics. 2005;4(12):2010–2021. doi: 10.1074/mcp.T500030-MCP200. [DOI] [PubMed] [Google Scholar]
- 42.Mann B, Madera M, Sheng Q, Tang H, Mechref Y, Novotny M. ProteinQuant Suite: a bundle of automated software tools for label-free quantitative proteomics. Rapid communications in mass spectrometry. 2008;22:3823–3834. doi: 10.1002/rcm.3781. [DOI] [PubMed] [Google Scholar]
- 43.Omenn G, States D, Adamski M, Blackwell T, Menon R, Hermjakob H, Apweiler R, Haab B, Simpson R, Eddes J, Kapp E, Moritz R, Chan D, Rai A, Admon A, Aebersold R, Eng J, JHancock W, Hefta S, Meyer H, Paik Y, Yoo J, Ping P, Punds J, Adkins J, Qian X, Wang R, Wasinger V, Wu C, Zhao X, Zeng R, Archakov A, Tsugita A, Beer I, Pandey A, Pisano M, Andrews P, Tammen H, Speicher D, Hanash S. Overview of the HUPO Plasma Proteome Project: Results from the pilot phase with 35 collaborating laboratories and multiple analytical groups, generating a core dataset of 3020 proteins and a publicly-available database. Proteomics. 2005;5:3226–3245. doi: 10.1002/pmic.200500358. [DOI] [PubMed] [Google Scholar]
- 44.Hollingshead AB. Four Factor Index of Social Status. Yale University; New Haven, CT: 1975. [Google Scholar]
- 45.Gump BB, Reihman J, Stewart P, Lonky E, Darvill T. Terrorism and cardiovascular responses to acute stress in children. Health Psychol. 2005;24(6):594–600. doi: 10.1037/0278-6133.24.6.594. [DOI] [PubMed] [Google Scholar]
- 46.Blood mercury levels in young children and childbearing-aged women--United States, 1999-2002. MMWR Morb Mortal Wkly Rep. 2004;53(43):1018–20. [PubMed] [Google Scholar]
- 47.Van Slyke D, Hiller A, Phillips R, Hamilton B, Dole V, Archibald R, Eder H. The estimation of plasma protein concentration from plasma specific gravity. The Journal of Biological Chemistry. 1949:331–347. [Google Scholar]
- 48.Anderson N, Anderson L. The Human Plasma Proteome. Molecular & Cellular Proteomics. 2002;1:845–867. doi: 10.1074/mcp.r200007-mcp200. [DOI] [PubMed] [Google Scholar]
- 49.Eravci M, Fuxius S, Broedel O, Weist S, Eravci S, Mansmann U, Schluter H, Tiemann J, Baumgartner A. Improved comparitive proteome analysis based on two-dimensional gel electrophoresis. Proteomics. 2007;7:513–523. doi: 10.1002/pmic.200600648. [DOI] [PubMed] [Google Scholar]
- 50.Hatters D, Peters-Libey C, Weisgraber K. Apolipoprotein E structure: insights into function. TRENDS in Biochemical Sciences. 2006;31(8):445–454. doi: 10.1016/j.tibs.2006.06.008. [DOI] [PubMed] [Google Scholar]
- 51.Eichner JE, Dunn ST, Perveen G, Thompson DM, Stewart KE, Stroehla BC. Apolipoprotein E polymorphism and cardiovascular disease: a HuGE review. Am J Epidemiol. 2002;155(6):487–95. doi: 10.1093/aje/155.6.487. [DOI] [PubMed] [Google Scholar]
- 52.Shih RA, Hu H, Weisskopf MG, Schwartz BS. Cumulative lead dose and cognitive function in adults: a review of studies that measured both blood lead and bone lead. Environ Health Perspect. 2007;115(3):483–92. doi: 10.1289/ehp.9786. [DOI] [PMC free article] [PubMed] [Google Scholar]
- 53.Stewart WF, Schwartz BS, Simon D, Kelsey K, Todd AC. ApoE genotype, past adult lead exposure, and neurobehavioral function. Environ Health Perspect. 2002;110(5):501–5. doi: 10.1289/ehp.02110501. [DOI] [PMC free article] [PubMed] [Google Scholar]
- 54.Godfrey ME, Wojcik DP, Krone CA. Apolipoprotein E genotyping as a potential biomarker for mercury neurotoxicity. J Alzheimers Dis. 2003;5(3):189–95. doi: 10.3233/jad-2003-5303. [DOI] [PubMed] [Google Scholar]
- 55.Siest G, Bertrand P, Qin B, Herbeth B, Serot JM, Masana L, Ribalta J, Passmore AP, Evans A, Ferrari M, Franceschi M, Shepherd J, Cuchel M, Beisiegel U, Zuchowsky K, Rukavina AS, Sertic J, Stojanov M, Kostic V, Mitrevski A, Petrova V, Sass C, Merched A, Salonen JT, Tiret L, Visvikis S. Apolipoprotein E polymorphism and serum concentration in Alzheimer's disease in nine European centres: the ApoEurope study. ApoEurope group. Clin Chem Lab Med. 2000;38(8):721–30. doi: 10.1515/CCLM.2000.102. [DOI] [PubMed] [Google Scholar]
- 56.Hatters DM, Peters-Libeu CA, Weisgraber KH. Apolipoprotein E structure: insights into function. Trends Biochem Sci. 2006;31(8):445–54. doi: 10.1016/j.tibs.2006.06.008. [DOI] [PubMed] [Google Scholar]
- 57.Elliott DA, Halliday GM, Garner B. Apolipoprotein-E forms dimers in human frontal cortex and hippocampus. BMC Neurosci. 11:23. doi: 10.1186/1471-2202-11-23. [DOI] [PMC free article] [PubMed] [Google Scholar]
- 58.Wright RO, Hu H, Silverman EK, Tsaih SW, Schwartz J, Bellinger D, Palazuelos E, Weiss ST, Hernandez-Avila M. Apolipoprotein E genotype predicts 24-month bayley scales infant development score. Pediatr Res. 2003;54(6):819–25. doi: 10.1203/01.PDR.0000090927.53818.DE. [DOI] [PubMed] [Google Scholar]
- 59.Quaye I. Haptoglobin, inflammation and disease. Transactions of the Royal Society of Tropical Medicine and Hygiene. 2008;102 doi: 10.1016/j.trstmh.2008.04.010. [DOI] [PubMed] [Google Scholar]
- 60.Shor M, Boaz M, Gavish D, Wainshtein J, Matas Z, Shargorodsky M. Relation of Haptoglobin Phenotype to Early Vascular Changes in Patients With Diabetes Mellitus. American Journal of Cardiology. 2007;100:1767–1770. doi: 10.1016/j.amjcard.2007.07.052. [DOI] [PubMed] [Google Scholar]
- 61.Levy A, Hochberg I, Jablonski K, Resnick H, Lee E, Best L, Howard B. Haptoglobin Phenotype Is an Independent Risk Factor for Cardiovascular Disease in Individuals With Diabetes: The Strong Heart Study. Journal of the American College of Cardiology. 2002;40(11):1984–1990. doi: 10.1016/s0735-1097(02)02534-2. [DOI] [PubMed] [Google Scholar]
- 62.Shan J, Baguinon M, Zheng L, Krishnamoorthi R. Expression, refolding, and activation of the catalytic domain of human blood coagulation factor XII. Protein Expression and Purification. 2003;27:143–149. doi: 10.1016/s1046-5928(02)00608-3. [DOI] [PubMed] [Google Scholar]
- 63.Miller G, Esnouf M, Burgess A, Cooper J, J M. Risk of Coronary Heart Disease and Activation of Factor XII in Middle-Aged Men. Arteriosclerosis, Thrombosis, and Vascualr Biology. 1997;17:2103–2106. doi: 10.1161/01.atv.17.10.2103. [DOI] [PubMed] [Google Scholar]
- 64.Zito F, Lowe G, Rumley A, McMahon A, Humphries E. Association of the factor XII 46>T polymorphism with risk of coronary heart disease (CHD) in the WOSCOPS study. Atherosclerosis. 2002;165:153–158. doi: 10.1016/s0021-9150(02)00196-x. [DOI] [PubMed] [Google Scholar]
- 65.Stanley K, Kocher H, Luzio J, Jackson P, Tschopp J, Dickson J. The sequence and topology of human complement component C9. The EMBO Journal. 1985;4(2):375–382. doi: 10.1002/j.1460-2075.1985.tb03639.x. [DOI] [PMC free article] [PubMed] [Google Scholar]
- 66.Sherwood L. Human Physiology From Cells to Systems. 6. Thomson Brooks/Cole; Belmont, C.A.: 2007. [Google Scholar]
- 67.Eriksson U, Penninger J, Kopf M. Mechanisms of autoimmune heart disease. Drug Discovery Today: Disease Mechanisms. 2004;1(3):283–288. [Google Scholar]
- 68.Eriksson U, Kopf M, Afanasyeva M, Penninger J. Models of autoimmune heart disease. Drug Discovery Today: Disease Mechanisms. 2004;1(4):411–416. [Google Scholar]
- 69.Doherty N, Littman B, Reilly K, Swindell A, Buss J, Anderson N. Analysis of changes in acute-phase plasma proteins in an acute inflammatory response and in rheumatoid arthritis using two-dimensional gel electrophoresis. Electrophoresis. 1998;19:355–363. doi: 10.1002/elps.1150190234. [DOI] [PubMed] [Google Scholar]
- 70.Thomas P, Fenech M. A review of genome mutation and Alzheimer's disease. Mutagenesis. 2007;22(1):15–33. doi: 10.1093/mutage/gel055. [DOI] [PubMed] [Google Scholar]
- 71.Basha MR, Wei W, Bakheet SA, Benitez N, Siddiqi HK, Ge YW, Lahiri DK, Zawia NH. The fetal basis of amyloidogenesis: exposure to lead and latent overexpression of amyloid precursor protein and beta-amyloid in the aging brain. J Neurosci. 2005;25(4):823–9. doi: 10.1523/JNEUROSCI.4335-04.2005. [DOI] [PMC free article] [PubMed] [Google Scholar]
- 72.Bolin CM, Basha R, Cox D, Zawia NH, Maloney B, Lahiri DK, Cardozo-Pelaez F. Exposure to lead and the developmental origin of oxidative DNA damage in the aging brain. FASEB J. 2006;20(6):788–90. doi: 10.1096/fj.05-5091fje. [DOI] [PubMed] [Google Scholar]
- 73.Wu J, Basha MR, Brock B, Cox DP, Cardozo-Pelaez F, McPherson CA, Harry J, Rice DC, Maloney B, Chen D, Lahiri DK, Zawia NH. Alzheimer's disease (AD)-like pathology in aged monkeys after infantile exposure to environmental metal lead (Pb): evidence for a developmental origin and environmental link for AD. J Neurosci. 2008;28(1):3–9. doi: 10.1523/JNEUROSCI.4405-07.2008. [DOI] [PMC free article] [PubMed] [Google Scholar]
- 74.Slooter AJ, de Knijff P, Hofman A, Cruts M, Breteler MM, Van Broeckhoven C, Havekes LM, van Duijn CM. Serum apolipoprotein E level is not increased in Alzheimer's disease: the Rotterdam study. Neurosci Lett. 1998;248(1):21–4. doi: 10.1016/s0304-3940(98)00339-5. [DOI] [PubMed] [Google Scholar]
- 75.Panza F, D'Introno A, Colacicco AM, Capurso C, Pichichero G, Capurso SA, Capurso A, Solfrizzi V. Lipid metabolism in cognitive decline and dementia. Brain Res Rev. 2006;51(2):275–92. doi: 10.1016/j.brainresrev.2005.11.007. [DOI] [PubMed] [Google Scholar]
- 76.Goldberg G, Bruns G, Rits M, Edge M, Kwiatkowski D. Human complement Factor I: Analysis of cDNA-derived Primary Structure and Assignment of Its Gene to Chromosome 4. The Journal of Biological Chemistry. 1987;262(21):10065–10071. [PubMed] [Google Scholar]
- 77.Lachmann P, Muller-Eberhard H. The Demonstration in Human Serum of “Conglutinogen-Activating Factor” and its Effect on the Third Component of Complement. The Journal of Immunology. 1968;100:691–698. [PubMed] [Google Scholar]
- 78.Choi A, Weihe P, Budtz J, Jorgensen P, Salonen J, Tuomainen T, Murata K, Nielsen H, Petersen M, Askham J, Grandjean P. Methylmercury exposure and adverse cardiovascular effects in Faroese whaling men. Environmental Helath Perspectives. 2008;3:367–372. doi: 10.1289/ehp.11608. [DOI] [PMC free article] [PubMed] [Google Scholar]
- 79.Drayna D, Fielding C, Mclean J, Baer B, Castro G, Chen E, Comstock L, Henzel W, Kohr W, Rhee L, Wion K, Lawn R. Cloning and Expression of Human Apolipoprotein D cDNA. The Journal of Biological Chemistry. 1986;261(35):16535–16539. [PubMed] [Google Scholar]
- 80.Nakamura K, Yamagishi S, Matsui T, Yoshida T, Takenaka K, Jinnouchi Y, Yoshida Y, Ueda S, Adachi H, Imaizumi T. Pigment Epithelium-Derived Factor Inhibits Neointimal Hyperplasia after Vascular Injury by Blocking NADPH Oxidase-Mediated Reactive Oxygen Species Generation. The American Journal of Pathology. 2007;170(6):2159–2170. doi: 10.2353/ajpath.2007.060838. [DOI] [PMC free article] [PubMed] [Google Scholar]
- 81.Janszky I, Hallqvist J, Ljung R, Hammar N. Insulin-like growth factor binding protein-1 is a long-term predictor of heart failure in survivors of a first acute myocardial infarction and population controls. [April 12, 2009];International Journal of Cardiology [Online] 2008 September 14;:6. doi: 10.1016/j.ijcard.2008.08.003. http://dx.doi.org/10.1016/j.ijcard.2008.08.003. [DOI] [PubMed]
- 82.Engstrom G, Hedblad B, Tyden P, Lindgarde F. Inflammation-sensitive plasma proteins are associated with increased incidence of heart failure: A population-based cohort study. Atherosclerosis. 2009;202:617–622. doi: 10.1016/j.atherosclerosis.2008.05.038. [DOI] [PubMed] [Google Scholar]
- 83.Engstrom G, Hedblad B, Janzon L, Lindgarde F. Long-Term Change in Cholesterol in Relation to Inflammation-Sensitive Plasma Proteins: A longitudinal Study. Ann Epidemiol. 2007;17:57–63. doi: 10.1016/j.annepidem.2006.03.005. [DOI] [PubMed] [Google Scholar]
- 84.Ebana Y, Ozaki K, Inoue K, Sato H, Iida A, Lwin H, Saito S, Mizuno H, Takahashi A, Nakamura T, Miyamoto Y, Ikegawa S, Odashiro K, Nobuyoshi M, Kamatani N, Hori M, Isobe M, Nakamura Y, Tanaka T. A functional SNP in ITIH3 is associated with susceptibility to myocardial infarction. Journal of human genetics. 2007;52(3):220–229. doi: 10.1007/s10038-006-0102-5. [DOI] [PubMed] [Google Scholar]
- 85.Bucki R, Levental I, Kulakowska A, Janmey P. Plasma gelsolin: function, prognostic value, and potential therapeutic use. Current protein & peptide science. 2008;9(6):541–551. doi: 10.2174/138920308786733912. [DOI] [PubMed] [Google Scholar]
- 86.Li G, Shi Y, Chen Y, Sun M, Sader S, Maekawa Y, Arab S, Dawood F, Chen M, De Couto G, Liu Y, Fukuoka M, Yang S, Da Shi M, Kirshenbaum L, McCulloch C, Liu P. Gelsolin Regulates Cardiac Remodeling After Myocardial Infarction Through DNase I-Mediated Apoptosis. [April 13, 2009];Circul Res [Online] 2009 February 26; doi: 10.1161/CIRCRESAHA.108.172882. [DOI] [PubMed] [Google Scholar]
- 87.Rathinavel A, Dhandapany P, Annapoorani P, Ramasamy S, Selvam G. Cardiac idoform of alpha-2 macroglobulin as a novel diagnostic marker for cardiac diseases. European Journal of Cardiovascular Prevention and Rehabilitation. 2005;12(6):601–603. doi: 10.1097/01.hjr.0000176513.07037.83. [DOI] [PubMed] [Google Scholar]
- 88.Kakkar P, Jaffery F. Biological markers for metal toxicity. Environmental Toxicology and Pharmacology. 2005;19:335–349. doi: 10.1016/j.etap.2004.09.003. [DOI] [PubMed] [Google Scholar]
- 89.Navas-Acien A, Guallar E, Silbergeld E, Rothenberg S. Lead Exposure and Cardiovascular Disease - A Systematic Review. Environmental Health Perspectives. 2007;115(3):472–484. doi: 10.1289/ehp.9785. [DOI] [PMC free article] [PubMed] [Google Scholar]
Associated Data
This section collects any data citations, data availability statements, or supplementary materials included in this article.