Abstract
We have developed a microfluidic method for measuring the fluid pressure head experienced at any location inside a microchannel. The principal component is a microfabricated sealed chamber with a single inlet and no exit; the entrance to the single inlet is positioned at the location where pressure is to be measured. The pressure measurement is then based on monitoring the movement of a liquid–air interface as it compresses air trapped inside the microfabricated sealed chamber and calculating the pressure using the ideal gas law. The method has been used to measure the pressure of the air stream and continuous liquid flow inside microfluidic channels (d ~ 50 μm). Further, a pressure drop has also been measured using multiple microfabricated sealed chambers. For air pressure, a resolution of 700 Pa within a full-scale range of 700–100 kPa was obtained. For liquids, pressure drops as low as 70 Pa were obtained in an operating range from 70 Pa to 10 kPa. Since the method primarily uses a microfluidic sealed chamber, it does not require additional fabrication steps and may easily be incorporated in several lab-on-a-chip fluidic applications for laminar as well as turbulent flow conditions.
Introduction
Accurate measurement of pressure in liquid and gas flow systems is important for several engineering applications. In particular, measuring pressure inside microfluidic systems is challenging due to the small available footprint and the difficulty of integrating an additional pressure sensing functionality. As a result, most current microfluidic pressure measurements are obtained using pressure meters located outside the microfluidic device.1 Different methods that measure pressure drop directly inside the microchannel have also been developed—most of these are mechanical (i.e., using moving parts) in nature although some non-mechanical methods have also been proposed. A non-mechanical method is discussed in Groisman et al. where the pressure drop of an unknown liquid stream is measured using an adjacent liquid stream of known pressure drop.2 Abkarian et al. the measured dynamic pressure drop by monitoring the position of the interface of the test sample and the liquid from the comparator channel.3 The mechanical methods, on the other hand, primarily use a membrane that deflects as a function of the applied pressure.4,5 The amount of membrane deflection and, therefore, applied pressure is then interpreted through a system of piezo-resistive, capacitive or optical sensing. While these mechanical methods are accurate, they typically require additional fabrication and signal processing for operation.
We demonstrate a pressure sensing system that does not require any additional fabrication steps and can measure in-situ the static pressure head at any desired location within a microfluidic device. The method presented is independent of the substrate of the microdevice as well as of the physical and chemical properties of the fluid used and has similarities with the storm weather glasses used in the 1700s. The pressure sensing system is manufactured using standard photolitho-graphic methods, is easy to fabricate, and measures both air and liquid pressure.
Theory
Pressure measurement
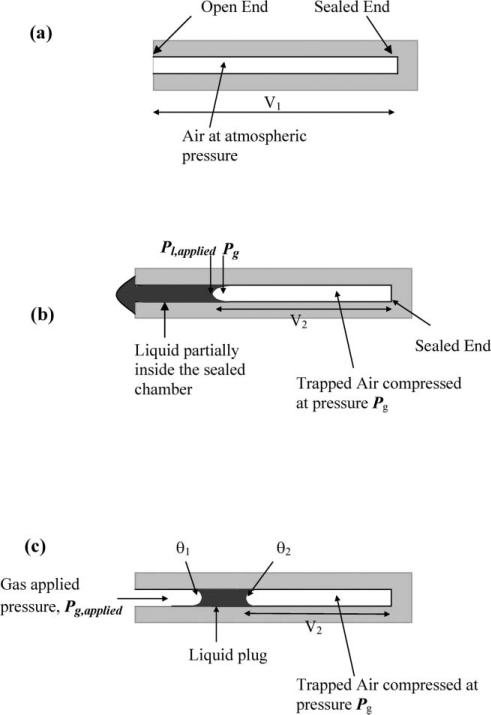
The ideal gas law for air at constant temperature (T) and constant number of moles (n) confined inside a sealed chamber is used to calculate the applied air or liquid pressure (Pg,applied or Pl,applied). Initially, air at atmospheric pressure (Patm) is contained inside a sealed chamber of known volume (V1) which has an inlet channel but no exit (Fig. 1(a)). When liquid under pressure is applied to the entrance of the sealed chamber some liquid is forced into the sealed chamber, thus compressing the air inside. As the liquid moves inside the chamber, no air from the sealed chamber escapes and therefore the assumption of a constant number of moles of air (n) holds. At the equilibrium position of the liquid inside the chamber, the air pressure inside the sealed chamber (Pg) can be calculated using the ideal gas law. At constant T and n, the air pressure inside the sealed chamber is
| (1) |
Fig. 1.
Schematic of pressure measurement using trapped air compression (top view). (a) Before pressure is applied. (b) Liquid pressure measurements. (c) Air pressure measurements.
In this expression, V1 is the original volume of air inside the sealed chamber known from design and fabrication and V2 is the compressed volume of air trapped inside the sealed chamber. V2 is found from the position of the equilibrium air–liquid interface inside the chamber, as shown in Fig. 1(b) and (c).
Pressure measurement in liquids
Fig. 1(b) shows the schematic for liquid pressure measurements. Once the pressure of the air trapped inside the sealed chamber, Pg, is known from eqn (1), the external pressure applied to the liquid Pl,applied can be calculated. The capillary pressure drop that occurs across the liquid–air interface must be accounted for in the pressure calculation6 and Pl,applied is thus given as follows.
| (2) |
Pcapillary is given from a variant of the Young–Laplace equation:5
| (3) |
where σ is the surface tension of the liquid, w and d are the width and depth of the channel and θ is the contact angle of the liquid. The contact angle in eqn (3) may be advancing (θ = θa) or receding (θ = θr), depending on whether the applied pressure is increasing or decreasing.
Pressure measurement in gases
Fig. 1(c) shows the schematic for pressure measurements in gas flows. The externally applied gas pressure, Pg,applied, is measured from the movement of a trapped liquid plug inside the sealed chamber. In liquid pressure measurements, a part of the liquid from the main flow channel moves into the sealed chamber and has one air–liquid interface inside the chamber. In gas pressure measurement, however, a small liquid plug is entirely trapped inside the sealed chamber and has two air–liquid interfaces inside the chamber. Pg,applied can be found from first calculating Pg from eqn (1) and then compensating for the capillary pressure drop at both the interfaces using eqn (3). We finally obtain the following expression for Pg,applied.
| (4) |
Note that when the liquid plug is moving into the chamber, i.e., for increasing gas pressures, the advancing contact angle (θ1 = θa) exceeds the receding contact angle (θ2 = θr), creating an additional resistance to liquid plug motion, and is referred to as contact angle hysteresis. However, for decreasing gas pressure the liquid plug retreats back on a wetted surface in which case there is no capillary force at all and thus the second term in (4) vanishes.
Materials and methods
Device fabrication
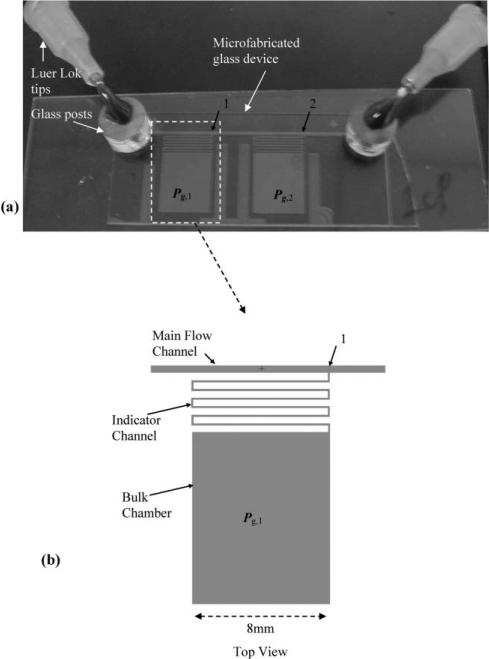
The devices used in the current study are fabricated from borofloat glass using standard photolithography and wet etching procedures, as described elsewhere.9 The glass side with etched microchannels is glued, with a UV curing adhesive, to a piece of cover slide with 1.5 mm holes (Fig. 2). The holes are drilled on the cover slide using a diamond drill bit with a Dremel tool at 30 000 rpm. The device is connected to the syringe pump using 5 mm tall glass capillary posts (id ~ 1.5 mm, od ~ 5 mm) which are glued on top of the holes. Luer lock tips (EFD Inc, East Providence, RI) were epoxied to the glass capillary posts and connected via tubing (PTFE) to a syringe pump (PHD 2000 programmable, Harvard Apparatus, Boston, MA).
Fig. 2.
The microfabricated liquid pressure head and pressure drop sensing system. (a) The device contains two sealed chambers to measure pressure head at points 1 and 2. Part (b) shows the detailed schematic of one sealed chamber jutting out of the main flow channel. Each sealed chamber contains an indicator channel and a bulk chamber.
Experimental set-up
The experiments are conducted on an Olympus SZX12 stereomicroscope and recorded on a videocassette through a color CCD camera. Still frames are captured using iMovie and analyzed in Adobe Photoshop to determine the position of the air–liquid interface.
Results and discussions
Liquid pressure measurements
A microfabricated system for measuring on-chip liquid pressure is shown in Fig. 2. The device contains two sealed chambers attached to a main flow channel (d ~ 50 μm, w ~ 450 μm). Each sealed chamber measures ~4500 nL and is divided between a larger bulk chamber (d ~ 50 μm, w ~ 8 mm, l ~ 10 mm) and a smaller “indicator” channel (d ~ 50 μm, w ~ 150 μm, l ~ 51 mm). The indicator channels, which are serpentine in shape, connect the large bulk chambers to the main flow channel at the points labelled 1 and 2 in Fig. 2 (points 1 and 2 are 10 mm apart). The movement of the liquid–air interface in the indicator channels is finally translated into a pressure measurement.
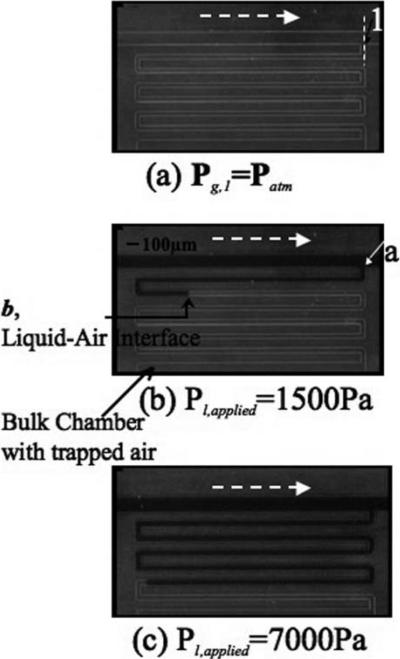
The pressure chambers aid in measuring the pressure head and the pressure drop of a continuous liquid stream flowing in the main flow channel. Each sealed chamber initially contains air at atmospheric pressure (i.e., Pg,1 and Pg,2 initially read atmospheric pressure) as is shown in Fig. 3(a) (only one chamber is shown in the figure). As liquid flows through the main channel, a small amount of liquid spontaneously wicks into the indicator channel (Fig. 3 (b) and (c)) and compresses the air inside the sealed chamber, reducing the volume from V1 to V2. The compressed volume V2 is then used to calculate the pressure at the T-intersection of the main channel and the indicator channel (points 1 and 2) using eqns (1) and (2) and is given below in eqn (5).
| (5) |
Fig. 3.
Liquid pressure measurement: (a)–(c) are snapshots of the pressure head being measured for flow of liquid in the main flow channel. A solution of black dye was used for better visualization. The white dotted arrow indicates the direction of flow.
Since the liquid inside the indicator channel is stagnant, no pressure drop occurs from the T-intersection where liquid in the main channel enters the indicator channel (point “a”) to the leading interface of the liquid inside the indicator channel (point “b”), as shown in Fig. 3(b). Therefore eqn (6) is valid and does not need additional friction-loss terms.
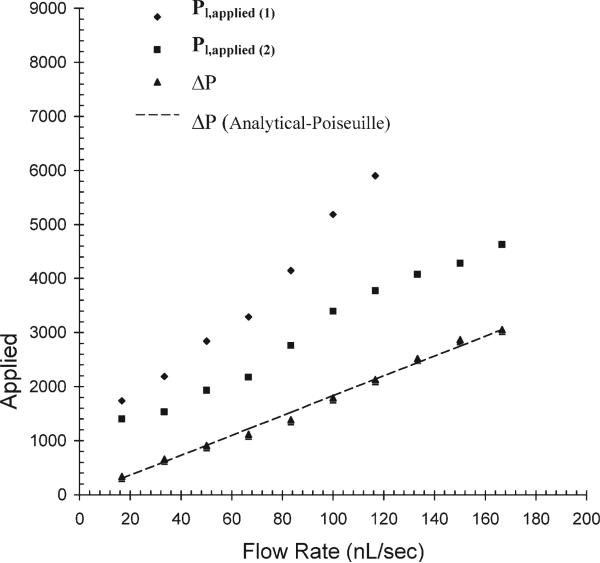
As a demonstration, we have measured the pressure head and pressure drop for a stream of liquid (viscosity standard oil, μ = 8.48 cP, Paragon scientific) in the main flow channel (Fig. 4). The capillary pressure, Pcapillary, may either be calculated using eqn (3) or measured from the zero flow rate conditions9 and then used in eqn (5) to determine the applied pressure. Note that for measuring the pressure drop between any two points, say 1 and 2, the capillary pressure term cancels out. The pressure drop, ΔP, is then calculated directly using eqns (1) and (2) and is given below in eqn (6).
| (6) |
Fig. 4.
Pressure head and pressure drop measurements versus flow rate. The plot shows the measurement of pressure head at points 1 and 2 for a mineral oil (viscosity = 8.48 cP) flowing in the main channel. The pressure drop between 1 and 2 is plotted and fit using the Poiseuille flow equation.
The pressure drop estimated from the Hagen–Poiseuille law is also plotted for comparison. In the current pressure measuring system, the pressure drop in the range from 0 to 4000 Pa was measured with a resolution of 100 Pa.
Gas pressure measurement
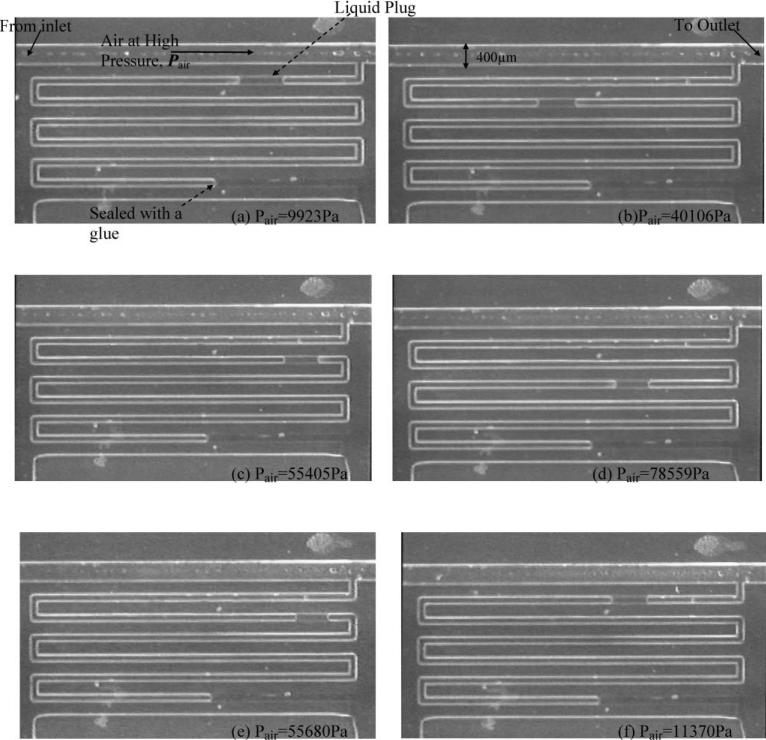
The microfabricated system for measuring air pressure is shown in Fig. 5(a). The total volume of the sealed chamber required for pressure sensing varies as the inverse of the applied pressure. Approximately a 350 nL volume is required for measuring air pressures in the range of 0–100 kPa and therefore only the volume of indicator channel (d ~ 50 μm, w ~ 150 μm, l ~ 46 mm) suffices. As a result, the device for measuring air pressure is essentially the same as that used for liquid pressure measurements except that the bulk chamber is glued and only the indicator channel is used.
Fig. 5.
Measurement of air pressure using a liquid plug trapped inside a sealed chamber: (a)–(d) are for increasing air pressure, i.e., when the liquid plug moves into the sealed channel; (e)–(f) are decreasing air pressure in which case the liquid plug retreats back towards the inlet of the channel. There was no observed hysteresis for advancing and retreating for the experimental conditions tested.
We have used the system shown in Fig. 5 to measure externally applied air pressure Pair from the movement of the trapped liquid plug, in this case water, inside the sealed indicator channel. When air at high pressure Pair is applied, the liquid plug moves forward inside the indicator channel and as a result compresses the air trapped inside. On average, the liquid plug moves 100 μm forward for every additional 700 Pa of applied pressure. The position of the air–liquid interface of the liquid plug is used to measure the volume of air trapped inside the sealed channel, V2, and therefore the pressure of the trapped air, Pg using eqn (1). Pair is then calculated from Pg using eqn (4). Since, for increasing pressure, the advancing (θ1 = θa) and receding (θ2 = θr) contact angles may be hard to obtain or measure for every system, either the second term on the right hand side of eqn (4) must be neglected, with some loss in accuracy (estimated to be between 2 and 10%), or alternatively a single point calibration used to measure the second term. In single point calibration, first compressed air at a known pressure Pair,0 is applied to the chamber and the trapped air pressure, Pg,0, is measured using eqn (1). The difference in Pair,0 and Pg,0 is used as the second term in eqn (4) in further measurements of increasing pressure. With a single point calibration, the pressure contribution due to contact angle hysteresis was found to be 1800 Pa and was used for the second term in eqn (4). The current design of sealed indicator channel can measure pressure ranging from 0 to 100 kPa with a resolution of 700 Pa.
Conclusions
We have presented a method to measure pressure inside a microfluidic channel that would have applicability to several lab-on-a-chip applications such as microfluidic rheometry. The same pressure sensing system works for both air and liquid flow and may also be automated using a liquid detection scheme.10 While the above-described method works well, care has been taken to ensure that no bubbles are trapped inside the indicator, especially while making the external plumbing connections. In addition, evaporation of the trapped liquid plug may lead to erroneous pressure reading and the method may not be applicable to permeable substrates such as PDMS.
The pressure sensing method may be used to determine the volumetric flow rate of a liquid stream by measuring the pressure drop between two locations separated by a known distance. Laminar flows inside a microfluidic channel at low Reynolds number can be approximated using the Hagen–Poiseuille flow equation
| (7) |
where Q is the volumetric flow rate, d and w are the depth and width of the channel, L is the distance between the two points across which the pressure drop occurs, μ is the liquid viscosity, ΔP is the pressure between the two points and S is a constant specific to channel geometry. Typically, the channel dimensions d, w, μ and L are known and hence, by measuring ΔP using eqn (1), the mean volumetric flow rate can be measured.
Acknowledgements
The authors would like to acknowledge support from NIH through grants P01 HG01984 and R01 AI49541 and the University of Michigan Rackham pre-doctoral fellowship.
References
- 1.Dongshin K, Naomi CC, Beebe DJ. Lab Chip. 2006;6:639–644. doi: 10.1039/b517054k. [DOI] [PubMed] [Google Scholar]
- 2.Groisman A, Enzelberger M, Quake SR. Science. 2003;300:955. doi: 10.1126/science.1083694. [DOI] [PubMed] [Google Scholar]
- 3.Abkarian M, Faivre M, Stone HA. Proc. Natl Acad. Sci. U. S. A. 2006;103:538. doi: 10.1073/pnas.0507171102. [DOI] [PMC free article] [PubMed] [Google Scholar]
- 4.Baviere R, Ayela F, le Person S, Favre-Marinet M. Phys. Fluids. 2005;17:098105. [Google Scholar]
- 5.Kohl MJ, Abdel-Kahlik SI, Jeter SM, Sadowski DL. Sens. Actuators, A. 2005;118:212–221. [Google Scholar]
- 6.Adamson AW. Physical Chemistry of Surfaces. Wiley; New York: 1990. [Google Scholar]
- 7.Bird RB, Stewart WE, Lightfoot EN. Transport Phenomena. 2nd edn Wiley; New York: 1994. [Google Scholar]
- 8.Perry RH, Green DW. Perry's Chemical Engineers’ Handbook. 6th edn McGraw-Hill; 1984. [Google Scholar]
- 9.Srivastava N, Davenport RD, Burns MA. Anal. Chem. 2005;77:383–392. doi: 10.1021/ac0494681. [DOI] [PubMed] [Google Scholar]
- 10.Srivastava N, Burns MA. Lab Chip. 2006;6:744–751. doi: 10.1039/b516317j. [DOI] [PMC free article] [PubMed] [Google Scholar]


