Abstract
Purpose
To investigate the relationship between temporal resolution of dynamic contrast-enhanced (DCE) magnetic resonance imaging (MRI) and classification of breast lesions as benign versus malignant.
Materials and Methods
Patients underwent T1-weighted DCE MRI with 15 second/acquisition temporal resolution using 1.5T (n=48) and 3.0T (n=33) MRI scanners. 79 patients had pathologically proven diagnosis and 2 had two years follow up showing no change in lesion size. The temporal resolution of DCE MRI was systematically reduced as a post processing step from 15 to 30, 45, and 60 second/acquisition by eliminating intermediate time points. Average wash-in and wash-out slopes; wash-out percentage changes; and kinetic curve shape (persistently-enhancing, plateau, or wash-out) were compared for each temporal resolution. Logistic regression and receiver operating characteristic (ROC) analysis were used to compare kinetic parameters and diagnostic accuracy.
Results
Sixty patients (74%) had malignant lesions and 21 patients (26%) had benign lesions. All temporal resolution parameters significantly predicted benign versus malignant diagnosis (p <0.05). However, 45 sec/acquisition and higher temporal resolution datasets showed higher accuracy than the 60 sec/acquisition dataset by ROC curve analysis (0.72 versus 0.69 for average wash-in slope; 0.85 versus 0.82, for average washout slope; and 0.88 versus 0.80 for kinetic curve shape assessment, for 45 sec/acquisition versus 60 sec/ acquisition temporal resolution datasets respectively (P =0.027).
Conclusion
DCE MRI data with at least 45 second temporal resolution maximized the agreement between the kinetic parameters and correct classification of benign versus malignant diagnosis.
Keywords: Dynamic contrast enhanced (DCE), Magnetic resonance imaging (MRI), breast, kinetic curve, temporal resolution, wash-out, wash-in
Introduction
Contrast-enhanced (CE) magnetic-resonance imaging (MRI) has proven to be an important tool in detecting and characterizing breast lesions with a sensitivity greater than 90% but widely varying specificity ranging from 30 to 84% (2-5). Dynamic contrast-enhanced (DCE) MRI has been shown to improve the specificity of MRI in the diagnosis of breast cancer (6). The most widely described features of the DCE MRI analysis is the uptake and wash-out patterns of the gadolinium contrast agent in regions of suspected abnormalities. These patterns are typically qualitatively classified as: 1) persistently-enhancing type suggestive of benignity; 2) wash-out type suggestive of malignancy; and 3) plateau type representing an intermediate probability. Wash-in characteristics have also been related to malignant versus benign histology, depending on the slope of the uptake curve (7). However, DCE MRI breast protocols can vary in temporal resolution and there is a need to define the optimal limit that is required for correct classification and diagnosis of lesions.
Current MRI scanners and newest pulse sequences can rapidly image the entire breast in 15 sec or less. However, this high temporal resolution is at the expense of reduced spatial-resolution and/or signal-to-noise ratio that are important for morphologic assessment of the suspicious breast lesion. To date, it is unclear if high temporal resolution provides additional information compared to higher spatial-resolution but lower temporal acquisition protocols (8-12). The purpose of this study was to investigate the optimal limits of temporal resolution from DCE MRI needed for correct classification of breast lesions compared to pathologic findings of benign versus malignant lesions.
Materials and Methods
Clinical Subjects
Retrospective evaluation of 500 consecutive breast MRI exams performed from January to November 2007 was performed. Patients were included if they had breast lesions at least 1 cm in diameter that had pathologically proven diagnosis (only two of our cases had two years follow up MRI examination that confirmed stability as a proof of benignity of the lesions). The institutional review board approved this HIPAA-compliant study.
All patients were scanned either on a 1.5T (48 patients) or a 3T (33 patients) clinical MRI system (1.5T Intera and 3T Achieva Philips Medical Systems, Best, The Netherlands)) using a bilateral, dedicated, 4-channel phased array breast coil (Invivo, Orlando, FL) in prone position. The MRI protocol included 2 minutes of high temporal resolution (15 sec per acquisition) imaging to capture the wash-in phase of contrast enhancement (Table 1). A high spatial-resolution scan for 2 minutes then followed, with additional high temporal resolution images (15 sec per acquisition) for an additional 2 minutes to characterize the wash-out slope of the kinetic curve. Both the high temporal- and high spatial-resolution acquisition sequences were three dimensional (3D) gradient echo sequence with fat suppression acquired in the transverse plane (parameter details are shown in table 1).
Table 1.
High temporal- versus high spatial-resolution MRI protocol parameters
| High temporal resolution | High spatial-resolution | |
|---|---|---|
| Orientation | Axial | Axial |
| Slice Thickness | 5 mm | 2.5 mm |
| Number of slices | 63 | 125 |
| Field of View FOV (cm) | 35 × 35 | 35 × 35 |
| Acquisition matrix | 256 × 254 | 512 × 512 |
| Fat suppression | SPAIR | SPAIR |
| Repetition Time TR (ms) | 3.38-3.8 | 7.08 |
| Echo Time TE (ms) | 1.69-1.97 | 3.56 |
| Flip angle | 10° | 10° |
| Acquisition time | 15 sec | 2 min. |
MRI Data Analysis
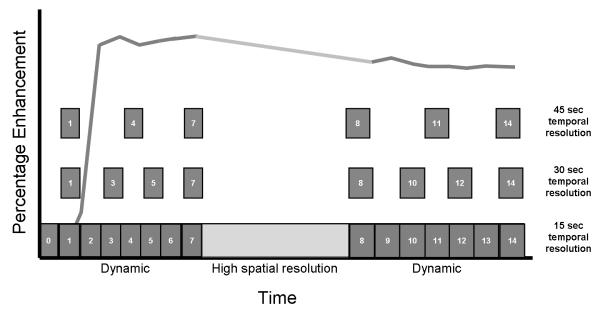
Lesions were detected based on the post-contrast high spatial-resolution images and the corresponding subtraction images along with the high temporal resolution images. Then, post-processing of the high temporal resolution DCE 6 MRI images was performed with computer-aided detection (CAD) software (iCAD Inc., Ohio, USA) based on visual analysis of color maps. The CAD systems uses a four compartment, modified Tofts model (13), for determining uptake and wash-out parameters and outputs a color map (blue, green, and red) of the breast lesion. The red area corresponds to the most suspicious part of a focal breast lesion showing the highest degree of wash-in enhancement, as well as the worst wash-out. The kinetic curve data (percentage enhancement and corresponding time points) of the 15 sec dataset were extracted from the CAD software and copied to external Excel spreadsheets (Microsoft, Redmond, WA) to generate new kinetic curves with 30, 45, and 60 sec by omission of intermediate data points (Figure 1).
Figure 1.
Data analysis method used for systematically reducing temporal resolution. The bottom line shows the 15 second temporal resolution dynamic acquisition (with the high spatial-resolution sequence in the middle). The temporal resolution data acquired at 15 second intervals was systematically reduced to 30, 45, and 60 second as shown (60 second data was similarly done but not shown in the graph).
The average wash-in slope, calculated as the slope of the line between the first time point (pre-contrast TP) and the peak enhancement within the first two minutes, and the average washout slope (from peak enhancement to the last data acquisition point) were calculated as:
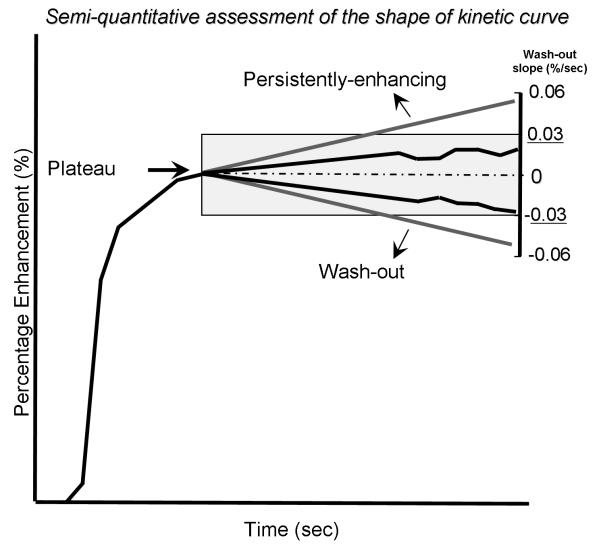
The average wash-out slope was also categorized (Figure 2) as persistently enhancing, plateau, or wash-out based on cut-off points: In order to optimize the diagnostic performance of each of these categories, we tested multiple cutoff points for each parameter individually and selected the cutoff point that resulted in maximizing the accuracy as demonstrated by the highest area under receiver operating characteristic ROC curve (AUC) value. (see Statistical Analysis, below). Finally, the absolute percentage wash-out change was also calculated by subtracting the last time point percentage enhancement from the peak percentage enhancement in each dataset. The final diagnosis was determined by pathology (79 patients) or follow up examination over 2 years showing stable or decreased lesion size (2 patients).
Figure 2.
Method used in this study for kinetic curve shape determination by categorizing the average wash-out slopes. Peak enhancement was considered the reference point (dotted line). Kinetic curves with average wash-out slopes between +0.03%/sec and −0.03%/sec were considered plateau (highlighted grey area). Kinetic curves with average wash-out slopes <−0.03%/sec were considered wash-out. Kinetic curves with average wash-out slopes >0.03%/sec percent/second were considered persistently enhancing.
Statistical Analysis
Multivariable logistic regression was used to determine associations between the tested variables and the diagnosis with and without adjustment for MRI field strength. Receiver operating characteristic (ROC) curve analysis was performed to assess the diagnostic accuracy of each parameter at each temporal resolution. The area under the ROC curve (AUC) results were considered excellent for AUC values between 0.9-1, good for AUC values between 0.8-0.9, fair for AUC values between 0.7-0.8, poor for AUC values between 0.6-0.7 and failed for AUC values between 0.5-0.6.(15-17) Different cutoff points (4-6) for each parameter in each temporal resolution data were tested to categorize the data as benign or malignant. The optimum cutoff point was defined as that which maximized the AUC value. All p-values given represents corrected p-values according to Bonferroni corrections (Bonferroni corrections are employed to reduce Type I errors when multiple tests or comparisons are conducted (18). Bonferroni corrected p-values <0.05 was considered significant. All analyses were performed using STATA statistical software (Version 9.0, College Station, TX).
Results
The patient population included 81 female patients with mean age of 50 ±10 years (range, 24-73 years). Sixty patients (74%) had malignant lesions (26 infiltrating ductal carcinoma, 19 mixed in-situ and infiltrating ductal carcinoma, 6 pure ductal carcinoma in-situ (DCIS), 5 infiltrating lobular carcinoma, and 4 miscellaneous) and 21 (26%) patients had benign lesions (13 fibroadenomas, 2 papillomas, 2 fibrocystic changes, 1 atypical ductal hyperplasia, and 3 benign breast tissue, fibrosis, and adenosis). All patients had a single mass except one with multicentric DCIS.
Dynamic contrast enhanced MRI
Average wash-in slope
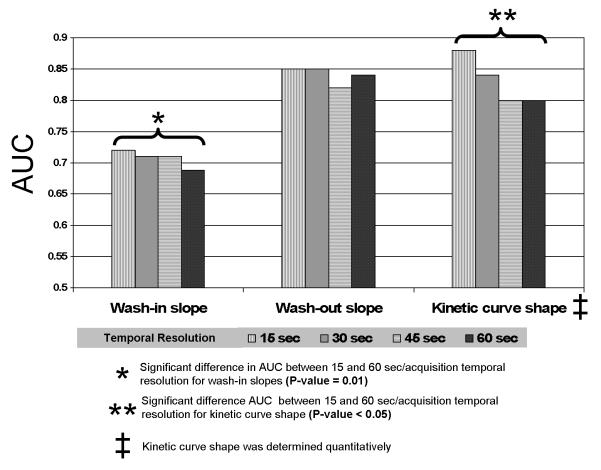
There was a significant association between wash-in slope of the kinetic curve for all temporal resolutions (15, 30, 45, and 60 sec) and the final diagnosis of benign versus malignant breast (p<0.05). The AUC value for the average wash-in slope of the 15 sec curve was significantly higher than that of the 60 sec curve (0.72 versus 0.69, respectively, p = 0.027) (Figure 3). Using 2.2 %/sec as a cutoff point, the 45 sec/acquisition temporal resolution dataset showed the best AUC value (0.73) indicating fair agreement with the final diagnosis while 60 sec/acquisition temporal resolution dataset showed lower AUC value of 0.67.
Figure 3.
Comparison between AUC values for the four tested temporal resolution datasets for average wash-in and wash-out slopes and kinetic curve shape. There is a trend of higher AUC values for higher temporal resolutions. The 15 second/acquisition temporal resolution dataset showed significantly greater AUC value than 60 second/acquisition temporal resolution dataset for both wash-in slope kinetic curve shape.
Average wash-out slope
There was a significant (p<0.05) association between the wash-out slope of the kinetic curve for all temporal resolutions (15, 30, 45, and 60 sec) and the final diagnosis of benign versus malignant. In addition, similar results were noted with the AUC values for the wash-out slopes (0.82-0.85) for all temporal resolutions, respectively indicating good agreement with the final diagnosis of benign or malignant (Figure 3).
Using 0 percent/sec as a cutoff (i.e., no change in percentage enhancement from the early peak enhancement to the last time point), the 15 sec temporal resolution dataset showed the best AUC value (0.82) indicating good agreement with the final diagnosis while 60 sec/acquisition temporal resolution dataset had a lower AUC value (0.78).
We also examined the percentage change in enhancement between the early peak enhancement and the last time point of the kinetic curve for the four temporal resolution datasets. This data showed the same trend as the average wash-out slopes with the maximum AUC value shown for the 15 sec temporal resolution dataset (AUC=0.84) (comparison data was not shown).
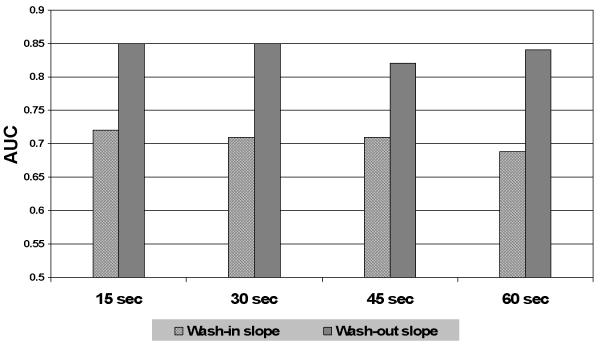
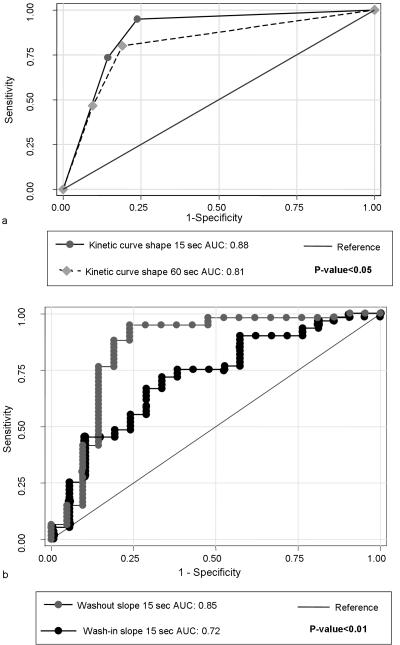
At all temporal resolutions, the average wash-out slopes showed a significantly greater association with the final diagnosis of benign or malignant compared to the average wash-in slope (p<0.01) (Figures 4, 5b).
Figure 4.
Comparison between AUC values for the wash-in and wash-out slopes for each temporal resolution dataset. AUC values of the wash-out slope were found to be significantly higher than the AUC values of the wash-in slope for all temporal resolution datasets.
Figure 5.
ROC curve comparisons between 15 and 60 sec/acquisition temporal resolution datasets. A) Kinetic curve shape was classified based on a 0.03%/sec cut-off to define persistently enhancing, plateau and washout regions as shown in Figure 2. The AUC for the 15 second temporal resolution dataset was greater than that for the 60 second dataset (p < 0.05). B) The average wash-out slope (grey line) showed significantly higher diagnostic performance demonstrated by greater AUC value than the average wash-in slope (black line) (p<0.01).
Wash-out curve categories
AUC values were maximized for kinetic curve shape (persistently-enhancing, plateau, wash-out) at all temporal resolutions by defining a wash-out slope between −0.03%/sec and +0.03%/sec as plateau, a slope of more than +0.03%/sec as persistently-enhancing, and a slope of less than −0.03%/sec as wash-out (0,03%/sec corresponds to a 3.8% percentage change over a 2 minute interval).
There was a significant association between the shape of the kinetic curve and benign versus malignant diagnosis for all temporal resolutions (p <0.001). The wash-out slope of the 15 sec temporal resolution dataset showed the best AUC value (0.88) indicating good agreement with the final diagnosis. The AUC value for the 15 sec temporal resolution dataset was significantly higher than the AUC value for the 60 sec data (AUC=0.8) (p<0.05) (Figure 5).
The above analyses were repeated after adjustment for field strength in the regression models. There was no significant difference in the described associations.
Discussion
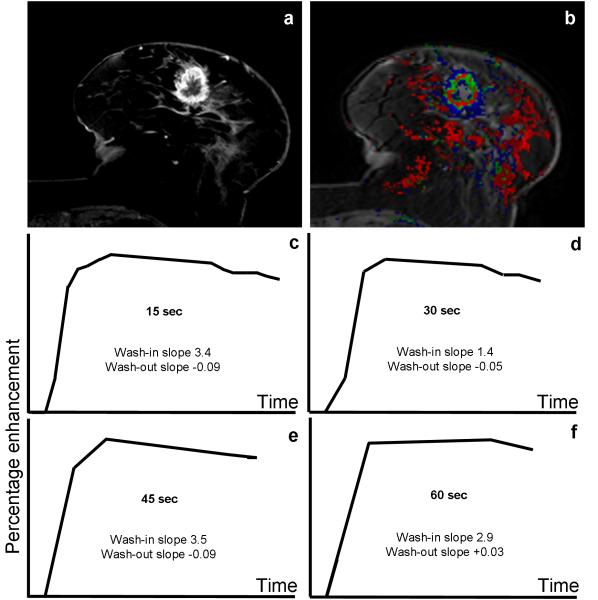
Increased temporal resolution for DCE MRI of the breast has the potential to provide improved characterization of the kinetic curve, but this is at the expense of higher noise levels and lowered SNR. At all temporal resolutions we examined (15, 30, 45, and 60 seconds), there were significant associations between each of the DCE MRI kinetic parameters (average wash-in and wash-out slopes, wash-out percentage changes, and shape of the kinetic curve) and the final diagnosis of benign versus malignant. In particular, using the average wash-in slope, the 15 sec/acquisition data exhibited significantly higher accuracy than DCE MRI data acquired with a lower temporal resolution of 60 sec (Figure 3). In general, DCE MRI datasets with at least 45 sec/acquisition trended towards higher AUC values (an example is shown in Figure 6).
Figure 6.
DCE MRI of 77 year-old female with a history of right breast cancer treated with conservative breast surgery, presented with a new left breast mass. a) High spatial-resolution subtraction image showing a spiculated, rim-enhancing mass lesion at the 6 O’clock position of the Lt. breast. b) A color map of the corresponding 15 sec/acquisition temporal resolution dynamic series showing the lesion exhibiting green and red colors (denoting intermediate and high levels of suspicion for malignancy). C-F) Kinetic curves for different temporal resolution datasets for the lesion. The kinetic curve shape was washout (type III) for the 15, 30 and 45 second/acquisition acquisition data, but was plateau (type II) for the 60 second/acquisition temporal resolution data. Histo-pathologic examination of the lesion revealed infiltrating ductal carcinoma with foci of DCIS.
The clinical utility of DCE MRI of the bsreast in the detection of breast lesions has directed efforts towards developing more quantitative analytic techniques for its assessment. Adding the information extracted from the time intensity curve to the morphological features of the lesion may improve the characterization of breast MRI for malignancy. The optimal temporal resolution for DCE MRI should correlate with improved diagnostic performance of the method.
Prior studies used qualitative assessment to categorize the shape of the kinetic curve (7, 8, 11, 19). Inter-observer agreement ranged from kappa 0.27 (12, 19) to 0.8 (8). In this study, we used a semi-quantitative definition of the kinetic curve shape, which may explain the higher diagnostic performance for DCE MRI that we observed (AUC values 0.8 to 0.88 for the different temporal resolution dataset) when compared to (0.66) achieved by Bluemke et al. (8). Using this approach, the 15 sec/acquisition temporal resolution dataset showed significantly higher AUC value than the 60 sec/acquisition temporal resolution dataset (Figures 3-5).
Other studies have used high temporal resolution sequences (9, 20, 21). Boetes et al used a TurboFLASH sequence with temporal resolution 2-3 sec/acquisition scanning for 2 min after contrast-administration. They considered lesions enhancing within 11.5 sec after aorta opacification as malignant whereas lesions enhancing after 11.5 sec as benign. Using this method, they achieved 95% sensitivity and 86% specificity with an overall accuracy of 93%.
Previously, efforts have aimed to develop a MRI sequence that would strike a tradeoff between spatial and temporal resolution (11, 22-25). Kuhl et al. studied two different temporal resolutions (69 and 116 sec/acquisition) and qualitatively analyzed the morphologic and kinetic features extracted from the same dynamic study (11). They concluded that although using a sequence with higher spatial-resolution at the expense of temporal resolution (reducing it from 69 sec/acquisition to 116 sec/acquisition) led to loss of some kinetic information, loss of this kinetic information was of limited value in tumor characterization. Considering only the kinetic data, our study showed that higher temporal resolution (less than 60 seconds) generally resulted in greater diagnostic performance for DCE MRI of the breast. The improvement in diagnostic performance appeared to improve as temporal resolution improved (Figure 3), but was most marked between the 15 second and 60 second data.
The introduction of more advanced pharmacokinetic (compartmental) modeling techniques and the subsequent development of CAD software led to rapid applications in DCE MRI of the breast (26). These models use MRI signal intensity changes and enhancement versus time after administration of contrast material to extract quantitative information about capillary permeability and leakage spaces of a mass in order to differentiate benign from malignant lesions (13, 27). All studies to date that investigated pharmacokinetic modeling approaches used temporal acquisitions of less than 20 sec/acquisition (13, 26-29). Direct comparisons of the pharmacokinetic models to the semi-quantitative method used in this study have not yet been performed.
A limitation of this study was that we omitted intermediate time points as a way of simulating alteration of temporal resolution. This was done in order to avoid repeat contrast injections in the same patient. The approach we used would tend to have higher noise levels and thus lower SNR than implementation of the actual pulse sequence changes. We also excluded the consideration of morphologic features of the tumors in this particular analysis. Finally, MRI data in this study was acquired both at 1.5T and 3T. Field strength was not found to be a confounder in the multivariable logistic regression analysis.
In conclusion, DCE MRI data with temporal resolution from 15 seconds to 60 seconds per acquisition could discriminate between benign versus malignant categories of breast lesions. Temporal resolution of 45 seconds per acquisition or greater showed higher accuracy in characterizing benign versus malignant lesions. Wash-out curves showed higher accuracy in characterizing breast lesions than did wash-in curves at all temporal resolutions.
Acknowledgments
This research was supported by NIH R01CA125258, NIH 1R01CA100184, P50CA103175 and by the intramural research program of the NIH/Clinical Center.
References
- 1.Sarrazin D, Le MG, Arriagada R, et al. Ten-year results of a randomized trial comparing a conservative treatment to mastectomy in early breast cancer. Radiother Oncol. 1989;14:177–184. doi: 10.1016/0167-8140(89)90165-5. [DOI] [PubMed] [Google Scholar]
- 2.Huang W, Fisher PR, Dulaimy K, Tudorica LA, O’Hea B, Button TM. Detection of breast malignancy: diagnostic MR protocol for improved specificity. Radiology. 2004;232:585–591. doi: 10.1148/radiol.2322030547. [DOI] [PubMed] [Google Scholar]
- 3.Viehweg P, Lampe D, Buchmann J, Heywang-Kobrunner SH. In situ and minimally invasive breast cancer: morphologic and kinetic features on contrast-enhanced MR imaging. Magma. 2000;11:129–137. doi: 10.1007/BF02678476. [DOI] [PubMed] [Google Scholar]
- 4.Heywang-Kobrunner SH, Bick U, Bradley WG, Jr., et al. International investigation of breast MRI: results of a multicentre study (11 sites) concerning diagnostic parameters for contrast-enhanced MRI based on 519 histopathologically correlated lesions. Eur Radiol. 2001;11:531–546. doi: 10.1007/s003300000745. [DOI] [PubMed] [Google Scholar]
- 5.Kutschker C, Allgayer B, Hauck W. [Evaluating the morphology of uncertain breast tumors using color coded Doppler ultrasound] Ultraschall Med. 1996;17:18–22. doi: 10.1055/s-2007-1000448. [DOI] [PubMed] [Google Scholar]
- 6.Kneeshaw PJ, Lowry M, Manton D, Hubbard A, Drew PJ, Turnbull LW. Differentiation of benign from malignant breast disease associated with screening detected microcalcifications using dynamic contrast enhanced magnetic resonance imaging. Breast. 2006;15:29–38. doi: 10.1016/j.breast.2005.05.002. [DOI] [PubMed] [Google Scholar]
- 7.Kuhl CK, Mielcareck P, Klaschik S, et al. Dynamic breast MR imaging: are signal intensity time course data useful for differential diagnosis of enhancing lesions? Radiology. 1999;211:101–110. doi: 10.1148/radiology.211.1.r99ap38101. [DOI] [PubMed] [Google Scholar]
- 8.Bluemke DA, Gatsonis CA, Chen MH, et al. Magnetic resonance imaging of the breast prior to biopsy. Jama. 2004;292:2735–2742. doi: 10.1001/jama.292.22.2735. [DOI] [PubMed] [Google Scholar]
- 9.Boetes C, Barentsz JO, Mus RD, et al. MR characterization of suspicious breast lesions with a gadolinium-enhanced TurboFLASH subtraction technique. Radiology. 1994;193:777–781. doi: 10.1148/radiology.193.3.7972823. [DOI] [PubMed] [Google Scholar]
- 10.Flickinger FW, Allison JD, Sherry RM, Wright JC. Differentiation of benign from malignant breast masses by time-intensity evaluation of contrast enhanced MRI. Magn Reson Imaging. 1993;11:617–620. doi: 10.1016/0730-725x(93)90002-u. [DOI] [PubMed] [Google Scholar]
- 11.Kuhl CK, Schild HH, Morakkabati N. Dynamic bilateral contrast-enhanced MR imaging of the breast: trade-off between spatial and temporal resolution. Radiology. 2005;236:789–800. doi: 10.1148/radiol.2363040811. [DOI] [PubMed] [Google Scholar]
- 12.Stoutjesdijk MJ, Futterer JJ, Boetes C, van Die LE, Jager G, Barentsz JO. Variability in the description of morphologic and contrast enhancement characteristics of breast lesions on magnetic resonance imaging. Invest Radiol. 2005;40:355–362. doi: 10.1097/01.rli.0000163741.16718.3e. [DOI] [PubMed] [Google Scholar]
- 13.Tofts PS, Berkowitz B, Schnall MD. Quantitative analysis of dynamic Gd-DTPA enhancement in breast tumors using a permeability model. Magn Reson Med. 1995;33:564–568. doi: 10.1002/mrm.1910330416. [DOI] [PubMed] [Google Scholar]
- 14.Jansen SA, Newstead GM, Abe H, Shimauchi A, Schmidt RA, Karczmar GS. Pure ductal carcinoma in situ: kinetic and morphologic MR characteristics compared with mammographic appearance and nuclear grade. Radiology. 2007;245:684–691. doi: 10.1148/radiol.2453062061. [DOI] [PubMed] [Google Scholar]
- 15.Ludemann L, Grieger W, Wurm R, Wust P, Zimmer C. Glioma assessment using quantitative blood volume maps generated by T1-weighted dynamic contrast-enhanced magnetic resonance imaging: a receiver operating characteristic study. Acta Radiol. 2006;47:303–310. doi: 10.1080/02841850500539033. [DOI] [PubMed] [Google Scholar]
- 16.Obuchowski NA. Receiver operating characteristic curves and their use in radiology. Radiology. 2003;229:3–8. doi: 10.1148/radiol.2291010898. [DOI] [PubMed] [Google Scholar]
- 17.Metz CE. Basic principles of ROC analysis. Semin Nucl Med. 1978;8:283–298. doi: 10.1016/s0001-2998(78)80014-2. [DOI] [PubMed] [Google Scholar]
- 18.Cabin RJ, Mitchell RJ. To Bonferroni or not to Bonferroni: when and how are the questions. ESA Bull. 2000;81:246–248. [Google Scholar]
- 19.Kinkel K, Helbich TH, Esserman LJ, et al. Dynamic high-spatial-resolution MR imaging of suspicious breast lesions: diagnostic criteria and interobserver variability. AJR Am J Roentgenol. 2000;175:35–43. doi: 10.2214/ajr.175.1.1750035. [DOI] [PubMed] [Google Scholar]
- 20.Schnall MD, Blume J, Bluemke DA, et al. Diagnostic architectural and dynamic features at breast MR imaging: multicenter study. Radiology. 2006;238:42–53. doi: 10.1148/radiol.2381042117. [DOI] [PubMed] [Google Scholar]
- 21.Su MY, Cheung YC, Fruehauf JP, et al. Correlation of dynamic contrast enhancement MRI parameters with microvessel density and VEGF for assessment of angiogenesis in breast cancer. J Magn Reson Imaging. 2003;18:467–477. doi: 10.1002/jmri.10380. [DOI] [PubMed] [Google Scholar]
- 22.Schnall MD, Rosten S, Englander S, Orel SG, Nunes LW. A combined architectural and kinetic interpretation model for breast MR images. Acad Radiol. 2001;8:591–597. doi: 10.1016/S1076-6332(03)80683-9. [DOI] [PubMed] [Google Scholar]
- 23.Nunes LW, Schnall MD, Orel SG. Update of breast MR imaging architectural interpretation model. Radiology. 2001;219:484–494. doi: 10.1148/radiology.219.2.r01ma44484. [DOI] [PubMed] [Google Scholar]
- 24.Nunes LW, Schnall MD, Orel SG, et al. Breast MR imaging: interpretation model. Radiology. 1997;202:833–841. doi: 10.1148/radiology.202.3.9051042. [DOI] [PubMed] [Google Scholar]
- 25.Nunes LW, Schnall MD, Siegelman ES, et al. Diagnostic performance characteristics of architectural features revealed by high spatial-resolution MR imaging of the breast. AJR Am J Roentgenol. 1997;169:409–415. doi: 10.2214/ajr.169.2.9242744. [DOI] [PubMed] [Google Scholar]
- 26.Tofts PS. Modeling tracer kinetics in dynamic Gd-DTPA MR imaging. J Magn Reson Imaging. 1997;7:91–101. doi: 10.1002/jmri.1880070113. [DOI] [PubMed] [Google Scholar]
- 27.Collins DJ, Padhani AR. Dynamic magnetic resonance imaging of tumor perfusion. Approaches and biomedical challenges. IEEE Eng Med Biol Mag. 2004;23:65–83. doi: 10.1109/memb.2004.1360410. [DOI] [PubMed] [Google Scholar]
- 28.Tofts PS, Brix G, Buckley DL, et al. Estimating kinetic parameters from dynamic contrast-enhanced T(1)-weighted MRI of a diffusable tracer: standardized quantities and symbols. J Magn Reson Imaging. 1999;10:223–232. doi: 10.1002/(sici)1522-2586(199909)10:3<223::aid-jmri2>3.0.co;2-s. [DOI] [PubMed] [Google Scholar]
- 29.Dale BM, Jesberger JA, Lewin JS, Hillenbrand CM, Duerk JL. Determining and optimizing the precision of quantitative measurements of perfusion from dynamic contrast enhanced MRI. J Magn Reson Imaging. 2003;18:575–584. doi: 10.1002/jmri.10399. [DOI] [PubMed] [Google Scholar]
- 30.Yankeelov TE, Lepage M, Chakravarthy A, et al. Integration of quantitative DCE-MRI and ADC mapping to monitor treatment response in human breast cancer: initial results. Magn Reson Imaging. 2007;25:1–13. doi: 10.1016/j.mri.2006.09.006. [DOI] [PMC free article] [PubMed] [Google Scholar]


