Abstract
Analysis of protein oxidation is necessary in numerous areas of biochemistry, including hydroxyl radical surface mapping, oxidative stress assays, and pharmaceutical stability testing. Mass spectrometry is one of the tools most often used to identify protein oxidation products, and previous studies have attempted to identify and characterize all of the major oxidation products detected by mass spectrometry for each amino acid residue. In this note, we present evidence that in heavily oxidized protein samples, such as those produced by hydroxyl radical surface mapping, a major oxidation product of methionine is homocysteic acid. The formation of homocysteic acid from methionine was previously unrecognized in other mass spectrometric analyses, and has important implications for the analysis of oxidized samples, as well as potential implications as to the functional consequences of methionine oxidation.
Introduction
Accurate identification and characterization of oxidized amino acid residues has applications in drug processing, oxidative stress assays, and medical studies, including aging, Alzheimer’s disease and alcoholism. Especially challenging identification problems arise in the structural proteomics technique called “oxidative footprinting”, or more precisely “hydroxyl radical surface mapping”. This technique, which is rapidly gaining popularity, deliberately oxidizes an intact protein and then assays the oxidized amino acid residues using the techniques of shotgun proteomics1. A variety of oxidative modifications are commonly observed in hydroxyl radical surface mapping, up to ~50 different modifications, counting each combination of amino acid residue and mass delta as a distinct modification. Substantial effort has gone into compiling lists of oxidative modifications and making them as complete as possible2, in order that tandem mass spectrometry (MS/MS) can give an accurate measurement of oxidized peptide species. However, recent proteomics data sets from several laboratories indicate the presence of a methionine oxidation not previously identified by mass spectrometry.
We regularly analyze difficult proteomics data, including data from oxidized peptides, from a number of laboratories, by running ByOnic3, a prototype database-search tool with some advanced features not found in standard search engines such as Mascot and SEQUEST. One such feature is an option called a “wild-card modification”, which can be enabled along with anticipated fixed and variable modifications. A wild-card modification is nonspecific in both location and mass; ByOnic allows any integer mass change, within a user-specified range, to any one residue in a candidate peptide.
We routinely run at least one wild-card search on every proteomics data set. These searches generally find known but unanticipated modifications, but on five heavily oxidized samples from three different laboratories, these searches turned up ~60 spectra from ~10 distinct peptides for which the best identifications included a methionine modification with a net mass change of plus 34 Daltons. The samples included nominal one-protein samples, deliberately oxidized for hydroxyl radical surface mapping, and also heavily processed (gel and LC) biological samples, inadvertently oxidized during sample preparation.
In order to validate the apparent methionine + 34 Da product and to determine its structure, we oxidized a synthesized tripeptide, Gly-Met-Gly (GMG) and analyzed the oxidation products. We detected an abundant +34 Da modification to the methionine side chain, and we identified the novel modification as homocysteic acid. Homocysteic acid has been previously identified as an oxidation product of methionine in early radiolysis studies4, 5, but has not, to our knowledge, been reported in mass spectrometric analyses of oxidized proteins before.
Materials and Methods
Fmoc-Met-OH, and Fmoc-Gly-NovaSyn TGT were purchased from Novabiochem/EMD Biosciences (Gibbstown, NJ). Coupling reagent 1-H-benzotriazolium-1-[bis(dimethyl-amino)methylene]-5-chloro-hexafluorophosphate (1-),3-oxide (HCTU) and additive 1-hydroxybenzotriazole anhydrous (HOBt) were purchased from Peptides International (Louisville, Kentucky). N,N’-diisopropylethylamine (DIEA), N,N’-dimethylformamide (DMF), trifluoroacetic acid (TFA), dichloromethane (CH2Cl2), methanol, and triisopropylsilane were purchased from Sigma-Aldrich (St Louis, MO). Toluene was purchased from VWR International (West Chester, PA). Acetonitrile was purchased from Fisher Scientific (Fair Lawn, NJ). Hydrogen peroxide and formic acid were purchased from J.T. Baker (Phillipsburg, NJ). Phenol was purchased from MP Biomedicals (Solon, OH). Ultrapure water (18 MΩ) was prepared in-house with a Millipore Mill-Q water purification system (Millipore Bedford, MA).
The tripeptide Gly-Met-Gly (GMG) was synthesized following a protocol similar to that previously described6, 7. Then 100mg TGT resin was placed in a glass vessel (8.5 ml) containing a porous glass frit for manual synthesis. Fmoc removal was achieved with piperidine:DMF (1:4) for 20 min, followed by a 2-h coupling of the amino acid derivative (4 eq), which was mediated by HCTU (4 eq)/HOBt (4 eq)/DIEA (5 eq) in DMF (2 ml) at 25 °C. Washings between reactions were carried out with DMF and CH2Cl2, then DMF again, and no intermediate capping steps were done. After chain assembly was completed and the N-terminal Fmoc group removed, the resin was washed with DMF and CH2Cl2 and dried in a desiccator overnight. The tripeptide resin was then treated with TFA/phenol/H2O/triisopropylsilane (88/5/5/2) for 2 h and washed to recover the peptide, which was used directly following lyophilization.
A 60 μM solution of GMG was prepared in a solution of 147 mM hydrogen peroxide (H2O2) and oxidized by hydroxyl radicals generated by fast photooxidation of proteins (FPOP)8. Briefly, a one-syringe flow system was used with a capillary i.d. of 97 μm and a flow rate of 20 μL/min. As the peptide mixed with hydrogen peroxide flowed through the system, the solution was illuminated with UV light from one pulse of a KrF excimer laser (GAM Laser, Inc., Orlando, FL) at an average laser power of 60 mJ/pulse. Following irradiation, the solution was mixed 50:50 with acetonitile and 0.2% formic acid. As protein folding is not an issue with the tripeptide, no efforts were made to limit the radical lifetime to the sub-microsecond timescale. The oxidized GMG solution was analyzed in positive ion mode via direct infusion by nanoelectrospray using a QTOF 2 mass spectrometer (Waters, Milford, MA) with a capillary voltage of 3.6 kV and a nanospray flow rate of 0.2 μL/min. Negative ion mode mass spectra were obtained using a Thermo LTQ-FT mass spectrometer (Waltham, MA) with a capillary voltage of 2.2 kV and a nanospray flow rate of 0.6 μL/min.
Results
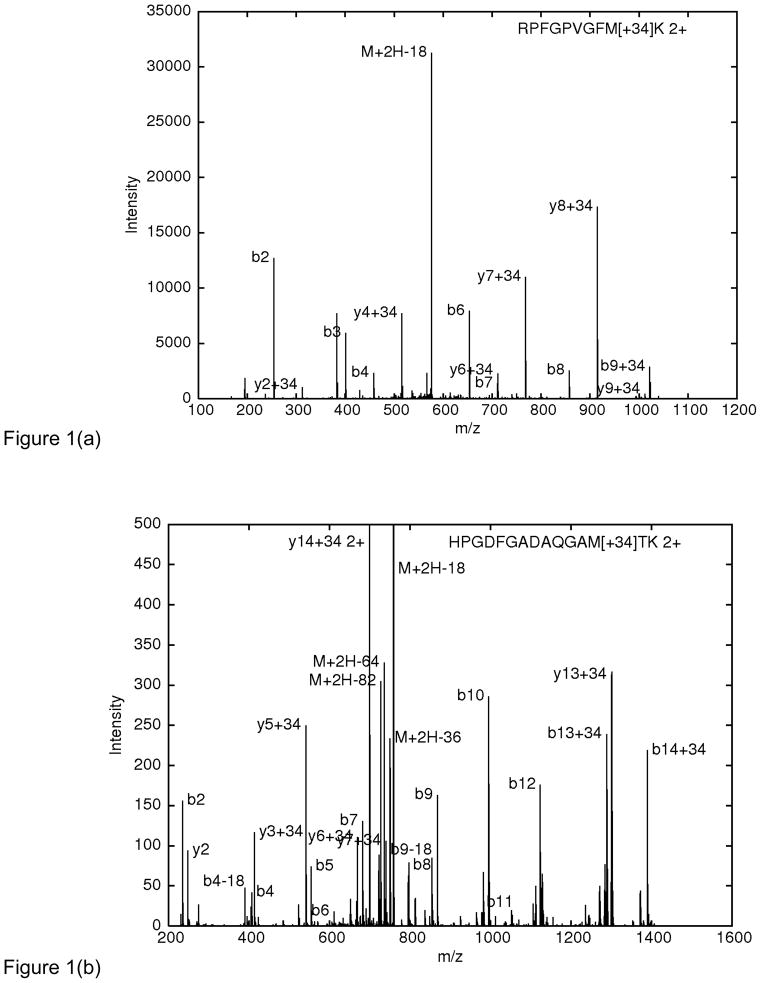
Figure 1 shows annotated spectra of peptides containing methionine plus 34 Daltons, discovered by ByOnic’s wild-card modification option. Figure 1a is from a Cyp3A4 sample from microsomes, in which most methionines are either singly oxidized (methionine sulfoxide) or doubly oxidized (methionine sulfone) in vivo and/or during sample preparation; this spectrum is from Genentech, Inc. (South San Francisco) and is not from a hydroxyl radical surface mapping experiment. Figure 1b is from horse myoglobin, deliberately oxidized for hydroxyl radical surface mapping with hydrogen peroxide and fast photooxidation of proteins (FPOP). This spectrum comes from Oak Ridge National Laboratories.
Figure 1.
(a) MS/MS spectrum (Thermo LTQ Orbitrap) from a Cyp3A4 sample from microsomes, prepared by gel electrophoresis. The precursor mass (M+H), measured by the Orbitrap, is 1169.579 Da. M[+33.969] gives a theoretical precursor mass of 1169.577 Da. Peaks for the intense fragment ions (b2, y2, b3, b4, y4, etc.), measured by the LTQ analyzer, are all within 0.13 Da of their theoretical values. The peptide is a tryptic peptide from cytochrome P450. (b) MS/MS spectrum (Thermo LTQ) from a hydroxyl radical surface mapping experiment on horse myoglobin. Peaks for the intense singly charged ions (b2, y2, b4, y3, etc.) are all within 0.14 Da of their theoretical values. We interpret the peak at 727.5 labeled "M+2H-82" as the precursor with a neutral loss of sulfonic acid.
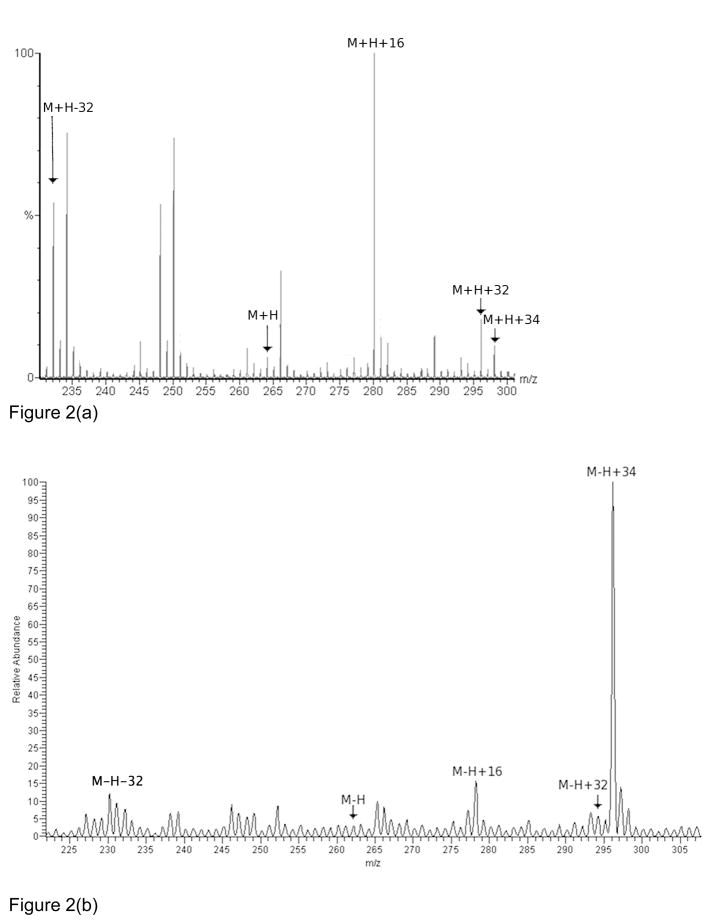
In order to identify the apparent M+34 modification, the tripeptide Gly-Met-Gly (GMG) was synthesized and oxidized by laser flash photolysis of hydrogen peroxide for the purpose of studying the effects of oxidation on the methionine side chain in a peptide context in isolation from other potential side chain oxidation products. This oxidation method produces diffusing hydroxyl radicals, which are the most reactive of the biologically relevant reactive oxygen species and produces many of the same oxidation products as other, less reactive oxygen species. The mass spectrum reveals significant amounts of the sulfoxide (+16), sulfone (+32), and aldehyde (−32) oxidation products9, as well as another uncharacterized product with a +34 Da mass shift, as demonstrated in Figure 2a. Analysis in negative ion mode reveals that the previously uncharacterized +34 Da mass shift has a very large increase in ionization efficiency, and the M+34 product clearly dominates the negative ion mode mass spectrum (Figure 2b). The changes in relative abundance between the positive ion mode and negative ion mode spectra indicate that the +34 Da mass shift oxidation product probably introduces a strongly acidic group to the GMG peptide, and may indicate why this modification was not previously identified as a major oxidation product in positive ion mode mass spectrometry. Upon MS/MS fragmentation of the M+34 product in positive ion mode at moderate collision energies (40 V), the most prominent peak in the tandem mass spectrum occurred at a mass shift of +34 Da from the methionine immonium ion (data not shown), indicating that the +34 mass shift occurs entirely on the methionine side chain, and is not a combination of methionine oxidation and backbone oxidation elsewhere on the peptide.
Figure 2.
(a) Positive ion mode mass spectra of 30μM oxidized Gly-Met-Gly (GMG). (b) Negative ion mode mass spectra of 30μM oxidized GMG.
Spectra with high-accuracy precursor masses (for example, Figure 1a) indicate that the +34 Da shift is more precisely 33.971 ± 0.006 Da (Orbitrap accuracy of ~5 ppm on a precursor mass of ~1200 Da). If we allow a net gain or loss of at most one nitrogen, at most one sulfur, and at most five each for hydrogen, oxygen, and carbon, there are only six possible changes of elemental composition within this mass range (Table 1).
Table 1.
Changes of elemental composition giving a net mass change of 33.971 +/− 0.006 Daltons.
| Mass Delta | H | C | O | N | S |
|---|---|---|---|---|---|
| 33.967 | −2 | +3 | −2 | +1 | |
| 33.969 | −2 | −1 | +3 | ||
| 33.972 | −4 | +2 | +1 | ||
| 33.972 | +2 | −4 | +3 | +1 | |
| 33.974 | −4 | −2 | +5 | +1 | −1 |
| 33.975 | −1 | +1 | +1 |
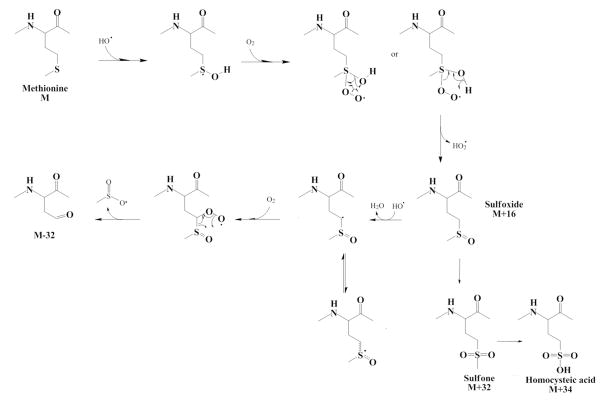
The easiest possibility to realize chemically is the second one: net loss of CH2 and net gain of O3. Altogether the mass spectrometric data are best explained by the loss of the methyl group of methionine with conversion of the thioether to a sulfonic acid to form homocysteic acid. Homocysteic acid has been previously reported as an oxidation product of methionine in studies of the radiolytic degradation of methionine solutions,4 but not previously identified in mass spectrometric analyses of oxidized methionine or hydroxyl radical footprinting reports10. A proposed scheme for the formation of the homocysteic acid product is given in Figure 3. While detailed mechanistic studies are beyond the intended scope of this manuscript, previous work indicates that the homocysteic acid product can be efficiently reached through both methionine sulfoxide and methionine sulfone5. Therefore, the homocysteic acid product probably results from radical attack on the sulfur center of the sulfone product, which leads to scission of the carbon-sulfur bond and formation of the homocysteic acid product, although it is also quite possible that the attack can occur on the sulfoperoxy radical intermediates, given the short lifetime of the hydroxyl radical in solution in the FPOP experiments and the relative stability of the sulfoperoxy radical. The presence of the homocysteic acid oxidation product of methionine may have implications on the biology of systems under oxidative stress, as homocysteic acid has been implicated as an excitatory amino acid in mammalian CNS systems11.
Figure 3.
Proposed scheme for radiolytic oxidation of methionine to homocysteic acid.
Acknowledgments
We thank David Arnott and Carlee McClintock for mass spectra. We thank David Goldberg for writing the delta mass elemental composition calculator. M.B. was supported in part by NIH grant GM085718. JS and JSS acknowledge support for this work from the National Institutes of Health (RR05357) and the University of Georgia Office of the Vice President for Research (RX064-080).
References
- 1.Xu G, Chance MR. Chem Rev. 2007;107:3514–3543. doi: 10.1021/cr0682047. [DOI] [PubMed] [Google Scholar]
- 2.Xu G, Chance MR. Anal Chem. 2005;77:4549–4555. doi: 10.1021/ac050299+. [DOI] [PubMed] [Google Scholar]
- 3.Bern M, Cai Y, Goldberg D. Anal Chem. 2007;79:1393–1400. doi: 10.1021/ac0617013. [DOI] [PubMed] [Google Scholar]
- 4.Kopoldova J, Kolousek J, Babicky A, Liebster J. Nature. 1958;182:1074–1076. doi: 10.1038/1821074a0. [DOI] [PubMed] [Google Scholar]
- 5.Ohara A. J Radiat Res (Tokyo) 1966;7:18–28. doi: 10.1269/jrr.7.18. [DOI] [PubMed] [Google Scholar]
- 6.Liu M, Borgert A, Barany G, Live D. Biopolymers. 2008;90:358–368. doi: 10.1002/bip.20847. [DOI] [PubMed] [Google Scholar]
- 7.Raman J, Fritz TA, Gerken TA, Jamison O, Live D, Liu M, Tabak LA. J Biol Chem. 2008;283:22942–22951. doi: 10.1074/jbc.M803387200. [DOI] [PMC free article] [PubMed] [Google Scholar]
- 8.Hambly DM, Gross ML. J Amer Soc Mass Spectrom. 2005;16:2057–2063. doi: 10.1016/j.jasms.2005.09.008. [DOI] [PubMed] [Google Scholar]
- 9.Xu G, Chance MR. Anal Chem. 2005;77:2437–2449. doi: 10.1021/ac0484629. [DOI] [PubMed] [Google Scholar]
- 10.Fitzgerald M, West G. J Amer Soc Mass Spectrom. 2009;20:1193–1206. doi: 10.1016/j.jasms.2009.02.006. [DOI] [PubMed] [Google Scholar]
- 11.Thompson GA, Kilpatrick IC. Pharmacology & Therapeutics. 1996;72:25–36. doi: 10.1016/s0163-7258(96)00097-6. [DOI] [PubMed] [Google Scholar]


