Abstract
Although a wide range of developmental disabilities following fetal alcohol exposure are observed clinically, the molecular factors that determine the severity of these sequelae remain undefined. In mice exposed to ethanol, deletion of adenylyl cyclases (ACs) 1 and 8 exacerbates the neuroapoptosis that occurs in a prolonged post-treatment period; however, it remains unclear whether AC1 and AC8 are critical to the primary or secondary mechanisms underlying ethanol-induced neurodegeneration. Here we demonstrate that mice lacking AC1 and AC8 (DKO) display significantly increased apoptosis in the striatum, a region sensitive to neuroapoptosis in the acute post-treatment period, compared to WT controls. The enhanced neuroapoptotic response observed in the striatum of DKO mice is accompanied by significant reductions in phosphorylation of known pro-survival proteins, insulin receptor substrate-1 (IRS-1), Akt and extracellular signal-regulated kinases (ERKs). These data suggest that AC1/AC8 are crucial activators of cell survival signaling pathways acutely following ethanol exposure and represent molecular factors that may directly modulate the severity of symptoms associated with Fetal Alcohol Syndrome.
Keywords: fetal alcohol syndrome, striatum, apoptosis, ethanol, phosphorylation, caspase-3, adenylyl cyclase
Introduction
The neurotoxic effects of intrauterine ethanol exposure include severe developmental abnormalities in children that persist into adulthood, a condition referred to as Fetal Alcohol Syndrome (FAS). Among these are characteristic craniofacial malformations and neurobehavioral disturbances, including hyperactivity/attention deficit disorder and learning disabilities, which are associated with reduced brain mass (Clarren et al., 1978; Jones and Smith, 1973; Jones et al., 1973; Streissguth and O'Malley, 2000; Swayze et al., 1997). The consequences of ethanol exposure range from mild to severe; however, the factors that dictate the extent of FAS symptoms are largely unknown.
Preclinical models of FAS have shown that neonatal rodents acutely exposed to ethanol demonstrate extensive neuroapoptosis throughout the developing nervous system (Ikonomidou et al., 2000; Olney et al., 2002b). Specifically, administration of ethanol during the brain growth spurt period (synaptogenesis) in neonatal rodents (embryonic day 17-postnatal day 14) results in massive neuronal cell death in the striatum, a region which is consistently and dramatically reduced in volume in children exposed to alcohol in utero (Archibald et al., 2001; Cortese et al., 2006). The window of rat and mouse brain development from birth until two weeks of age is analogous to a similar period of synaptogenesis in human development that occurs in the 7th to 9th month of gestation in utero, a time highly relevant for the elucidation of fetal alcohol effects (Dobbing and Sands, 1979).
The actions of ethanol are largely attributed to its antagonism of NMDA receptors and potentiation of GABAA receptors (Ron, 2004; Ueno et al., 2001). Drugs that mimic ethanol’s effects on these receptors result in extensive neuronal death in the neonatal rodent brain (Ikonomidou et al., 2000), however the mechanisms that subserve this ethanol-mediated neurodegeneration are not well defined. Since not all human fetuses manifest FAS as a consequence of in utero ethanol exposure during the critical period of brain growth (Jones and Smith, 1975; Jones et al., 1974; Olegard et al., 1979; Sampson et al., 1997), endogenous factors that modulate the cellular responses to NMDA or GABAA receptors and other activity-dependent survival signals are likely to be critical determinants for the degree of neurotoxicity imparted. For example, antagonism of NMDA receptor-mediated calcium entry results in impairment of intracellular signaling pathways, such as those involving the calcium-stimulated adenylyl cyclases, AC1 and AC8. All nine mammalian AC isoforms convert ATP to cAMP, with AC1 and AC8 being the only 2 isoforms in the brain that are stimulated by calcium (Cooper et al., 1995; Sunahara et al., 1996). Additional cell-signaling processes that are associated with neuronal growth and survival mechanisms are the ERKs and the phosphatidylinositol 3-kinase (PI 3-kinase)/IRS-1 cascades. Ethanol-induced reductions in IRS-1 phosphorylation are associated with impairments of survival pathways involving Akt and ERK signaling (de la Monte and Wands, 2002; Xu et al., 2003; Yeon et al., 2003).
Recently, we have demonstrated that mice lacking both AC1 and AC8 are more sensitive to the sedative effects of ethanol as adults and display enhanced neurodegeneration 24 hrs after ethanol treatment as neonates (Maas et al., 2005a; Maas et al., 2005b). However, evaluation of ethanol-induced neurodegeneration in the prolonged post-treatment period does not distinguish between the direct and indirect mechanisms that subserve ethanol-induced neurodegeneration. The rapid and compressed window for ethanol-induced apoptosis in striatal neurons, beginning as early as 2 hours after treatment, along with abundant expression of NMDA receptors, provides distinct advantages for analysis of this brain region. Therefore, in order to investigate the direct effects of AC1 and AC8 on ethanol-induced neuroapoptosis, we assessed striatal cell apoptosis in the acute periods after ethanol treatment in mice lacking AC1 (AC1KO), AC8 (AC8KO) or both AC1 and AC8 (DKO) and found increased striatal cell death in DKO mice compared to WT controls. Furthermore, impaired pro-survival pathways involving the phosphorylation of IRS-1, Akt and ERK are associated with this increase in striatal cell death in DKO mice. These results implicate AC1 and AC8 in the activation of pro-survival mechanisms after ethanol exposure.
Materials and methods
Animal Husbandry
All mice were backcrossed a minimum of ten generations to WT C57BL/6 mice from The Jackson Laboratory (Bar Harbor, ME). To generate mice for these experiments, we used progeny of homozygous mutants (AC1KO, AC8KO or DKO) and WT mice from The Jackson Laboratory bred in our colony. Mice were maintained on a 12 hr light/dark schedule with ad libitum access to food and water. All experiments were performed using male mice 7 days after birth (postnatal day 7, P7). All mouse protocols were in accordance with the National Institutes of Health guidelines and were approved by the Animal Care and Use Committee of Washington University School of Medicine.
Drug Treatment
As pups from different litters vary considerably in the apoptotic response to ethanol, a litter matching approach was used to ensure that every treatment group was comprised of pups from at least 4 litters and that control pups were matched from the same litters. P7 pups were injected subcutaneously with saline or ethanol (prepared as a 20% solution in sterile normal saline). After injection, pups were not returned to their mothers, but rather were maintained in a separate cage under a lamp that provided an ambient temperature of 31°C.
Protein Immunoblot Analysis
AC1 and AC8 immunoblot analysis
Seven day WT or DKO male mice were anesthetized and their brains rapidly removed. Striata were dissected on ice, snap frozen in liquid nitrogen and stored at −80°C. As detailed previously (Conti et al., 2007), frozen tissues were homogenized in cold lysis buffer A (20 mM Tris-HCl (pH 7.4), 2 mM MgCl2, 1 mM EDTA, 0.5 mM DTT) containing protease inhibitor mixture and phosphatase inhibitor mixtures 1 and 2 (Sigma). Homogenates were centrifuged at 600 × g for 2 min, and the resulting membrane-enriched supernatants centrifuged at 30,000 × g for 20 min. Protein concentration was determined by the BCA assay (Pierce Biotechnology). For neonatal AC1 and AC8 expression, 30 µg of striatal membrane extract was separated by 4–12% SDS-PAGE, transferred to nitrocellulose membrane using a semi-dry preparation (15V for 50 min). The membrane was blocked in 5% nonfat dry milk/Tween 20-Tris-buffered saline (0.1% Tween-20 in 26 mM Tris-HCl (pH 8.0), 0.9% NaCl) for 1 hr at room temperature followed by incubation overnight at 4°C with rabbit anti-AC1 antibody (1:500 in blocking buffer) or goat anti-AC8 antibody (1:500, Santa Cruz Biotechnology). Equal protein loading conditions were verified by immunodetection for mouse anti-binding protein (BiP, 1:1000, BD Transduction Laboratories) in all samples. Signals were detected using anti-rabbit, anti-goat, or anti-mouse HRP-conjugated secondary antibodies, as appropriate, and visualized using chemiluminescence (SuperSignal WestDura; Pierce Biotechnology). Membranes were stripped with Restore Stripping Buffer (Pierce Biotechnology) between exposure to each primary antibody.
Phosphoprotein Analysis
At various times following saline or ethanol treatment, P7 WT or DKO male mice were anesthetized and their brains rapidly removed (n = 4–6 per treatment/timepoint/genotype). Striata were dissected on ice, snap frozen in liquid nitrogen and stored at −80°C. Frozen tissues were homogenized in cold lysis buffer (150 mM NaCl, 2 mM EDTA, 1% Triton X-100, 10% glycerol and 20 mM Tris, (pH 7.5)) containing protease inhibitor mixture and phosphatase inhibitor mixtures 1 and 2 (Sigma). Homogenates were centrifuged at 10,000 × g for 10 min, and the resulting supernatants were stored at −80°C. Protein concentration was determined by the BCA assay (Pierce Biotechnology). For phosphorylated and total IRS-1, Akt and ERK expression, 30 µg (ERK and Akt) or 1µg (IRS-1) of striatal membrane extract was separated by 4–12% SDS-PAGE, transferred to nitrocellulose membrane using a semi-dry preparation (15V for 50 min). The membrane was blocked in 5% nonfat dry milk/Tween 20-Tris-buffered saline (0.1% Tween-20 in 26 mM Tris-HCl (pH 8.0), 0.9% NaCl) for 1 hr at room temperature followed by incubation overnight at 4°C with rabbit anti-pERK (1:1000, Cell Signaling) or anti-ERK 2 (1:10,000, Santa Cruz Biotechnology) antibodies; rabbit anti-pAkt or anti-Akt antibodies (1:1000, Cell Signaling); or rabbit anti-pIRS-1 or anti-IRS-1 (1:1000, Cell Signaling) antibodies in blocking buffer. Signals were detected using an anti-rabbit HRP-conjugated secondary antibody and visualized using chemiluminescence (SuperSignal WestDura; Pierce Biotechnology). Membranes were stripped with Restore Stripping Buffer (Pierce Biotechnology) between exposure to each primary antibody. For each sample, phosphoprotein signals were normalized to total protein signals and averaged by treatment and genotypes. Densitometric analysis was performed using NIH Image Software. ANOVA and post-hoc analysis were performed using GraphPad Prism 4.0 software (Hearne Scientific Software).
Immunohistochemical Analysis
Immunohistochemical Detection of AC1 and AC8
As detailed previously (Conti et al., 2007), P7 WT or DKO mice were anesthetized and transcardially perfused with 4% paraformaldehyde. After perfusion brains were removed, postfixed for 72 hrs in 4% paraformaldehyde, cryoprotected in 30% sucrose and frozen at −80°C until use. Frozen tissues were cut into 55 µm slices and stored free-floating in 1X PBS/0.1% NaN3 at 4°C. For AC1 analysis, sections were quenched of endogenous peroxidases with 0.3%H2O2/0.75% Triton X-100 for 1 hr, washed in 1X PBS and blocked with 1% normal goat serum/10% fish gel/0.6% nonfat dry milk (blocking solution A) for 1 hr. Sections were incubated in rabbit anti-AC1 antibody (1:400 in blocking solution A) overnight at 4°C with continued incubation at room temperature for 4 hr the next day. Sections were then incubated in blocking solution A for 1 hr. Following treatment with biotinylated goat anti-rabbit secondary antibody (Vector Labs) at 1:800 for 1 hr, sections were blocked again as described. Biotin was detected with an ABC Kit (Vector Labs) and visualized using TSA+ Cyanine 3 (Tyramide amplification) kit (1:1000, Perkin Elmer) for 3 min. Sections were slide-mounted using Vectashield mounting medium containing DAPI (Vector Labs) counterstain for visualization of anatomical landmarks. For AC8 analysis, sections from neonatal mice were quenched of endogenous peroxidases with 0.3%H2O2/0.75% Triton X-100 for 1 hr, washed in 1X PBS and blocked with 1% normal rabbit serum/10% fish gel/0.6% nonfat dry milk (blocking solution B) for 1 hr. Sections were incubated in goat anti-AC8 antibody (1:400, Santa Cruz Biotechnology, in blocking solution B) overnight at 4°C followed by incubation in blocking solution B for 1 hr. Following treatment with biotinylated rabbit anti-goat secondary antibody (Vector Labs) at 1:800 for 1 hr sections were blocked again as described. Biotin was detected and sections were slide-mounted as described for AC1 analysis. All images were obtained with controlled exposure time on an Olympus BX60 fluorescent microscope equipped with Axiovision software. Images were prepared using Adobe Photoshop Software.
Immunohistochemical Detection of Activated Caspase-3-
Immunohistochemistry for activated caspase-3 was performed as previously described (Olney et al., 2002a; Young and Olney, 2006). Four hours after treatment with ethanol or saline, P7 WT, AC1KO, AC8KO or DKO mice (n = 4–6 per treatment/genotype) were anesthetized and transcardially perfused with 4% paraformaldehyde. After perfusion, brains were removed, postfixed for 72 hrs in 4% paraformaldehyde and sections were cut on a vibratome (50 µm, cut in the sagittal plane). Sections were washed in 0.01 M PBS, quenched of endogenous peroxidases with 3% H2O2 and incubated for 1 hr in blocking solution (2% BSA/0.2% nonfat dry milk/0.1% Triton X-100 in PBS), followed by incubation overnight in rabbit anti-activated caspase-3 antibody (1:2000, Cell Signaling) in blocking solution. Sections were incubated for 1 hr in biotinylated goat anti-rabbit secondary antibody (1:200 in blocking solution, Vector Labs). Biotin was detected with a standard Vectastain ABC Elite Kit (Vector Labs) and visualized using Vector VIP substrate for peroxidase (Vector Labs). Every 8th section selected from serial sections cut from an entire half brain were used to quantify caspase-3 activation. All activated caspase-3 positive cells within the striatum of each section were counted to achieve a total amount of activated caspase-3 positive cells per hemibrain. Counts are presented as an average number of activated caspase-3 positive cells per section. Student’s t-tests or ANOVA with Bonferroni corrections were performed where appropriate using GraphPad Prism 4.0 software (Hearne Scientific Software).
Results
AC1 and AC8 proteins are expressed in the developing striatum
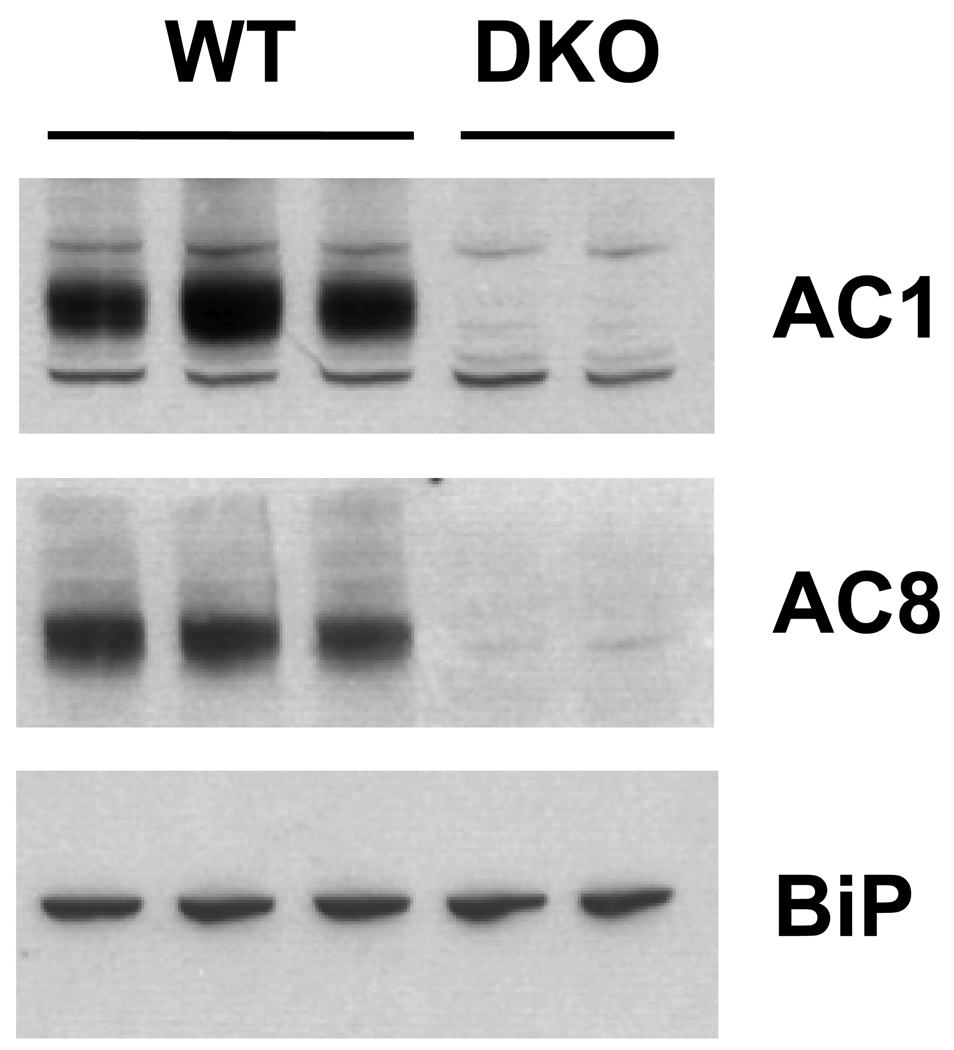
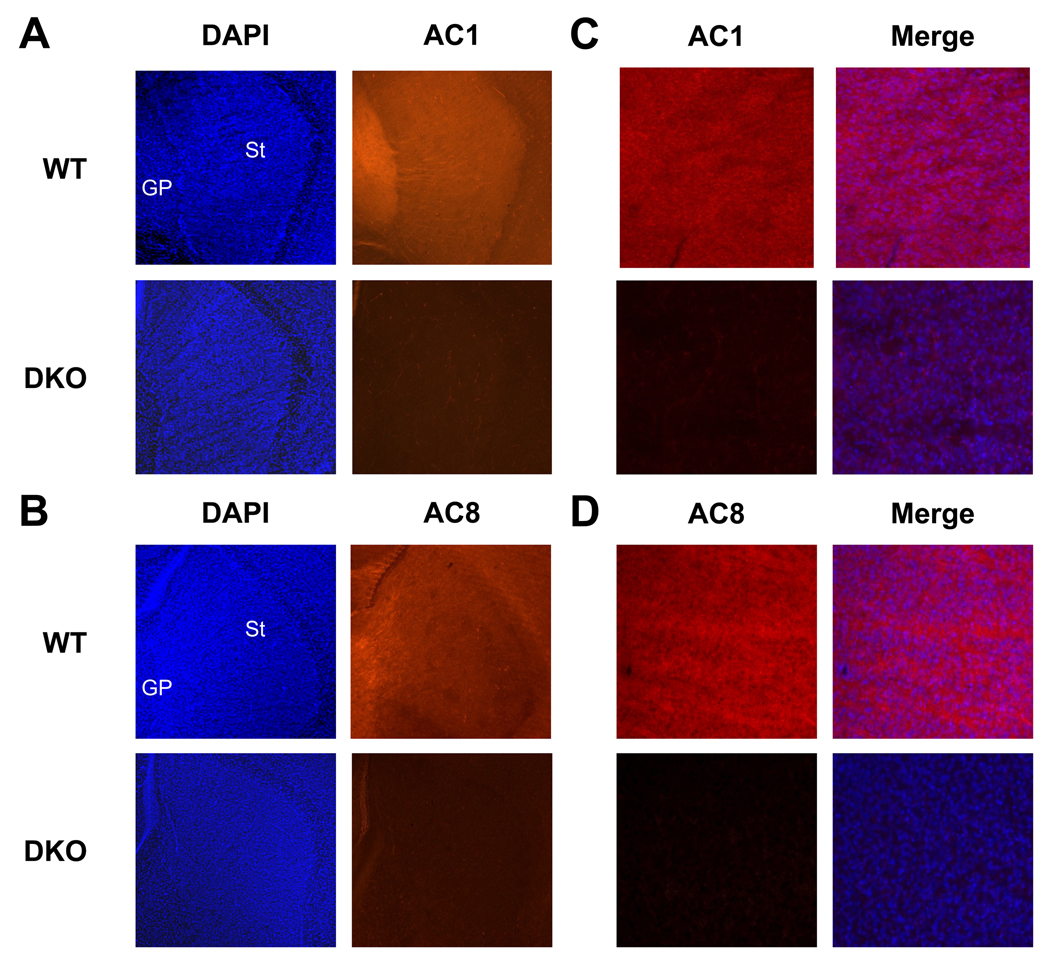
We have previously demonstrated that AC1 and AC8 are expressed throughout the developing brain including the hippocampus, cortex and thalamus (Conti et al., 2007). In order to examine the distribution of AC1 and AC8 in the neonatal striatum, protein immunobots were performed. Membrane-enriched protein extracts from the striatum of P7 WT or DKO mice were subjected to SDS-PAGE and immunoblotted with anti-AC1 or anti AC8 antibodies. Robust expression of both AC1 and AC8 proteins were detected in WT, but not DKO extracts (Figure 1). In order to determine the cellular distribution of AC1 and AC8 proteins in the neonatal striatum, immunohistochemistry was performed. Widespread expression of both AC1 (Figure 2A, 2C) and AC8 (Figure 2B, 2D) were detected in the striatum of P7 WT mice. Immunoreactivity for AC1 and AC8 was not observed in the DKO striatum, demonstrating the specificity of the antibodies used.
Fig. 1.
Protein immunoblot analysis of AC1 and AC8 expression in the developing striatum. Abundant protein expression of both AC1 and AC8 was detected in membrane-enriched striatal protein extracts obtained from P7 WT and DKO mice. A single immunoreactive band at ~123 kD, representing AC1 protein was detected in all WT but not DKO samples. A single immunoreactive band at ~135 kD, representing AC8 protein was detected in all WT but not DKO samples. Equal loading conditions were verified by immunodetection for binding protein (BiP).
Fig. 2.
Localization of AC1 and AC8 protein in the developing mouse striatum by immunohistochemistry. Representative sagittal sections from the P7 mouse brain demonstrate widespread protein distribution of AC1 and AC8. (A) AC1 immunoreactivity (orange) was robustly expressed throughout the P7 WT striatum (St) and globus pallidus (GP). AC1 immunoreactivity was not detected in DKO mice demonstrating specific antigen recognition. DAPI nuclear counterstain (blue) was used for identification of anatomical landmarks (40X). (B) AC8 immunoreactivity (orange) was robustly expressed throughout the P7 WT striatum (St) and globus pallidus (GP). AC8 immunoreactivity was not detected in DKO mice demonstrating specific antigen recognition. DAPI nuclear counterstain (blue) was used for identification of anatomical landmarks (40X). Higher magnification images (200X) of AC1 (C, left panel) and AC8 (D, left panel) immunoreactivity in the P7 striatum merged with DAPI nuclear counter stain (C, D, right panels).
Acute ethanol exposure exacerbates striatal apoptosis in ACKO compared to WT mice
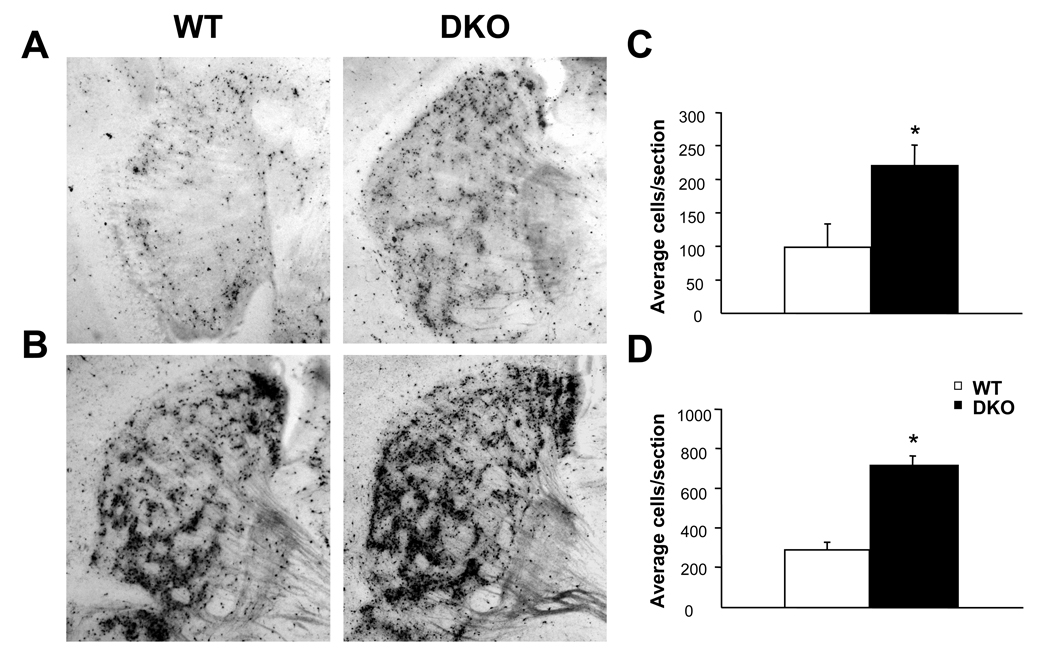
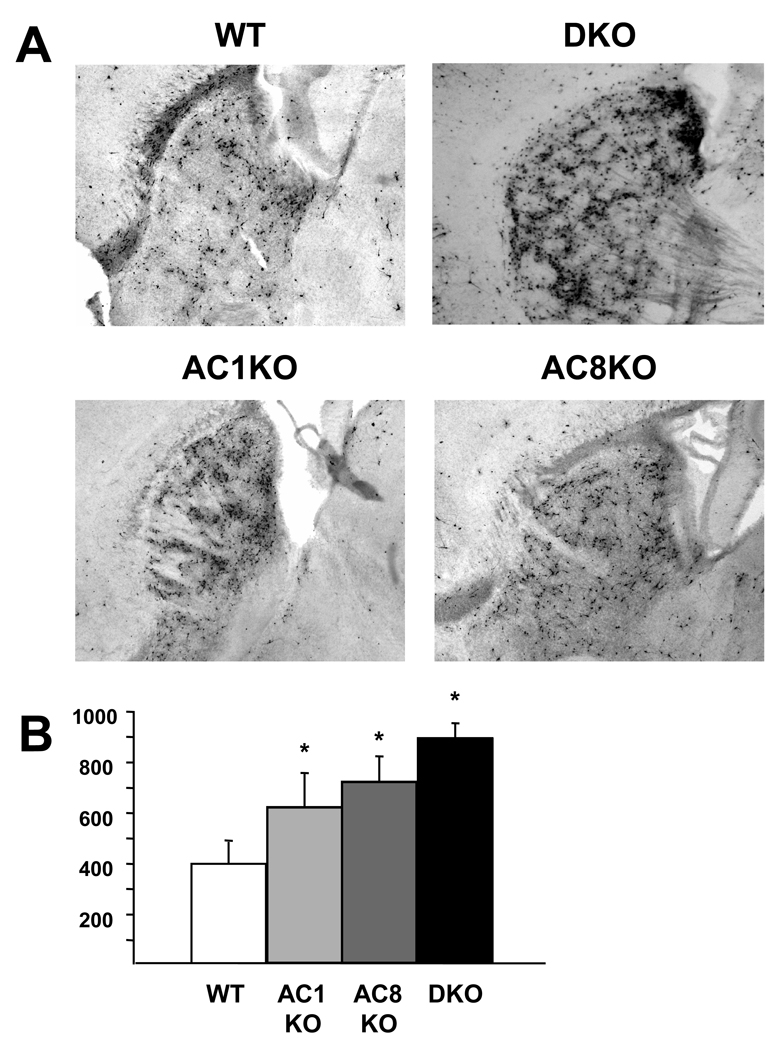
WT and DKO mice were administered one injection of ethanol (2.5 g/kg or 5.0 g/kg) and quantitation of caspase-3 positive cells in the striatum was performed at 4 hrs post-treatment to assess the apoptotic response. WT mice demonstrated massive striatal apoptosis at 4 hrs after ethanol treatment (Figure 3). Treatment with 5.0 g/kg ethanol (Figure 3B, D) resulted in a nearly 2.5 fold increase in apoptosis compared to 2.5 g/kg ethanol (Figure 3A, C) in WT mice. Similar to WT mice, DKO mice demonstrated a 2.5 fold increase at 5.0 g/kg (Figure 3B, D) compared to 2.5 g/kg ethanol (Figure 3A, C) with DKO mice exhibiting a 2.5 fold increase in apoptosis compared to WT mice at both doses tested (Figure 3C, D). No differences between saline-treated WT and DKO mice were observed (data not shown). In order to determine the effect of loss of a single AC isoform on ethanol-induced apoptosis, mice lacking AC1 or AC8 were treated with 5.0 g/kg ethanol and quantitation of caspase-3 positive cells in the striatum was performed at 4 hrs post-treatment. Deletion of AC1 or AC8 resulted in significantly more apoptosis compared to WT mice reaching levels statistically indistinguishable from those of DKO mice (Figure 4).
Fig. 3.
DKO mice demonstrate increased apoptosis following acute ethanol treatment. Representative sagittal sections depicting ethanol-induced apoptosis in the striatum 4 hours after 2.5 g/kg (A, C) or 5.0 g/kg (B, D) in P7 WT and DKO mice. DKO mice demonstrated 2.5 fold increases in activated caspase-3 expression compared to WT mice (*, p < 0.05) at both doses (C, 2.5 g/kg; D, 5.0 g/kg).
Fig. 4.
ACKO mice demonstrate increased apoptosis following acute ethanol treatment. Representative sagittal sections depicting ethanol-induced apoptosis in the striatum 4 hours after 5.0 g/kg (A) in P7 WT, DKO, AC1KO and AC8KO mice. AC1KO, AC8KO and DKO mice demonstrated statistically equivalent levels of activated caspase-3 expression in the striatum, which were significantly increased compared to WT mice (B, *, p < 0.05) after ethanol exposure.
Phosphorylation of pro-survival proteins is impaired in DKO mice
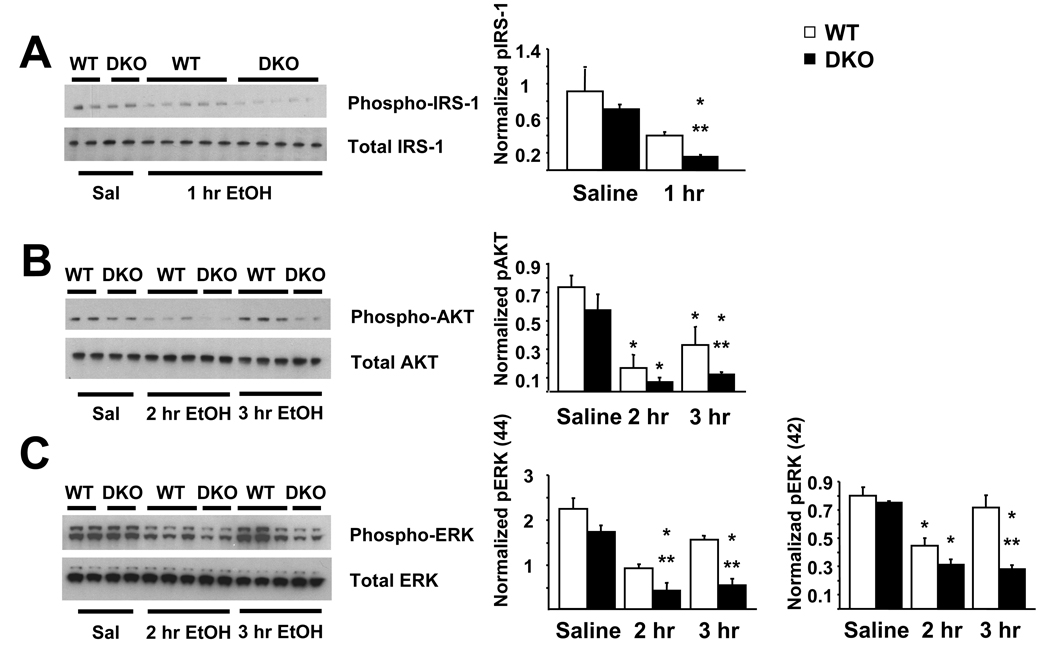
One, 2 or 3 hours following treatment with saline or 5.0 g/kg ethanol, striata from WT and DKO neonatal mice were removed and prepared for protein immunoblot analysis. Whole cell protein extracts from the striatum of P7 WT or DKO mice were subjected to SDS-PAGE and membranes were immunoblotted with anti-phospho-IRS-1, anti-phospho-Akt or anti-phospho-ERK antibodies. By 1 hr after ethanol treatment levels of phosphorylated IRS-1 were significantly reduced in DKO mice compared to ethanol-treated WT mice and saline-treated DKO controls (Figure 5A). Similarly, significant reductions in Akt phosphorylation were observed in WT and DKO mice compared to respective saline controls at 2 hrs after ethanol administration (Figure 5B). By 3 hrs after ethanol treatment DKO mice demonstrated a sustained reduction in phosphorylated Akt levels compared to ethanol-treated WT mice. Likewise, loss of AC1 and AC8 resulted in significant impairments in ERK 1 phosphorylation at 2 and 3 hrs following ethanol administration compared to WT mice treated with ethanol and saline-treated DKO mice (Figure 5C). Ethanol significantly reduced ERK 2 phosphorylation at 2 hrs after treatment in both WT and DKO mice compared to saline controls. This reduction was sustained in DKO mice while WT mice recovered to control levels by 3 hrs after treatment.
Fig. 5.
DKO mice demonstrate impaired pro-survival protein phosphorylation in the striatum acutely following 5.0 g/kg ethanol administration. (A) By 1 hour after ethanol, phosphorylation of IRS-1 is significantly impaired in DKO mice compared to WT ethanol (**, p < 0.05) and DKO saline controls (*, p < 0.05) as measured by immunoblot analysis. (B) By 2 hours after ethanol, phosphorylation of AKT is significantly impaired in WT and DKO mice compared to WT and DKO saline controls (*, p < 0.05), respectively as measured by immunoblot analysis. At 3 hours after ethanol treatment, levels of phosphorylated AKT are still reduced in WT mice compared to saline controls (*, p < 0.05), DKO mice demonstrate levels that are significantly reduced compared to WT ethanol controls (**, p < 0.05). (C) By 2–3 hours after ethanol, phosphorylation of ERK (p44) is significantly impaired in DKO mice compared to WT ethanol (**, p < 0.05) and DKO saline controls (*, p < 0.05) as measured by immunoblot analysis. By 2 hours after ethanol, phosphorylation of ERK (p42) is significantly impaired in WT and DKO mice compared to WT and DKO saline controls (*, p < 0.05), respectively as measured by immunoblot analysis. At 3 hours after ethanol treatment, levels of phosphorylated ERK (p42) in WT mice had returned to controls levels, however, DKO mice demonstrate levels that are significantly reduced compared to WT ethanol controls (**, p < 0.05) and DKO saline controls (*, p < 0.05).
Discussion
In the present study, we have demonstrated that deletion of AC1 and AC8 exacerbates the neuroapoptotic response in the striatum acutely following a single exposure to ethanol. This response was accompanied by significant impairment of pro-survival signaling involving phosphorylation of IRS-1, Akt and ERK in DKO mice compared to controls. Administration of ethanol during the synaptogenesis period of development resulted in a dose-dependent increase in apoptosis in the developing striatum in WT and DKO mice within 4 hours of treatment. These data are in agreement with our previous reports demonstrating that neurons within the striatum are exquisitely sensitive to damage caused by very low doses of ethanol and that the neuroapoptotic response to ethanol occurs rapidly, within 4 hrs of treatment (Young and Olney, 2006). DKO mice demonstrated increased apoptosis compared to WT mice at both 2.5 g/kg and 5.0 g/kg ethanol within 4 hrs of ethanol exposure. These data are supported by our previous studies in which DKO mice show a heightened apoptotic response 24 hrs after ethanol treatment compared to WT mice in regions including the cortex, thalamus and subiculum (Maas et al., 2005a). This enhanced neuroapoptotic response is not likely due to altered ethanol metabolism as we have previously demonstrated that blood ethanol concentration is equivalent in DKO mice and WT mice following acute ethanol treatment (Maas et al., 2005a).
The activity dependent survival of multiple neuronal cell types is dependent on depolarization-induced elevation of intracellular calcium and downstream activation of multiple signaling cascades (Mennerick and Zorumski, 2000). The cAMP signal transduction system has also been shown to be important for neuronal survival (D'Mello et al., 1993; Hanson et al., 1998; Lara et al., 2003; Meyer-Franke et al., 1995; Meyer-Franke et al., 1998; Reiriz et al., 2002). The widespread expression of AC1 and AC8 throughout the developing striatum and their direct stimulation by calcium suggest that AC1 and AC8 are poised to mediate calcium-dependent cAMP signaling associated with ethanol-induced striatal cell death.
Mechanisms that subserve the striatum’s vulnerability to rapid and synchronous apoptosis following acute doses of ethanol are not well defined. Abundant expression of insulin receptors in the striatum (Schulingkamp et al., 2000) suggest that a potential source of striatal vulnerability is related to ethanol’s ability to suppress survival signaling through insulin-regulated pathways (de la Monte et al., 2000; de la Monte and Wands, 2002; Hallak et al., 2001; Xu et al., 2003; Zhang et al., 1998). In the present study, the increased apoptosis observed in the DKO striatum compared to WT mice is associated with impaired phosphorylation of IRS-1, a major substrate of the intrinsic receptor tyrosine kinases associated with the insulin and insulin-like growth factor type 1 receptors (Myers et al., 1994; Shpakov and Pertseva, 2000). While IRS-1 activation by NMDA receptor-mediated calcium flux has been demonstrated in vitro (Zhang et al., 1998), the present data suggest that IRS-1-dependent activation via NMDA-mediated calcium influx may regulate neuronal survival following ethanol administration in vivo, representing a mechanism by which changes in striatal IRS-1 phophorylation could contribute to the difference in ethanol-sensitivity between WT and DKO mice independently of direct signaling through the insulin and insulin-like growth factor type 1 receptors.
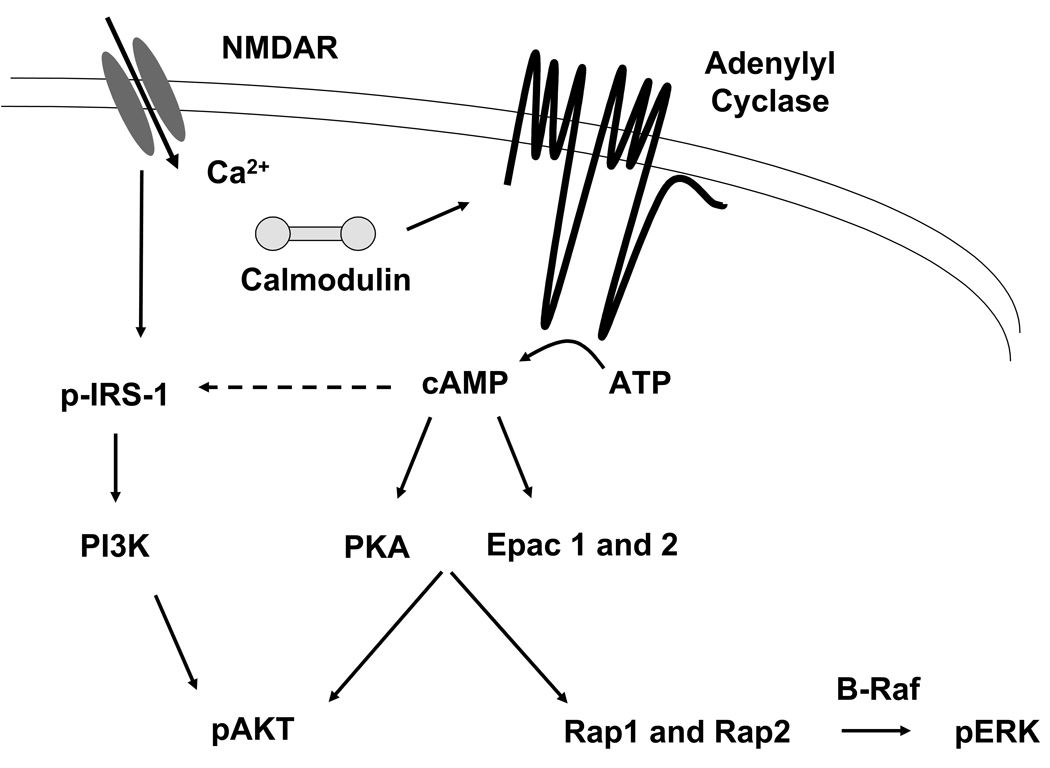
Ethanol-induced suppression of insulin and insulin-like growth factor type 1 receptor signaling results in decreased PI 3-kinase activity and subsequent reductions in phosphorylated Akt levels and Akt kinase activity (Xu et al., 2003). While Akt is a well-established downstream target of PI 3-kinase signaling, stimulation of Akt has also been demonstrated to be PI 3-kinase-independent and responsive to elevations in cAMP (Sable et al., 1997). More specifically, PKA induces activation and translocation of Akt in vitro (Filippa et al., 1999), suggesting that a loss of AC activity may lead to impairments in Akt-mediated neuronal survival. Epac (exchange protein directly activated by cAMP), a direct mediator of cAMP activity, has also been implicated as an upstream mediator of Akt (Misra and Pizzo, 2005). In addition, Epac proteins bind cAMP with high affinity and activate their downstream targets Rap1 and Rap2, Ras superfamily guanine nucleotide-binding proteins. Activation of Rap1 can occur in response to an increase in intracellular cAMP in additional to many other stimuli (Altschuler et al., 1995; Bos et al., 2001; Vossler et al., 1997). Activation of B-Raf by Rap1 promotes ERK activity, linking AC/cAMP signaling to ERK-mediated neuronal survival (York et al., 1998). The interactions of these pathways are schematized in Figure 6.
Fig. 6.
Intracellular Ca2+ activates AC1 and AC8 catalyzing the conversion of ATP to cAMP, which in turn, activates PKA and EPAC. Downstream phosphoryation targets include AKT and ERK, which promote cell survival.
Together these data demonstrate a role for AC1 and AC8 in promoting the pro-survival mechanisms associated with ethanol-induced neurodegeneration in the striatum. While the mechanisms by which some fetuses suffer substantial detrimental effects after limited ethanol exposure while others undergo little to no neurological compromise are largely unknown, our results indicate that variation in activity of AC1, AC8 and perhaps the cAMP pathway more generally, has important ramifications for the likelihood of a fetus being more or less susceptible to FAS. Furthermore, the risk of neurological damage occurring as a consequence of diminished calcium-stimulated AC activity extends to other modulators of neuronal activity during the synaptogenesis period such as anesthetics (e.g., ketamine) that block NMDA receptor activity. These agents are routinely employed during surgical intervention in newborns and suggest that genotyping at the AC1 and AC8 loci could be critical pharmacogenomic indicators for the likelihood of adverse effects in the human population.
Acknowledgments
This work was supported by the National Institutes of Health Grants HD049305 (A.C.C.), AA12957 (L.J.M.), DA005072 and MH37100 (J.W.O.)
Footnotes
Publisher's Disclaimer: This is a PDF file of an unedited manuscript that has been accepted for publication. As a service to our customers we are providing this early version of the manuscript. The manuscript will undergo copyediting, typesetting, and review of the resulting proof before it is published in its final citable form. Please note that during the production process errors may be discovered which could affect the content, and all legal disclaimers that apply to the journal pertain.
References
- Altschuler DL, et al. Cyclic AMP-dependent activation of Rap1b. J Biol Chem. 1995;270:10373–10376. doi: 10.1074/jbc.270.18.10373. [DOI] [PubMed] [Google Scholar]
- Archibald SL, et al. Brain dysmorphology in individuals with severe prenatal alcohol exposure. Dev Med Child Neurol. 2001;43:148–154. [PubMed] [Google Scholar]
- Bos JL, et al. Rap1 signalling: adhering to new models. Nat Rev Mol Cell Biol. 2001;2:369–377. doi: 10.1038/35073073. [DOI] [PubMed] [Google Scholar]
- Clarren SK, et al. Brain malformations related to prenatal exposure to ethanol. J Pediatr. 1978;92:64–67. doi: 10.1016/s0022-3476(78)80072-9. [DOI] [PubMed] [Google Scholar]
- Conti AC, et al. Distinct regional and subcellular localization of adenylyl cyclases type 1 and 8 in mouse brain. Neuroscience. 2007;146:713–729. doi: 10.1016/j.neuroscience.2007.01.045. [DOI] [PMC free article] [PubMed] [Google Scholar]
- Cooper DM, et al. Adenylyl cyclases and the interaction between calcium and cAMP signalling. Nature. 1995;374:421–424. doi: 10.1038/374421a0. [DOI] [PubMed] [Google Scholar]
- Cortese BM, et al. Magnetic resonance and spectroscopic imaging in prenatal alcohol-exposed children: preliminary findings in the caudate nucleus. Neurotoxicol Teratol. 2006;28:597–606. doi: 10.1016/j.ntt.2006.08.002. [DOI] [PubMed] [Google Scholar]
- D'Mello SR, et al. Induction of apoptosis in cerebellar granule neurons by low potassium: inhibition of death by insulin-like growth factor I and cAMP. Proc Natl Acad Sci U S A. 1993;90:10989–10993. doi: 10.1073/pnas.90.23.10989. [DOI] [PMC free article] [PubMed] [Google Scholar]
- de la Monte SM, et al. Partial rescue of ethanol-induced neuronal apoptosis by growth factor activation of phosphoinositol-3-kinase. Alcohol Clin Exp Res. 2000;24:716–726. [PubMed] [Google Scholar]
- de la Monte SM, Wands JR. Chronic gestational exposure to ethanol impairs insulin-stimulated survival and mitochondrial function in cerebellar neurons. Cell Mol Life Sci. 2002;59:882–893. doi: 10.1007/s00018-002-8475-x. [DOI] [PMC free article] [PubMed] [Google Scholar]
- Dobbing J, Sands J. Comparative aspects of the brain growth spurt. Early Hum Dev. 1979;3:79–83. doi: 10.1016/0378-3782(79)90022-7. [DOI] [PubMed] [Google Scholar]
- Filippa N, et al. Mechanism of protein kinase B activation by cyclic AMP-dependent protein kinase. Mol Cell Biol. 1999;19:4989–5000. doi: 10.1128/mcb.19.7.4989. [DOI] [PMC free article] [PubMed] [Google Scholar]
- Hallak H, et al. Inhibition of insulin-like growth factor-I signaling by ethanol in neuronal cells. Alcohol Clin Exp Res. 2001;25:1058–1064. [PubMed] [Google Scholar]
- Hanson MG, Jr, et al. Cyclic AMP elevation is sufficient to promote the survival of spinal motor neurons in vitro. J Neurosci. 1998;18:7361–7371. doi: 10.1523/JNEUROSCI.18-18-07361.1998. [DOI] [PMC free article] [PubMed] [Google Scholar]
- Ikonomidou C, et al. Ethanol-induced apoptotic neurodegeneration and fetal alcohol syndrome. Science. 2000;287:1056–1060. doi: 10.1126/science.287.5455.1056. [DOI] [PubMed] [Google Scholar]
- Jones KL, Smith DW. Recognition of the fetal alcohol syndrome in early infancy. Lancet. 1973;2:999–1001. doi: 10.1016/s0140-6736(73)91092-1. [DOI] [PubMed] [Google Scholar]
- Jones KL, Smith DW. The fetal alcohol syndrome. Teratology. 1975;12:1–10. doi: 10.1002/tera.1420120102. [DOI] [PubMed] [Google Scholar]
- Jones KL, et al. Outcome in offspring of chronic alcoholic women. Lancet. 1974;1:1076–1078. doi: 10.1016/s0140-6736(74)90555-8. [DOI] [PubMed] [Google Scholar]
- Jones KL, et al. Pattern of malformation in offspring of chronic alcoholic mothers. Lancet. 1973;1:1267–1271. doi: 10.1016/s0140-6736(73)91291-9. [DOI] [PubMed] [Google Scholar]
- Lara J, et al. Interactions of cyclic adenosine monophosphate, brain-derived neurotrophic factor, and glial cell line-derived neurotrophic factor treatment on the survival and growth of postnatal mesencephalic dopamine neurons in vitro. Exp Neurol. 2003;180:32–45. doi: 10.1016/s0014-4886(02)00028-6. [DOI] [PubMed] [Google Scholar]
- Maas JW, Jr, et al. Calcium-stimulated adenylyl cyclases modulate ethanol-induced neurodegeneration in the neonatal brain. J Neurosci. 2005a;25:2376–2385. doi: 10.1523/JNEUROSCI.4940-04.2005. [DOI] [PMC free article] [PubMed] [Google Scholar]
- Maas JW, Jr, et al. Calcium-stimulated adenylyl cyclases are critical modulators of neuronal ethanol sensitivity. J Neurosci. 2005b;25:4118–4126. doi: 10.1523/JNEUROSCI.4273-04.2005. [DOI] [PMC free article] [PubMed] [Google Scholar]
- Mennerick S, Zorumski CF. Neural activity and survival in the developing nervous system. Mol Neurobiol. 2000;22:41–54. doi: 10.1385/MN:22:1-3:041. [DOI] [PubMed] [Google Scholar]
- Meyer-Franke A, et al. Characterization of the signaling interactions that promote the survival and growth of developing retinal ganglion cells in culture. Neuron. 1995;15:805–819. doi: 10.1016/0896-6273(95)90172-8. [DOI] [PubMed] [Google Scholar]
- Meyer-Franke A, et al. Depolarization and cAMP elevation rapidly recruit TrkB to the plasma membrane of CNS neurons. Neuron. 1998;21:681–693. doi: 10.1016/s0896-6273(00)80586-3. [DOI] [PMC free article] [PubMed] [Google Scholar]
- Misra UK, Pizzo SV. Coordinate regulation of forskolin-induced cellular proliferation in macrophages by protein kinase A/cAMP-response element-binding protein (CREB) and Epac1-Rap1 signaling: effects of silencing CREB gene expression on Akt activation. J Biol Chem. 2005;280:38276–38289. doi: 10.1074/jbc.M507332200. [DOI] [PubMed] [Google Scholar]
- Myers MG, Jr, et al. Insulin receptor substrate-1 mediates phosphatidylinositol 3'-kinase and p70S6k signaling during insulin, insulin-like growth factor-1, and interleukin-4 stimulation. J Biol Chem. 1994;269:28783–28789. [PubMed] [Google Scholar]
- Olegard R, et al. Effects on the child of alcohol abuse during pregnancy. Retrospective and prospective studies. Acta Paediatrica Scandinavica -Supplement. 1979;275:112–121. doi: 10.1111/j.1651-2227.1979.tb06170.x. [DOI] [PubMed] [Google Scholar]
- Olney JW, et al. Ethanol-induced caspase-3 activation in the in vivo developing mouse brain. Neurobiol Dis. 2002a;9:205–219. doi: 10.1006/nbdi.2001.0475. [DOI] [PubMed] [Google Scholar]
- Olney JW, et al. Ethanol-induced apoptotic neurodegeneration in the developing C57BL/6 mouse brain. Brain Res Dev Brain Res. 2002b;133:115–126. doi: 10.1016/s0165-3806(02)00279-1. [DOI] [PubMed] [Google Scholar]
- Reiriz J, et al. BMP-2 and cAMP elevation confer locus coeruleus neurons responsiveness to multiple neurotrophic factors. J Neurobiol. 2002;50:291–304. doi: 10.1002/neu.10034. [DOI] [PubMed] [Google Scholar]
- Ron D. Signaling cascades regulating NMDA receptor sensitivity to ethanol. Neuroscientist. 2004;10:325–336. doi: 10.1177/1073858404263516. [DOI] [PMC free article] [PubMed] [Google Scholar]
- Sable CL, et al. cAMP stimulates protein kinase B in a Wortmannin-insensitive manner. FEBS Lett. 1997;409:253–257. doi: 10.1016/s0014-5793(97)00518-8. [DOI] [PubMed] [Google Scholar]
- Sampson PD, et al. Incidence of fetal alcohol syndrome and prevalence of alcohol-related neurodevelopmental disorder. Teratology. 1997;56:317–326. doi: 10.1002/(SICI)1096-9926(199711)56:5<317::AID-TERA5>3.0.CO;2-U. [DOI] [PubMed] [Google Scholar]
- Schulingkamp RJ, et al. Insulin receptors and insulin action in the brain: review and clinical implications. Neurosci Biobehav Rev. 2000;24:855–872. doi: 10.1016/s0149-7634(00)00040-3. [DOI] [PubMed] [Google Scholar]
- Shpakov AO, Pertseva MN. Structural and functional characterization of insulin receptor substrate proteins and the molecular mechanisms of their interaction with insulin superfamily tyrosine kinase receptors and effector proteins. Membr Cell Biol. 2000;13:455–484. [PubMed] [Google Scholar]
- Streissguth AP, O'Malley K. Neuropsychiatric implications and long-term consequences of fetal alcohol spectrum disorders. Semin Clin Neuropsychiatry. 2000;5:177–190. doi: 10.1053/scnp.2000.6729. [DOI] [PubMed] [Google Scholar]
- Sunahara RK, et al. Complexity and diversity of mammalian adenylyl cyclases. Annual Review of Pharmacology & Toxicology. 1996;36:461–480. doi: 10.1146/annurev.pa.36.040196.002333. [DOI] [PubMed] [Google Scholar]
- Swayze VW, 2nd, et al. Magnetic resonance imaging of brain anomalies in fetal alcohol syndrome. Pediatrics. 1997;99:232–240. doi: 10.1542/peds.99.2.232. [DOI] [PubMed] [Google Scholar]
- Ueno S, et al. Alcohol actions on GABA(A) receptors: from protein structure to mouse behavior. Alcohol Clin Exp Res. 2001;25:76S–81S. doi: 10.1097/00000374-200105051-00014. [DOI] [PubMed] [Google Scholar]
- Vossler MR, et al. cAMP activates MAP kinase and Elk-1 through a B-Raf- and Rap1-dependent pathway. Cell. 1997;89:73–82. doi: 10.1016/s0092-8674(00)80184-1. [DOI] [PubMed] [Google Scholar]
- Xu J, et al. Ethanol impairs insulin-stimulated neuronal survival in the developing brain: role of PTEN phosphatase. J Biol Chem. 2003;278:26929–26937. doi: 10.1074/jbc.M300401200. [DOI] [PubMed] [Google Scholar]
- Yeon JE, et al. Potential role of PTEN phosphatase in ethanol-impaired survival signaling in the liver. Hepatology. 2003;38:703–714. doi: 10.1053/jhep.2003.50368. [DOI] [PubMed] [Google Scholar]
- York RD, et al. Rap1 mediates sustained MAP kinase activation induced by nerve growth factor. Nature. 1998;392:622–626. doi: 10.1038/33451. [DOI] [PubMed] [Google Scholar]
- Young C, Olney JW. Neuroapoptosis in the infant mouse brain triggered by a transient small increase in blood alcohol concentration. Neurobiol Dis. 2006;22:548–554. doi: 10.1016/j.nbd.2005.12.015. [DOI] [PubMed] [Google Scholar]
- Zhang FX, et al. N-Methyl-D-aspartate inhibits apoptosis through activation of phosphatidylinositol 3-kinase in cerebellar granule neurons. A role for insulin receptor substrate-1 in the neurotrophic action of n-methyl-D-aspartate and its inhibition by ethanol. J Biol Chem. 1998;273:26596–26602. doi: 10.1074/jbc.273.41.26596. [DOI] [PubMed] [Google Scholar]


