

Abstract
Motivation: Determining the functional impact of non-coding disease-associated single nucleotide polymorphisms (SNPs) identified by genome-wide association studies (GWAS) is challenging. Many of these SNPs are likely to be regulatory SNPs (rSNPs): variations which affect the ability of a transcription factor (TF) to bind to DNA. However, experimental procedures for identifying rSNPs are expensive and labour intensive. Therefore, in silico methods are required for rSNP prediction. By scoring two alleles with a TF position weight matrix (PWM), it can be determined which SNPs are likely rSNPs. However, predictions in this manner are noisy and no method exists that determines the statistical significance of a nucleotide variation on a PWM score.
Results: We have designed an algorithm for in silico rSNP detection called is-rSNP. We employ novel convolution methods to determine the complete distributions of PWM scores and ratios between allele scores, facilitating assignment of statistical significance to rSNP effects. We have tested our method on 41 experimentally verified rSNPs, correctly predicting the disrupted TF in 28 cases. We also analysed 146 disease-associated SNPs with no known functional impact in an attempt to identify candidate rSNPs. Of the 11 significantly predicted disrupted TFs, 9 had previous evidence of being associated with the disease in the literature. These results demonstrate that is-rSNP is suitable for high-throughput screening of SNPs for potential regulatory function. This is a useful and important tool in the interpretation of GWAS.
Availability: is-rSNP software is available for use at: www.genomics.csse.unimelb.edu.au/is-rSNP
Contact: gmaci@csse.unimelb.edu.au; adam.kowalczyk@nicta.com.au
Supplementary information: Supplementary data are available at Bioinformatics online.
1 INTRODUCTION
Genome-wide association studies (GWAS) aim to find single nucleotide polymorphisms (SNPs) that are linked to a particular disease or trait phenotype. Disease-associated SNPs residing in coding regions, specifically non-synonymous mutations, are generally easy to interpret in terms of their likely functional impact. However, unravelling the functional impact of SNPs residing outside coding regions is more challenging. One appealing functional role for non-coding disease associated SNPs is that they are regulatory SNPs (rSNPs). That is, they alter the binding affinity of a transcription factor (TF) to the DNA, which in turn alters the expression of certain genes, consequently contributing to the disease phenotype. Finding these rSNPs is difficult, since they can be obscured by the potentially large number of SNPs present in a linkage-disequilibrium block, and the experimental procedures involved can be expensive and labour intensive. Therefore, in silico approaches for identifying candidate rSNPs are required to improve the efficiency of interpretation of non-coding disease-associated SNPs.
Previous attempts at finding rSNPs have relied largely on prediction of TF binding sites that overlap SNPs (Ponomarenko et al., 2001). This approach typically produces large numbers of false positives, as many SNPs will not significantly alter the binding affinity of a TF given the degenerate nature of TF binding sites. An improvement to this approach looked at the difference in binding site score between two alleles using a position weight matrix (PWM; Andersen et al., 2008). The reasoning here is that SNPs generating ‘larger’ PWM score differences are considered more likely to be rSNPs than those generating ‘smaller’ differences. However, the paper presenting this method demonstrated that without the use of additional information such as phylogenetic footprinting, discovery of rSNPs was not possible considering only differences in binding score affinities using PWMs (Andersen et al., 2008). More recently, however, a method which looks at normalizing the score distributions of PWMs was used so that observed changes were comparable between PWMs (Manke et al., 2010). In this case the PWM scores are not used directly, but a modified affinity score is used to represent the binding affinity. A Fourier transform is used to calculate the complete distribution of affinity scores, consequently allowing the computation of a P-value for observed scores. The ratio of P-values of affinity scores between two alleles can then be used to determine if the TF binding site is likely to be disrupted. This approach is shown to be successful through comparison against a set of known rSNPs. The output of this approach, however, is a large list of PWMs ranked by the log ratio of the score P-values. Unfortunately in this case, there is no clear way of an appropriate cutoff point to distinguish true and false prediction. This makes interpretation of results difficult, especially when screening large numbers of SNPs.
In this article, we propose a new technique for in silico rSNP detection (called is-rSNP). While our approach is similar to that of Manke et al. (2010), there are some essential differences. Notably, our approach yields predictions with statistical significance, facilitating interpretable screening across and comparison between large numbers of SNPs. Rather than an affinity score Manke et al. (2010), we use scores generated from the PWM directly. This facilitates a simple and efficient approach for calculating the distribution PWM scores via direct computation of convolution. This method also allows the computation of distributions of P-value ratios. By obtaining this distribution, we are able to determine the significance of a single base change on the binding affinity of a TF, rather than simply report the ratio of P-values as in Manke et al. (2010). By associating a P-value with the ratio, we can satisfactorily determine smaller, significant sets of predicted disrupted TF binding sites and provide significance scores of results across a large number of SNPs. We have tested our method on 41 rSNPs, where there is experimental evidence showing that the SNP causes a disruption of a TF binding site. We correctly predict the affected TF within our significant predictions in 28 of 41 cases, and in 12 cases the violated PWM matching the TF is the most significant prediction. Furthermore, we have used our algorithm to screen 146 disease-associated SNPs that had been previously been reported as ‘intergenic’, but with little understanding of their functional impact. Eleven SNPs were predicted to have a significant (P < 0.01) change on at least one PWM, and out of these, nine of the affected TFs were previously known to have a functional role in causing the disease phenotype in the literature. [These and other P-values in this article are corrected by Benjamini–Hochberg procedure for multiple testing (BH corrected, Benjamini and Hochberg (1995).] This provides strong evidence that our method is successful in identifying rSNPs that have a functional impact on the disease and is suitable for screening large numbers of SNPs. Such an approach is an efficient and cost-effective method for interpretation of GWAS results.
2 METHODS
2.1 Algorithm overview
We provide a step by step outline of the is-rSNP detection procedure. Following this, we use a single rSNP and single TF PWM as an example to further outline our approach. We first provide an algorithm overview:
Given a PWM, score the sequences for Allele 1 and Allele 2. Calculate the distribution of all scores generated by the PWM and assign a P-value to each allele score. If the highest score out of the two alleles is significant (P < 0.001) then the TF represented by the PWM is considered likely to be bound. Proceed to Step 2. If not significant, jump to Step 3.
Calculate the ratio between the two P-values. Generate the distribution of all ratios for the given PWM. If the ratio is significant (P < 0.01) compared to random then consider the current SNP a candidate rSNP.
Repeat Step 1 for each PWM in the database.
Repeat Steps 1 to 3 for each SNP input to is-rSNP.
To clarify further, we provide an example of Steps 1 and 2 using a rSNP known to violate an OCT-binding sequence (Demars et al., 2010). In this study, the TF binding site reported to be violated by the rSNP is bound by OCT4. There is, however, no PWM for OCT4 in TRANSFAC. In this case, we will consider PWMs for any of the OCT proteins to be a positive match, as they generally have similar DNA recognition sites. In fact, in this article we will consider a positive PWM hit to match any protein with the family (i.e. a positive hit for a STAT1 binding protein could be a PWM for STAT3). For this example, we will use the PWM for OCT1. Figure 1a shows a graphical representation of a PWM for OCT1. This is known as a logo (Crooks et al., 2004) and represents the set of DNA binding sites recognized by OCT1. The height at each position represents the conservation of that position in terms of bits and the height of each letter represents the frequency of observing that base in that position in the binding site. For example, position 8 always has a T whereas position 11 may have an A or T. rSNPs that change a base at a conserved position are much more likely to disrupt TF binding than those that change a base at a less conserved position. As the conservation at each base is encapsulated in a PWM, by scoring each allele with a PWM we can observe the change in score and hence the change in binding affinity of the TF. Figure 1b shows the sequences for a rSNP associated with fetal growth disorder. The top sequence is the wildtype and the bottom is mutated at position 8 in the disease. In the study (Demars et al., 2010), OCT4 is shown to be bound to the wildtype sequence, but not bound in the mutated sequence. This change at position 8 from T to a C (Fig. 1b), changes the PWM score for OCT1 from 550 to 495. While these scores do not mean much on their own, by looking at the entire distribution of scores generated by the PWM (Fig. 1c), we can begin to model the score difference statistically. Figure 1c shows that the allele 1 (T) score resides in the tail of the distribution of observed scores and is therefore likely to be bound by OCT1. In fact, the probability of observing a higher score is P < 0.0001. The probability of observing a higher score than allele 2 is an order of magnitude less at P < 0.001. However, what we would like to know is if this difference is significant. Looking at Figure 1c, these scores do not seem to be different, however, by altering the y-axis to a log scale, this difference appears to be significant (Fig. 1d). We can in fact test this statistically. As the P-value for each score is representative of the rank of the score within the distribution of all scores, we can take the ratio of the P-values as a single measurement of the difference in binding affinity between two alleles. Furthermore, we can compute the distribution of all ratio's of P-values for all possible SNPs, and then determine the significance of the observed ratio (probability of observing a higher ratio). In this example, the observed ratio has P < 0.001, therefore we conclude that an OCT1 binding site is violated by this SNP.
Fig. 1.

This figure provides an example of the data used at each step of the is-rSNP algorithm applied to a fetal growth disorder rSNP. (a) Logo for OCT1. (b) Two binding sites for OCT1 containing a SNP: Allele 1, position 8 = T (top); Allele 2, position 8 = C (bottom). (c) Distribution of scores generated by OCT1 PWM and observed scores for Allele 1 (A1) and Allele 2 (A2). (d) Distribution of scores generated by OCT1 PWM and observed scores for Allele 1 and Allele 2, y-axis log scale.
2.2 Algorithm details
Given a PWM for a TF, if we assume that the current SNP under consideration is an rSNP, then we would like to determine the most likely position in which the TF is bound across the SNP. Therefore, we use a sliding window approach to step across the SNP at each position equal to the width of the PWM, and considering the maximum score output by the PWM to be the likely binding site. For each window encompassing the SNP, we compute the change in the affinity of binding according to the preselected PWM and then estimate the significance of this change. The method of allocating of the significance is critical and requires a few design choices to be made. We explain the idea in the simplified setting of DNA sequence being iid drawn from the uniform distribution on the space of the four bases first, then we highlight changes required for a more realistic setting when there is a bias in the sequence composition. Finally, we describe computational algorithms which allow for a robust implementation of the whole procedure.
Given a fixed PWM, the first step is to calibrate its scores. The calibration consists in allocation of the rank to each score in the sequence of all possible PWM scores (for every possible setting for the DNA sequence), sorted from the highest to the lowest value. Next, given two scores, for different values of the SNP base, we find the ratio of those ranks. This ratio is again rank-calibrated in the space of all possible such ratios for the PWM in question and for all possible SNP variations. This final rank is converted to the value between 0 and 1, by dividing it by the total number of such ratios.
The above procedure needs some adjustment if we are to take into account the biases in the distribution of bases. The simple counting procedures need to be replaced by the respective cumulative distributions, equivalent to the counting in the uniform case. Also, due to the large number of possible base combinations and some of the small values of extreme probabilities, it is convenient to use logarithms, so the ratio to rank calibrated ranked scores becomes a difference of logs of cumulated probabilities. These are some minor issues, the major challenge is to design a computational procedure which allow for robust quantification of the tails of distributions in question, which cannot by computed directly by naive implementation or even estimated by Monte Carlo simulation. Fortunately, we show that they are computable in a rigorous, though indirect form.
2.3 Generating the distribution of all PWM scores
Let us consider a PWM, w = [w(j, i)]4×n and its score
| (1) |
for the n-tuple 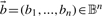 , where 𝔹≔{1, 2, 3, 4} ≡ {A, C, G, T} represents the space of four DNA bases. Assuming a prior probability distribution p(b), b = 1,…,4 on 𝔹 and each nucleotide bi sampled independently from 𝔹, we view the score
  as a random variable (RV) on 𝔹n with the product probability distribution.
With a rounding and appropriate affine transformation of the weights, the computation of the distribution of Sn is reducible to the special case of non-negative integer weights (Supplementary Materials)
In general, the computation of the distribution of the score (1) is known to be an non-deterministic polynomial-time (NP)-hard problem, subsuming the standard NP-hard benchmark of ‘sum of the subset’ (Touzet and Varre, 2007). However, in our special case of integer values of finite magnitude it has linear complexity (Pisinger, 1999) and this is what we are leveraging here.
Now we concentrate on determination of distribution of RV Sn:
| (2) |
where x ∈ {0, 1, 2,…, nU}, the sum is over all  such that
and p*,n(x)≔0, if no such  exists.
The sum (2) involves 4n terms, which in the case of larger motifs, say n = 30, results in the number 4n ≈ 1018 of terms being too many for a naive, direct computation. However, the whole evaluation simplifies if performed recurrently. Namely, for the distribution of the partial sum of the first j terms, we have:
| (3) |
for 2≤j≤n. This allows for efficient evaluation of p*,n by finding first all intermediate distributions p*,j, j = 1,…, n − 1. The whole computation can be performed with ≤2n(U + 1)(n + 2) multiplications and twice as many additions and with minimal memory requirement of n(U + 1) registers for the storing the values of the distribution. For completeness, we present the explicit algorithm in the Supplementary Materials.1
2.4 Generating the distribution of the ratio of two calibrated PWM scores
Knowledge of the distribution of Sn allows us to calibrate the scores using their P-values x ↦ P[Sn ≥ x]. This is a form of ranking of all the possible score values, from the highest to the lowest, accounting for the varying probability of different scores being attained with different frequency. It is convenient to introduce the following ‘log-rank’ function:
| (4) |
for any x ∈ {0, 1,…, nU}.
In the case of a SNP changing the i-th nucleotide bi of  to c, we may observe a significant change in the score (1) from
  to
to
reflected in the change of log-rank:
This may signify a rSNP, but the change needs to be calibrated in order to assess its significance. To that end, we evaluate the distribution of the RV of all possible single base changes:
where nucleotides b1,…, bn, c1, c2 are drawn independently from 𝔹 according to our prior distribution and position i is drawn uniformly from {1,…, n}.
Note that for every v ∈ ℝ, we have
 |
(5) |
where the third sum is over values x ∈ { 0, 1,…, (n − 1)U} such that
and p*,n\i is the distribution of scores of ∑j≠iw(bj, j) of the PWM with i-th column neglected, which can be easily computed by a straightforward adaptation of the recurrence (3). (The probability ≔0 if no such x exists.)
Our final algorithm computes the distribution of Δρ with granularity δ>0, see Supplementary Materials for details. For δ = 0.01 and the whole TRANSFAC v2009.4 database of approximately 1300 PWMs, this computation can be completed in under 4 h on a single CPU machine and only needs to be computed once.
3 RESULTS
We evaluated the performance of is-rSNP on two types of data. First, we compiled a set of 41 known rSNPs [4 from the literature and 37 from OregAnno (Montgomery et al., 2006)] for which there was empirical evidence showing the impact of the allelic variation on the binding of a functionally critical TF. We ran is-rSNP on each of these SNPs to see if the correct TF was identified. We also analysed the same data using sTRAP (Manke et al., 2010) and compared the output with is-rSNP. Secondly, we extracted 146 disease-associated SNPs from the published catalogue of GWASs (Hindorff et al., 2010) that had been classified as ‘intergenic’, and screened them for potential rSNPs. The goal here was to see if the TF predicted by is-rSNP as being disrupted had prior evidence of being associated with the disease. If this association was present, it would suggest that our predicted rSNPs are likely to have a functional impact on the disease via a disease-associated TF. Note: a comparison with sTRAP was not done using this data as the lack of statistical significance associated with predictions output by sTRAP makes it unsuitable for this type of analysis.
3.1 Evaluating is-rSNP using known rSNPs
Table 1 shows the results of applying is-rSNP to four different rSNPs. Each of these rSNPs has previous empirical evidence to show that the nucleotide variation disrupts the binding of a particular TF. is-rSNP was used to screen each SNP with all human PWMs in the TRANSFAC (Matys et al., 2006) database. This resulted in a ranked list of PWMs that have a significant change in PWM score between the alleles. For each rSNP, the predictions were thresholded at BH corrected P < 0.05 and are reported in Table 1. In each of four cases there is a match between the predicted disrupted TF and the TF reported to be disrupted in the original studies (highlighted in bold). In the case of the fetal growth disorder rSNP (Demars et al., 2010), and the blood pressure regulation rSNP (Funke-Kaiser et al., 2003), the most significant hit matches the reported TF. An interesting point to note is that there are multiple positive hits for Oct1, Ap2 and E2F. This is due to the fact that many matrices are similar for the same TF family. These multiple matrices provide additional evidence for a bona fide binding site. In addition to these four rSNPs, we also analysed 37 known rSNPs extracted from OregAnno (Montgomery et al., 2006). Out of those 41 (=4+37), 28 SNPs had the matching TF bound (PWM score P < 0.001 BH corrected) to one of the alleles, and in each of these cases a significant (P < 0.05, BH corrected) change in binding score was predicted by is-rSNP. Therefore, is-rSNP correctly identified 28 out of the 41 known rSNPs.
Table 1.
This table shows the results of applying is-rSNP to four known rSNPs
| rSNP: | AF125183:6153 | chr1:208055893 | chr4:74825920 | chr1:21489833 | ||||||||
|---|---|---|---|---|---|---|---|---|---|---|---|---|
| Study: | Demars et al. (2010) | Rahimov et al. (2008) | Hacking et al. (2004) | Funke-Kaiser et al. (2003) | ||||||||
| Disease/Trait: | Fetal growth disorder | Cleft lip | RSV-induced bronchiolitis | Blood pressure regulation | ||||||||
| Disrupted TF: | OCT4 |
AP-2α |
CEBPβ |
E2F2 |
||||||||
| is-rSNP output | Matrix | TF | P-value | Matrix | TF | P-value | Matrix | TF | P-value | Matrix | TF | P-value |
| 1 | M00135 | Oct-1 | 0.0002 | M01208 | FLI1 | 0.0001 | M01361 | HOXC10 | 0.0016 | M00426 | E2F | 0.0011 |
| 2 | M00248 | Oct-1 | 0.0006 | M00032 | c-Ets-1 | 0.0005 | M01256 | REST | 0.0017 | M00068 | HEN1 | 0.0013 |
| 3 | M01476 | POU2F3 | 0.0006 | M00074 | c-Ets-1 | 0.0006 | M01329 | HOXC11 | 0.0021 | M00965 | LXR | 0.0014 |
| 4 | M00332 | Whn | 0.0010 | M00453 | IRF-7 | 0.0009 | M00109 | CEBPβ | 0.0340 | M00058 | HEN1 | 0.0015 |
| 5 | M00138 | Oct-1 | 0.0017 | M00261 | Olf-1 | 0.0012 | – | – | – | M00427 | E2F | 0.0026 |
| 6 | M01195 | TBX22 | 0.0018 | M00007 | Elk-1 | 0.0013 | – | – | – | M00193 | NF-1 | 0.0027 |
| 7 | M00464 | POU3F2 | 0.0023 | M00341 | GABP | 0.0021 | – | – | – | M00766 | LXR | 0.0035 |
| 8 | M01262 | TBX18 | 0.0024 | M01045 | AP-2α | 0.0021 | – | – | – | M00056 | myogenin | 0.0047 |
| 9 | M00342 | Oct-1 | 0.0030 | M00467 | Roaz | 0.0024 | – | – | – | M01242 | MTF1 | 0.0050 |
| 10 | M00704 | TEF-1 | 0.0065 | M00800 | AP-2 | 0.0026 | – | – | – | M00425 | E2F | 0.0059 |
| 11 | – | – | – | – | – | – | – | – | – | M00050 | E2F | 0.0062 |
| 12 | – | – | – | – | – | – | – | – | – | M00738 | E2F-4:DP-1 | 0.0087 |
| 13 | – | – | – | – | – | – | – | – | – | M00751 | AML1 | 0.0104 |
| 14 | – | – | – | – | – | – | – | – | – | M00740 | Rb:E2F-1:DP-1 | 0.0122 |
| 15 | – | – | – | – | – | – | – | – | – | M00516 | E2F | 0.0133 |
| 16 | – | – | – | – | – | – | – | – | – | M00918 | E2F | 0.0139 |
| 17 | – | – | – | – | – | – | – | – | – | M01200 | CTCF | 0.0264 |
Successful matches between the predicted TF and the TF reported to be disrupted in the original studies are highlighted in bold. Only is-rSNP predictions BH corrected P<0.05 are reported for each rSNP.
Using the 41 known rSNPs, we aimed to compare the utility of the output of is-rSNP versus sTRAP. To do this we compared the rank of the first correct prediction in the lists output by each algorithm for each SNP. The idea here is that the closer a correct prediction is to the top of the output list, the easier and more efficient it is to interpret and test predictions experimentally. (Note the webserver of sTRAP uses a different version of TRANSFAC which may interfere with the comparison; however, due to the previous version of TRANSFAC not being available, we reasoned that as we were comparing the utility of predictions from a user point of view, it was still sufficient to make a comparison.) We first compared the output of both algorithms on only the 28 SNPs having scores with P < 0.05 for correct prediction. Figure 2 shows that is-rSNP consistently predicts the correct TF at a better rank than sTRAP over the 28 SNPs (P < 0.01, Mann–Whitney U-test).
Fig. 2.

This figure compares output of is-rSNP and sTRAP after analysis of 28 known rSNPs filtered for significant TF binding, i.e. having a PWM score with P ≤ 0.001 for one of the alleles for the matching TF. In addition, the output of a modified version of is-rSNP with no filtering of significant PWM binding sites and P-value thresholding is compared with sTRAP output on 41 known rSNPs. In this graph, smaller values are better. The black line represents the mean value of the top-ranked correct predictions, the box edges represent the first and third quartile and the whiskers extend to the most extreme observation. In addition, each data point is plotted beneath its respective box plot, with jitter. Note that the x-axis is log scale.
We next wanted to compare the performance of is-rSNP and sTRAP without a P-value threshold and without binding site filtering (removing the requirement of the TF having to be significantly bound to at least one of the SNP sequences). This allowed comparison over all 41 SNPs. Figure 2 shows that is-rSNP outputs predictions at a better average rank than sTRAP over the 41 SNPs, albeit not consistently better (P = 0.13, Mann–Whitney U-test). From this we can conclude that main advantage of is-rSNP lies in both the filtering of significant TF binding sites and its ability to provide consistently more interpretable output through P-value thresholding. Moreover, a P-value rank has two main advantages over the log-ratio rank used by sTRAP: first, a log-ratio ranked list does not provide a sensible point of cutoff with respect to expected numbers of false positives, whereas a P-value allows a cutoff with a known expected number of false positives; secondly, a P-value associated with each log-ratio facilitates interpretable output for multiple rSNP scanning. Using a P-value means that predictions across multiple SNPs can be combined into a single ranked list. This makes is-rSNP suitable for large-scale SNP screening.
3.2 Searching for candidate rSNPs in a database of disease-associated SNPs
The published catalogue of GWASs (Hindorff et al., 2010) contains a summary of disease-and trait-associated SNPs reported in the literature. Many of these, while shown to be strongly associated with the disease or trait, do not have any known functional relationship and are annotated as ‘intergenic’ (not being associated with a gene). It is possible that many of these SNPs are rSNPs. Therefore, we used is-rSNP to predict TF binding sites that are likely to be disrupted using 146 ‘intergenic’ of these disease-associated SNPs. Out of the 146, 11 SNPs were predicted to have a significant (P < 0.01) impact on a TF binding site. These predictions are reported in Table 2. To test if these predictions were likely to be biologically relevant, we looked for evidence in the literature that the TF predicted had prior evidence of being associated with the disease. Of the 11 predicted rSNPs, 8 showed prior evidence that the disrupted TF plays a role in the disease. In addition, we also used expression profiling of each of the diseases, to see if genes differentially expressed in the disease were enriched for binding sites of the predicted TF (See Supplementary Materials for details). The enrichment, if shown, would provide additional evidence that the predicted TF plays a critical role in the disease and the rSNP is therefore likely to be the causal SNP. In seven cases, genes differentially expressed in the disease had binding site enrichment for the disrupted TF.
Table 2.
This table provides a summary of the results output when is-rSNP was used to identify candidate rSNPs in a set of intergenic disease-associated SNPs
| Disease/Trait | SNP | Variation (Normal/Disease or Common/Rareb) | Causes Gain/Loss of TFBS | Matrix | Predicted TF | Score change P-value (BH corrected) | Prior evidence of predicted TF implicated in disease | TFBS enrichment P-value in disease-associated genes |
|---|---|---|---|---|---|---|---|---|
| ALL (childhood) | rs11155133 | A/G | Gain | M00159 | C/EBP | 0.0075 | Koschmieder et al. (2009) | 0.1348 |
| AIDS | rs4118325 | A/G | Loss | M00069 | YY1a | 0.0023 | Sadowski et al. (2008) | 0.5129 |
| AIDS | rs4118325 | A/G | Loss | M01035 | YY1a | 0.0038 | Sadowski et al. (2008) | 0.5129 |
| Amyotrophic lateral sclerosis | rs16984239 | C/Ab | Gain | M01261 | HNF3A | 0.0445 | 0.7821 | |
| HIV-1 control | rs13394720 | C/Tb | Gain | M00373 | Pax-4 | 0.0047 | 0.9077 | |
| HIV-1 control | rs17027625 | C/Tb | Loss | M00701 | SMAD3 | 0.0087 | Eldeen et al. (2006) | 0.7292 |
| Major CVD | rs499818 | G/Ab | Loss | M01197 | ELF5 | 0.0074 | 0.3752 | |
| Parkinson's disease | rs1480597 | G/Ab | Loss | M01224 | P50:RELA-P65 | 0.0064 | Wintermeyer et al. (2002) | 0.0282 |
| Parkinson's disease | rs1480597 | G/Ab | Loss | M00007 | Elk-1 | 0.0070 | Iwata et al. (2001) | 0.0028 |
| Prostate cancer | rs16901979 | C/A | Loss | M01591 | Tal-1 | 0.0088 | Ellett et al. (2009) | 0.0190 |
| Schizophrenia | rs9512730 | G/Cb | Gain | M00469 | AP−2alphaa | 0.0028 | Duan et al. (2003) | 0.0300 |
| Schizophrenia | rs9512730 | G/Cb | Gain | M00470 | AP-2gammaa | 0.0068 | Duan et al. (2003) | 0.0300 |
| Type 2 diabetes | rs9300039 | A/C | Loss | M00233 | MEF-2 | 0.0090 | McGee and Hargreaves (2006) | 6.1e-08 |
| Ulcerative colitis | rs668853 | A/G | Gain | M01223 | P50:P50 | 0.0011 | Sartor (2006) | 0.0262 |
aAs there are multiple matrices for a single TF, the same TF may be reported for the same SNP. These SNPs show particularly strong evidence for altering the TFBS.
bWhen the risk is allele is not known, the variation is ordered by frequency: common/rare.
Only results that show a significant (BH corrected P < 0.01) change in TF binding affinity between the alleles are included. Columns 1 and 2 provide information about the disease and associated SNP. Columns 3 and 4 state the base change between normal and disease state and whether this results in a loss or gain in binding site. Columns 5–7 outline the TF predicted to be disrupted by the allele and the P-value associated with the change. Column 8, if present, contains a reference to prior evidence that the predicted TF is known to be associated with the disease. The final column provides the P-value of the enrichment of TF binding sites around genes shown to be differentially expressed in the disease, significant values (BH corrected P < 0.05) are highlighted in bold.
4 DISCUSSION
Personalized medicine aspires to develop a panel of targeted drugs that can correct imbalances in biochemical and cell biological processes that lead to disease states. For example, cancers that arise from BRCA1 mutations are specifically prone to PARP inhibitors. To exploit disease-associated SNPs to derive novel drug targets, insight to the mechanistic link between the allelic variation and the disease is required. This link is particularly difficult to derive when a SNP is positioned between genes. Also attenuating progress in the field is the immense difficulty to functionally validate the biological impact of single base substitution in a regulatory element in the genome, as knock-in experiments are very expensive and labour intensive. Thus, identifying in silico means to assess the likelihood of allelic variation to impact the function of a given TF on a specific target gene could accelerate the progress from GWAS to personalized medicine. This work offers to capitalize on the central dogma of transcription regulation, and identify novel links between targetable TFs and disease states, if their cognate binding to critical targets in the genome is affected by the DNA sequence variation. We show here that it is possible with high degree of confidence to identify novel TF-disease links through the comparison of the allelic variation with the sequence constraints of all known TFs. Beyond reproducing 28 validated cases, we further identify 11 such links (Table 2, threshold P < 0.01), from among 146 published disease-associated SNPs, 8 for which the disrupted TF is reported to be associated with the disease in the literature. Following on from these significant predictions, further rSNPs for the same disease and same TF can be identified (YY1:AIDS/HIV, OCT1:Asthma, Supplementary Table 1, threshold P < 0.05). This is a proof of principle that the aim of is-rSNP is achievable, however, we envisage a few improvements to is-rSNP that would increase its value significantly.
Only 5 of the 11 SNPs in Table 2 showed both forms of evidence of the predicted disrupted TF being associated with the disease. This is not unexpected as most of the GWAS studies use bulk genotyping arrays, therefore it is likely that the reported disease-associated SNP is not in fact the causative SNP, but rather belongs to the same linkage-disequilibrium block as the causative SNP. In this case, it may be sensible to process not only the disease-associated SNP with is-rSNP, but neighbouring SNPs as well. As mentioned previously, many of the matrices in TRANSFAC are similar or duplicated amongst TFs and TF families. This results in severe multiple testing correction to P-values when scanning multiple SNPs with a database of PWMs. If a non-redundant database can be used, this may result in many more significant rSNP predictions. Also, the method could be employed on more empirically derived TF-binding datasets than TRANSFAC (Matys et al., 2006), such as ChIP-Seq data, or a panel of 500 protein bound DNA elements, derived from in vivo by digital genomic footprinting (Hesselberth et al., 2009). Focusing on regions of chromatin histone modifications, potentially indicative of regulatory modules (Hon et al., 2009; Visel et al., 2009; Won et al., 2009), may also improve predictions. For example, we found that of the 11 disease-associated SNPs reported in Table 2, 9 are overlapping with tri-methylated lysine 27 of histone H3, a histone mark that represents chromatin silencing events, related to progenitor–differentiation axis, and regulated by polycomb group proteins. This unexpected result may represent some so far unappreciated gradient of penetrance of alleles, based on their chromatin accessibility, such as the case with imprinting, where only one of the copies of DNA is available to TF binding (and the impact of a rare allele on phenotype would be pseudo haplotype). Whatever the mechanistic basis for the H3K27Me3 link with disease-associated intergenic SNPs, this information may become useful for future versions of is-rSNP and for genotyping projects that use massively parallel sequencing. The data we present here offers numerous novel links between known, and in most cases targetable, TFs and specific cohorts of patients for defined disease, each of which becomes a hypothesis basis for novel clinical trials of personalized medicine. In addition, a major contingency in the interpretation of intergenic SNPs, which is the identification of the target gene responsible for the control of the disease, may be assisted by the knowledge of which TF binding is affected by the rSNP. Within any region in the genome among neighbouring genes there is likely a known target of a TF, implicating that target gene in the control of the disease, even when there is a large distance between the rSNP and the target (Fullwood et al., 2009). Of course further validation of the methodology is required before patients are addressed with novel drugs, but the method clearly deserves more investigation and development. In its current form, it is suitable for screening large sets of potential rSNPs, and provides output which can be interpreted with an idea of the statistical significance of each predicted rSNP.
Funding: Grants 586649 NHMRC grants BC084667 US DoD BCRP (to I.H.); grants 566882 Cancer Australia (to I.H.); grants BCTR0707358 Komen for the Cure (to I.H.); grants 509292 NBCF (to I.H.); NICTA (to A.K. and partial to G.M., J.B.); NICTA is funded by the Australian Government's Department of Communications, Information Technology and the Arts, the Australian Research Council through Backing Australia's Ability, and the ICT Centre of Excellence programs. Australian Postgraduate Award and a NICTA Research Project Award (to G.M.).
Conflict of Interest: none declared.
Footnotes
REFERENCES
- Andersen MC, et al. In silico detection of sequence variations modifying transcriptional regulation. PLoS Comput. Biol. 2008;4:e5. doi: 10.1371/journal.pcbi.0040005. [DOI] [PMC free article] [PubMed] [Google Scholar]
- Benjamini Y, Hochberg Y. Controlling the false discovery rate: a practical and powerful approach to multiple testing. J. R. Stat. Soc. Ser. B (Methodol.) 1995;57:289–300. [Google Scholar]
- Claverie J, Audic S. The statistical significance of nucleotide position-weight matrix matches. Bioinformatics. 1996;12:431. doi: 10.1093/bioinformatics/12.5.431. [DOI] [PubMed] [Google Scholar]
- Crooks GE, et al. WebLogo: a sequence logo generator. Genome Res. 2004;14:1188–1190. doi: 10.1101/gr.849004. [DOI] [PMC free article] [PubMed] [Google Scholar]
- Demars JD, et al. Analysis of the IGF2/H19 imprinting control region uncovers new genetic defects, including mutations of OCT-binding sequences, in patients with 11p15 fetal growth disorders. Hum. Mol. Genet. 2010;19:803–814. doi: 10.1093/hmg/ddp549. [DOI] [PubMed] [Google Scholar]
- Duan J, et al. Polymorphisms in the 5[prime]-untranslated region of the human serotonin receptor 1B (HTR1B) gene affect gene expression. Mol. Psychiat. 2003;8:901–910. doi: 10.1038/sj.mp.4001403. [DOI] [PubMed] [Google Scholar]
- Eldeen MB, et al. MH2 domain of smad3 reduces HIV-1 tat-induction of cytokine secretion. J. Neuroimmunol. 2006;176:174–180. doi: 10.1016/j.jneuroim.2006.04.004. [DOI] [PubMed] [Google Scholar]
- Ellett F, et al. The role of the ETS factor erg in zebrafish vasculogenesis. Mech. Dev. 2009;126:220–229. doi: 10.1016/j.mod.2008.11.001. [DOI] [PMC free article] [PubMed] [Google Scholar]
- Fullwood MJ, et al. An oestrogen-receptor-alpha-bound human chromatin interactome. Nature. 2009;462:58–64. doi: 10.1038/nature08497. [DOI] [PMC free article] [PubMed] [Google Scholar]
- Funke-Kaiser,H., et al. Differential binding of transcription factor E2F-2 to the endothelin-converting enzyme-1b promoter affects blood pressure regulation. Hum. Mol. Genet. 2003;12:423–433. doi: 10.1093/hmg/ddg040. [DOI] [PubMed] [Google Scholar]
- Hacking D, et al. Increased in vivo transcription of an IL-8 haplotype associated with respiratory syncytial virus disease-susceptibility. Genes Immun. 2004;5:274–282. doi: 10.1038/sj.gene.6364067. [DOI] [PubMed] [Google Scholar]
- Hesselberth JR, et al. Global mapping of protein-DNA interactions in vivo by digital genomic footprinting. Nat. Meth. 2009;6:283–289. doi: 10.1038/nmeth.1313. [DOI] [PMC free article] [PubMed] [Google Scholar]
- Hindorff L, et al. A catalog of published Genome-Wide association studies. 2010 Available at http://www.genome.gov/gwastudies (last accessed date April, 2010) [Google Scholar]
- Hon G, et al. Discovery and annotation of functional chromatin signatures in the human genome. PLoS Comput. Biol. 2009;5:e1000566. doi: 10.1371/journal.pcbi.1000566. [DOI] [PMC free article] [PubMed] [Google Scholar]
- Iwata A, et al. alpha-Synuclein forms a complex with transcription factor elk-1. J. Neurochem. 2001;77:239–252. doi: 10.1046/j.1471-4159.2001.t01-1-00232.x. [DOI] [PubMed] [Google Scholar]
- Koschmieder S, et al. Dysregulation of the C/EBP differentiation pathway in human cancer. J. Clin. Oncol. 2009;27:619–628. doi: 10.1200/JCO.2008.17.9812. [DOI] [PMC free article] [PubMed] [Google Scholar]
- Manke T, et al. Quantifying the effect of sequence variation on regulatory interactions. Hum. Mutat. 2010;31:477–483. doi: 10.1002/humu.21209. [DOI] [PubMed] [Google Scholar]
- Matys VM, et al. TRANSFAC and its module TRANSCompel: transcriptional gene regulation in eukaryotes. Nucleic Acids Res. 2006;34:D108–D110. doi: 10.1093/nar/gkj143. [DOI] [PMC free article] [PubMed] [Google Scholar]
- McGee SL, Hargreaves M. Exercise and skeletal muscle glucose transporter 4 expression: molecular mechanisms. Clin. Exp. Pharmacol. Physiol. 2006;33:395–399. doi: 10.1111/j.1440-1681.2006.04362.x. [DOI] [PubMed] [Google Scholar]
- Montgomery SBM, et al. ORegAnno: an open access database and curation system for literature-derived promoters, transcription factor binding sites and regulatory variation. Bioinformatics. 2006;22:637–640. doi: 10.1093/bioinformatics/btk027. [DOI] [PubMed] [Google Scholar]
- Pisinger D. Linear time algorithms for knapsack problems with bounded weights. J. Algorithms. 1999;33:1–14. [Google Scholar]
- Ponomarenko JV, et al. rSNP_Guide, a database system for analysis of transcription factor binding to target sequences: application to SNPs and site-directed mutations. Nucleic Acids Res. 2001;29:312–316. doi: 10.1093/nar/29.1.312. [DOI] [PMC free article] [PubMed] [Google Scholar]
- Rahimov F, et al. Disruption of an AP-2[alpha] binding site in an IRF6 enhancer is associated with cleft lip. Nat. Genet. 2008;40:1341–1347. doi: 10.1038/ng.242. [DOI] [PMC free article] [PubMed] [Google Scholar]
- Sadowski I, et al. Factors controlling chromatin organization and nucleosome positioning for establishment and maintenance of HIV latency. Curr. HIV Res. 2008;6:286–295. doi: 10.2174/157016208785132563. [DOI] [PubMed] [Google Scholar]
- Sartor RB. Mechanisms of disease: pathogenesis of Crohn's disease and ulcerative colitis. Nat. Clin. Pract. Gastroenterol. Hepatol. 2006;3:390–407. doi: 10.1038/ncpgasthep0528. [DOI] [PubMed] [Google Scholar]
- Touzet H, Varre J-S. Efficient and accurate p-value computation for position weight matrices. Algorithms Mol. Biol. 2007;2:15. doi: 10.1186/1748-7188-2-15. [DOI] [PMC free article] [PubMed] [Google Scholar]
- Visel A, et al. ChIP-seq accurately predicts tissue-specific activity of enhancers. Nature. 2009;457:854–858. doi: 10.1038/nature07730. [DOI] [PMC free article] [PubMed] [Google Scholar]
- Wintermeyer P, et al. Mutation analysis and association studies of nuclear factor-kappaB1 in sporadic parkinson's disease patients. J. Neural Transm. 2002;109:1181–1188. doi: 10.1007/s00702-001-0688-x. [DOI] [PubMed] [Google Scholar]
- Won K, et al. An integrated approach to identifying cis-regulatory modules in the human genome. PLoS ONE. 2009;4:e5501. doi: 10.1371/journal.pone.0005501. [DOI] [PMC free article] [PubMed] [Google Scholar]