Abstract
To elucidate the roles of visual areas V1 and V2 and their interaction in early perceptual processing, we studied the responses of V1 and V2 neurons to statically displayed Kanizsa figures. We found evidence that V1 neurons respond to illusory contours of the Kanizsa figures. The illusory contour signals in V1 are weaker than in V2, but are significant, particularly in the superficial layers. The population averaged response to illusory contours emerged 100 msec after stimulus onset in the superficial layers of V1, and around 120–190 msec in the deep layers. The illusory contour response in V2 began earlier, occurring at 70 msec in the superficial layers and at 95 msec in the deep layers. The temporal sequence of the events suggests that the computation of illusory contours involves intercortical interaction, and that early perceptual organization is likely to be an interactive process.
When viewing the Kanizsa display shown in Fig. 1a, we perceive the borders of a square even in regions of the image where there is no direct visual evidence for them. This is one example of the phenomenon of illusory or subjective contours (1). This perceptual phenomenon has been reported by von der Heydt and colleagues (2, 3) to possess a direct physiological correlate in macaque area V2, where some neurons were found to respond to an illusory contour moving across their receptive fields. In contrast, they failed to observe responses to illusory contours in area V1. The apparent absence of illusory-contour responses in area V1 is puzzling both because there are recurrent pathways from V2 to V1 and because interaction between modules is a key feature of many models for early perceptual organization (4–7). Moreover, other groups have shown that neurons in area V1 do detect subjective contours defined indirectly in other ways, for example by the fracture line where lines or out of phase sine wave gratings abut (8, 9). Because of the nature of their stimuli, these studies (8, 9) did not resolve the question of whether their results would apply to the illusory contours as studied by Von der Heydt and colleagues. In light of these considerations, we decided to reexamine the issue of neural responses to illusory contours in areas V1 and V2. By using a technique designed to call attention to the illusory square and employing a static display that allowed tracking the temporal evolution of responses, we have found that neurons in area V1 do respond to illusory contours, although at a latency greater than that in V2.
Figure 1.
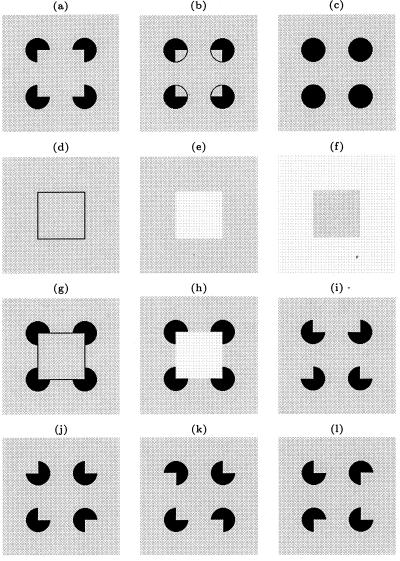
Stimulus set used in the experiment. (a) Kanizsa figure made up of four corner discs (pac-men). (b) Amodal figure (a gray square in a black background partially occluded by a foreground surface with four apertures). (c) Four circular discs. (d) Line square. (e) White square. (f) Gray square. (g) Line Square with four corner discs. (h) White square with four corner discs. (i–l) Various configurations of the rotated corners. According to Kanizsa's definition, amodal presence refers to the completion of part of an object that is not directly visible because it is covered by another object. In b, we can see a gray square against a black background behind a gray wall with four apertures. The amodal contour of the gray square is not as immediately “visible” as the subjective contour of the Kanizsa figure (a). For a cell selective for horizontal edges, only the bottom horizontal contour and its neighboring positions would be placed on the cell's receptive field in a manner shown in Fig. 2a. For cells with different orientation preference, each of the stimuli was rotated accordingly so that the orientation preference of the cell was aligned with the illusory contour. The five sequences used were: (c, a, c, a), (c, b, c, e), (c, g, c, h), (m, d, m, f), and (i, j, k, l), where the symbols stand for the defined above, and m stands for the gray screen condition. (i, j, k, l) was designed to create the perception that the four corner discs were rotating independently on screen in a single trial. Later on, we also tested a sixth sequence, (c, j, c, l).
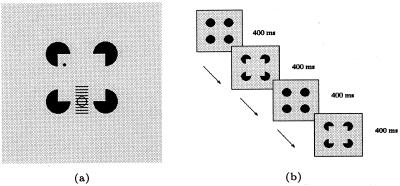
We conducted the following neurophysiological experiment on two awake behaving rhesus monkeys. In each trial, while the monkey was fixating a red dot on the screen within a 0.5° fixation window, a sequence of four stimuli was presented. The presentation of each stimulus in the sequence lasted for 400 msec. On completion of the sequence, the monkey had to make a saccadic eye movement to another red dot that appeared at a random position on the screen to complete the trial. The set of test stimuli included a Kanizsa figure with illusory contours (Fig. 1a) and a variety of control and comparison stimuli (Fig. 1 b–l). The illusory square was 4° × 4° in size. The corner disk (a disk with a V-shaped indentation—pac-man) was 1° in radius. There was, therefore, a 2° gap between the edges of the discs. For each cell, the stimuli were rotated in such a way that the preferred orientation of the cell was parallel to the contour being studied. Over successive trials, one of the illusory contours in the figure was placed at ten different locations relative to the center of the receptive field, 0.25° apart, spanning a range of 2.25°, as shown in Fig. 2a. Fig. 2b illustrates the presentation order of stimuli for the sequence that displayed the Kanizsa square: First, four complete circular discs were presented for 400 msec. Then, they were abruptly transformed into four corner discs, producing the illusion that a square had appeared in front of the four circular discs. We found this manipulation more effective in evoking the illusory contour response than simply presenting four corner discs on the screen in one flash. These two steps were then repeated in the sequence. Control stimuli were presented in the same manner to allow for direct comparison. During any given testing block, the Kanizsa sequences and the four different control sequences (described in Fig. 1 caption) were presented on interleaved trials.
Figure 2.
a illustrates the spatial relationship between the fixation spot (black dot), the cell's receptive field (circle), and the stimulus figure. The cell's receptive field was placed in the middle of the illusory contour at the bottom of the Kanizsa figure, for a cell selective for horizontal orientation. For cells of other orientations, the stimuli were rotated accordingly so that the contour was parallel with the preferred orientation of the cell. The stimulus was presented in ten locations 0.25° apart in successive trials relative to the receptive field so that the illusory contour was collinear with the ten line segments as shown in the figure. b illustrates the presentation of the Kanizsa square sequence, (c, a, c, a), where c is the four circular discs stimulus, and a is the Kanizsa figure made up of four corner discs.
We studied 53 V1 cells and 40 V2 cells from one monkey (monkey A), and 58 V1 cells and 40 V2 cells from a second monkey (monkey B). Recordings were made transdurally with epoxy-coated tungsten electrodes through a surgically implanted well overlying the operculum of area V1. Recording procedures were identical to the ones described in ref. 7. Eye movements were monitored by using implanted scleral search coils and sampled at a rate of 200 Hz. V1 and V2 neurons were recorded from the same wells. Some V2 neurons were recorded from the narrow surface strip next to the V1/V2 border, where a transition from V1 to V2 was marked by a reversal in the progression of receptive fields toward and away from the midline in the visuotopic map, accompanied by an increase in their size. Other V2 neurons were reached by advancing the electrodes past V1. The transition to V2 was accompanied by a sudden shift in the locations of the neurons' receptive fields and by an increase in receptive field size.
The neurons recorded were classified into the following four groups according to cortical depths: V1S, V1D, V2S, and V2D, where S stands for superficial layers and D for deep layers. Cortical depth was estimated primarily from the distance between the recording site and the pial surface. The first 1 mm below the pial surface was considered superficial V1 (V1S). From 1 mm to the white matter was considered deep V1 (V1D). This applied also to the V2 cells that were located in the narrow strip on the surface. For V2 neurons located underneath V1, the first 1 mm beyond the white matter was considered deep V2 (V2D); the next 1 mm of the cortical tissues was considered superficial V2 (V2S).
The receptive field (RF) of each cell was first mapped roughly with a moving bar, and then its receptive field was localized precisely with a small flashing bar. The receptive fields of the cells recorded in both cortical areas were located at 0.6°–4° eccentricity in the lower right quadrant of the visual field. At this eccentricity, the receptive fields of V1 neurons studied ranged from 0.3° to 1°, whereas those of V2 neurons ranged from 0.7° to 2°. As we sought to understand how the same stimuli were processed by the different cortical areas, we did not vary the size of the test stimuli.
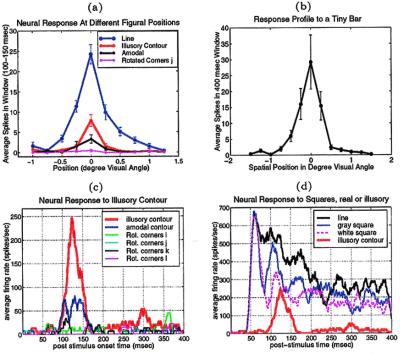
Fig. 3 presents the findings from a V1S neuron. Fig. 3 a and c show that this cell responded significantly more to the illusory contour than to the amodal condition (Fig. 1b) or to all of the rotated corner disk configurations (Fig. 1 i–l). The illusory contour elicited a response when it was placed at precisely the same location at which a real contour elicited the maximum response (Fig. 3a). However, the response to the illusory contour appeared at 100 msec after the appearance of the Kanizsa square, as compared with 45 msec for a real square (Fig. 3d).
Figure 3.
a shows the spatial profile of a V1 neuron's response to the contours of both real and illusory squares, in a temporal window 100–150 msec after the square appeared at different spatial placements relative to the receptive field. This cell responded to the illusory contour when it was at precisely the same location at which a real contour elicited the maximal response. The cell also responded significantly better to the illusory contour than to the amodal contour (t test, p < 0.003), and did not respond to the rotated corner discs. b shows the neuron's response profile to a tiny bar of 0.1° × 0.2° visual angle placed at different positions along the long-axis of the cell, indicating the spatial extent of the cell's receptive field (even when coupled with potential eye movement jitters) is about 1° visual angle when plotted by a small bar. c compares the temporal evolution of this cell's response to the illusory contour, the amodal contour and the various rotated corner disk controls at the location where the real contour elicited the maximum response. The response to the illusory contour emerged at about 100 msec after the illusory square appeared. The cell responded slightly to the amodal and did not respond to any of the rotated corner discs. d contrasts this cell's response to the illusory contour against its response to the real contours of line square (Fig. 1d), white square (Fig. 1e ), and gray square (Fig. 1f). The onset of the response to real contours was at 45 msec, about 55 msec before the illusory contour response.
We characterized a cell's illusory contour responsiveness, or its illusory contour response, by the following two modulation indices: IC1 = (Ri − Ra)/(Ri + Ra) and IC2 = (Ri − Rr)/(Ri + Rr), where Ri is the response to the illusory contour, Ra is the response to the amodal condition, and Rr is the response to the rotated corner disk configuration j (Fig. 1j).§ A cell is considered to exhibit positive illusory contour response if both of its IC1 and IC2 are positive.
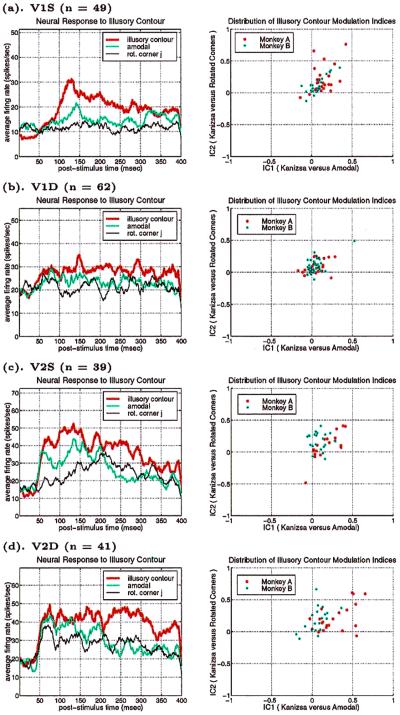
The distributions of IC1 and IC2 (computed based on the responses within the 70–300-msec window after the onset of the second stimulus in each sequence) for the different cell groups are shown in the scatter plots of Fig. 4 (Right). Their population means are listed in Table 1. Although only 14 percent of the V1 cells and 28 percent of the V2 cells exhibited statistically significant illusory contour response individually, the distribution of the modulation indices for the population as a whole showed an overwhelming bias toward positive illusory contour response for both V1S and V2 neurons. We performed a population t test¶ on these distributions and found the population means of the modulation indices to be highly significant across the different groups in the two monkeys (Table 1).
Figure 4.
Population averaged temporal responses of the different cell groups in V1 and V2 (Left) and the scatter plots of their illusory contour modulation indices (IC1 versus IC2; Right). The modulation indices were computed from neuronal responses within the window 70–300 msec after stimulus onset. (a) V1S, n = 49 (27 from Monkey A, 22 from Monkey B); a significant response to the illusory contour emerged at about 100 msec in V1S neurons, as in the case of the individual neuron described in Fig. 3. (b) V1D, n = 62 cells (26 from A, 36 from B). Illusory contour responses in V1D were weak at 125 msec and became slightly more pronounced after 190 msec. (c) V2S, n = 39 cells (18 from A, 21 from B). Illusory contour responses emerged at about 70 msec. (d) V2D, n = 41 cells (22 from A, 19 from B). Illusory contour responses emerged at about 95 msec.
Table 1.
Modulation indices and significance
| Cell groups | No. cells | No. sig. | % Sig. | Pop. IC1 | Pop. IC2 |
|---|---|---|---|---|---|
| A: V1S | 27 | 7 | 26 | 0.19 | 0.31 |
| A: V1D | 26 | 3 | 12 | 0.09 | 0.11 |
| A: V2S | 18 | 4 | 22 | 0.21 | 0.11 |
| A: V2D | 22 | 11 | 50 | 0.28 | 0.24 |
| B: V1S | 22 | 4 | 18 | 0.10 | 0.16 |
| B: V1D | 36 | 2 | 6 | 0.04 | 0.13 |
| B: V2S | 21 | 4 | 19 | 0.08 | 0.12 |
| B: V2D | 19 | 4 | 21 | 0.07 | 0.20 |
First column: A and B stand for monkey A and monkey B, respectively. Second column: The number of cells recorded. Third column: The number of cells whose individual responses to the illusory contour were significantly greater than the responses to both the amodal contour and the rotated discs, with p ≤ 0.05 in a t test. Fourth column: The percentage of the individuals within each group which showed statistically significant illusory contour response. Fifth and Sixth columns: The population means of modulation indices IC1 and IC2 of the groups. They were the averages of the modulation indices computed in the 70–300 msec time window after the onset of the second stimulus in the sequence. The averages were weighted appropriately by the inverse of the variance of the modulation index for each individual cell, as described in footnote §. All the means are statistically significantly greater than zero, with p ≤ 0.00005 in T-test for all cases except the V2S cases, which have p ≤ 0.005 for both monkeys.
Illusory contour response was stronger in V2 than in V1, both at the individual neuronal level and at the population level. Both monkeys taken together, the percentage of V2 neurons that showed significant illusory contour responses (28%)‖ was twice that of V1 neurons (14%). When the cells were subdivided into the superficial and the deep groups, the group with the highest percentage of cells showing illusory contour responses was V2D, followed by V1S, V2S, and V1D. This was consistent with the mean population modulation indices listed in Table 1, as well as the average temporal responses shown in Fig. 4 (Left) for both monkeys. The average temporal response graphs demonstrated that in general the neurons showed a stronger response to illusory contour over the amodal contour and the rotated corners, as well as a stronger response to the amodal contour over the rotated corners. The modulation indices in Table 1 were consistent with this picture, except for an apparent discrepancy in monkey A, whose IC1 indices in V2S and V2D were higher than IC2, suggesting that some cells' responses to the rotated corners were actually stronger than their responses to the amodal contour. This discrepancy was due to the existence of a set of relatively low firing rate neurons that contributed significantly to modulation ratios, but relatively little to the corresponding average firing rates in this monkey.
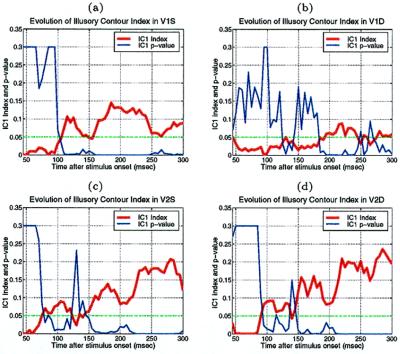
The average temporal response graphs shown in Fig. 4 also reveal the temporal order of emergence of illusory contour response in the different areas. The onset time of the illusory contour response was determined in a statistically rigorous manner as the time at which the response to the illusory contour became significantly different from the responses to the amodal contour (Fig. 5). They were found to be 70 msec, 95 msec, and 100 msec for the V2S, V2D, and V1S neurons, respectively. The onset of illusory response in V1D was uncertain. It was evident in the average population response (Fig. 4b) as early as 125 msec, but it wasn't until 190 msec that it became statistically significant (Fig. 5b). Fig. 5 also reveals that illusory contour response came in waves, with V1 response exhibiting a consistent phase lag relative to the V2 response.
Figure 5.
To estimate the onset time of illusory contour response, we plotted the temporal evolution of the population modulation index IC1 of each group of cells computed within a 30-msec running window at 5-msec steps. The time at which the population modulation index became significantly and consistently positive (i.e., when p dropped below 0.05 in a population t test for at least 50 msec) was determined as the onset of the illusory contour response. In these plots, the p value was set to 0.3 if it was greater than 0.3.
The onset of illusory contour response in V1S cells was considerably later than their responses to real contours (by 55 msec), and was also later than the onset of illusory contour response in V2S (by 30 msec). There are at least two possible explanations for the belated emergence of illusory contour response in V1S relative to V2. The first explanation is that the gap between the corner discs was much larger relative to the V1 receptive fields than to the V2 receptive fields. Hence, V1 circuitry might take a longer time to complete the contour by propagating the edge signals via the known intracortical horizontal collaterals (11). A 55-msec delay seems long, but illusory contour completion could be a rather elaborated computational process that involves many iterations. A second explanation is that V2 neurons, with their more extensive surround receptive fields, can integrate the edge signals from a more global neighborhood, and feedback to V1 to facilitate the contour completion process. Given the existence of both types of anatomical connections, these two mechanisms likely take part synergistically in the illusory contour computation.
In the original experiment of von der Heydt and colleagues (2, 3), they did not notice illusory contour response in V1. A recent study by Bakin and colleagues (12) seems to corroborate their result. The difference between our results and the results of these studies might be due to several factors. Although the illusory gap size of the figures and the eccentricity of the neurons are comparable in the two studies, the mean eccentricity of our neurons was about 2.3°, whereas theirs was 2.0°. Hence, it is possible that the receptive fields of the V1 neurons in our study might be slightly larger than theirs. But the most important factor might be that in our paradigm, the abrupt appearance of the illusory square in front of the four discs already present not only produces a strong percept of occlusion, but also might automatically activate attentional mechanisms; whereas in their paradigm, the entrance of a moving illusory bar into the receptive field was a less salient perceptual event. Moreover, as a way to ensure fixation, they required their monkeys to discriminate a subtle change in the fixation spot. This manipulation might have drawn attention away from the illusory contours. Our use of a prolonged static display might also give the V1 circuitry time to elaborate an illusory contour in a more stationary and stable scenario. The psychological experiment of Rubin and colleagues (13) on abrupt learning suggested that visual awareness and understanding might indeed be important for the perception of illusory figures. Given that the illusory response emerged soon after we introduced the various real square stimuli (Fig. 1 d–h) in the test sequences, and particularly after we made a conscious effort to place the fixation spot either inside or close to the illusory square, visual awareness and attention might have also contributed to the illusory response in V1.
Mendola and colleagues (14) demonstrated that the Kanizsa figures, with the rotated discs as a baseline, can elicit significant responses in the lateral occipital regions in humans in their fMRI study. They also detected some potential subtle responses to subjective Kanizsa figures in early visual areas. But because of the limits on spatial and temporal resolution, it is difficult to compare their results with ours. However, their main finding, coupled with the observations of Huxlin and colleagues (15) that lesion of IT impaired a monkey's ability to see illusory contours, suggests that a higher level extrastriate cortex such as IT plays an important role in illusory figure perception. The crucial question remains whether visual processing progresses simply in a feed-forward manner or in an interactive fashion.
The results reported in this paper support the idea that visual computation is an interactive process (4–7). Our findings demonstrate for the first time that V1 neurons do respond to the subjective contour of a static Kanizsa figure. The illusory contour response in V1 is significantly delayed relative to real contour response, implicating the involvement of lateral or feedback interaction in the contour completion process. The observation that the illusory contour response in V2 precedes that in V1 for the same stimuli lends support to the hypothesis that contour completion in V1 might arise under the feedback modulation from V2.
If V2 neurons are already encoding information about illusory contours (2, 3), what is the advantage of feeding it back to V1? One reason is that V2 neurons' receptive fields are twice the size of V1 neurons at the same spatial location. Hence, V2 neurons can integrate information more globally and compute more abstract information such as three-dimensional depth relationship (12), but at the expense of spatial resolution in their representation. Intercortical feedback of global contour information from V2 would enable the neural circuit in V1 to construct spatially precise and complete contours with information from global scene context.
Acknowledgments
We thank K. Rearick, K. Nakamura, and S. Yu for technical assistance; R. von der Heydt, C. R. Olson, M. Paradiso, and J. Rollenhagen for helpful comments on the manuscript; and R. Kass for advice on statistics. A protocol covering these studies was approved by the Institutional Animal Care and Use Committee of Carnegie Mellon University, in accord with Public Health Service guidelines for the care and use of laboratory animals. This research is supported by National Science Foundation Learning and Intelligent System Grant 9720350 and National Science Foundation Career Award 9984706 (to T.S.L.). Technical support was provided by a National Institutes of Health core grant (EY08098).
Footnotes
Article published online before print: Proc. Natl. Acad. Sci. USA, 10.1073/pnas.031579998.
Article and publication date are at www.pnas.org/cgi/doi/10.1073/pnas.031579998
We chose the rotated corners configuration j as the control reference stimulus for computing IC2 primarily because it was the second step in the control sequence corresponding to the step at which the Kanizsa figure and the amodal figure appeared in their respective sequences. The response to the other configurations of rotated corners was similar to that of j. Initially, we preferred the (i, j, k, l) sequence because it gave the perception that four individual corner discs were rotating independently by themselves in each step. Later, we considered whether it would be more appropriate to use c instead of i as the first stimulus in the control sequence. For 20 cells, we tested the cells' responses to a sixth sequence, (c, j, c, l), and compared them with the responses to the (i, j, k, l) sequence. We found no significant difference in the responses in the j step between the two sequences. The use of i, j rather than c, i did not significantly alter the IC2 values for these cells.
 |
 |
 |
 |
 |
Peterhans and von der Heydt (3) found that 23 of 72 cells in V2 (32%) responded to illusory moving bar and showed reduced responses when the intersecting lines were added. This number is comparable to the number of V2 cells we found to respond to illusory contours (23/80 or 28%).
References
- 1.Kanizsa G. Organization in vision. New York: Praeger; 1979. [Google Scholar]
- 2.von der Heydt R, Peterhans E, Baumgartner G. Science. 1984;224:1260–1262. doi: 10.1126/science.6539501. [DOI] [PubMed] [Google Scholar]
- 3.Peterhans E, von der Heydt R. J Neurosci. 1989;9:1749–1763. doi: 10.1523/JNEUROSCI.09-05-01749.1989. [DOI] [PMC free article] [PubMed] [Google Scholar]
- 4.McClelland J L, Rumelhart D E. Psychol Rev. 1981;88:375–407. [Google Scholar]
- 5.Grossberg S, Mingola E. Percept Psychophys. 1985;38:141–171. doi: 10.3758/bf03198851. [DOI] [PubMed] [Google Scholar]
- 6.Mumford D. Biol Cybern. 1992;66:241–251. doi: 10.1007/BF00198477. [DOI] [PubMed] [Google Scholar]
- 7.Lee T S, Mumford D, Romero R D, Lamme V A F. Vision Res. 1998;38:2429–2454. doi: 10.1016/s0042-6989(97)00464-1. [DOI] [PubMed] [Google Scholar]
- 8.Grosof D H, Shapley R M, Hawken M J. Nature (London) 1993;365:550–552. doi: 10.1038/365550a0. [DOI] [PubMed] [Google Scholar]
- 9.Sheth B R, Sharma J, Rao S C, Sur M. Science. 1996;274:2110–2115. doi: 10.1126/science.274.5295.2110. [DOI] [PubMed] [Google Scholar]
- 10.Caseller G, Berger R L. Statistical Inference. Belmont, CA: Duxbury Press; 1990. pp. 328–330. [Google Scholar]
- 11.Gilbert C. Physiol Rev. 1998;78:467–485. doi: 10.1152/physrev.1998.78.2.467. [DOI] [PubMed] [Google Scholar]
- 12.Bakin J S, Nakayama K, Gilbert C. J Neurosci. 2000;20:8188–8198. doi: 10.1523/JNEUROSCI.20-21-08188.2000. [DOI] [PMC free article] [PubMed] [Google Scholar]
- 13.Rubin N, Nakayama K, Shapley C. Curr Biol. 1996;7:461–467. doi: 10.1016/s0960-9822(06)00217-x. [DOI] [PubMed] [Google Scholar]
- 14.Mendola J D, Dale A M, Fischl B, Liu A K, Tootell R B. J Neurosci. 1999;19:8560–8572. doi: 10.1523/JNEUROSCI.19-19-08560.1999. [DOI] [PMC free article] [PubMed] [Google Scholar]
- 15.Huxlin K R, Saunders R C, Machionini D, Pham H A, Merigan W H. Cereb Cortex. 2000;10:671–683. doi: 10.1093/cercor/10.7.671. [DOI] [PubMed] [Google Scholar]


