

Abstract
Using a mouse neuroblastoma cell line, we have demonstrated that vaccination of tumor-free mice with a cell-based vaccine leads to productive immunity and resistance to tumor challenge, while vaccination of tumor-bearing mice does not. The T cell immunity induced by this vaccine, as measured by in vitro assays, is amplified by the depletion of Treg. Our goal is to understand this barrier to the development of protective cellular immunity. mRNA microarray analyses of CD8+ T cells from naïve or tumor-bearing mice undergoing vaccination were carried out with or without administering anti-CD25 antibody. Gene-expression pathway analysis revealed the presence of CD8+ T cells expressing stem cell-associated genes early after induction of productive anti-tumor immunity in tumor-free mice, prior to any phenotypic changes, but not in tumor-bearing mice. These data demonstrate that early after the induction of productive immune response, cells within the CD8+ T cell compartment adopt a stem cell related genetic phenotype that correlates with increased anti-tumor function.
Keywords: cancer vaccines, neuroblastoma, tumor immunity, cellular immunity, CD8, gene expression profiling, stem cells, GSEA
Introduction
Neuroblastoma is the most common extracranial solid cancer in childhood, accounting for 15% of childhood cancer deaths [1]. Patients with high-risk disease have poor prognoses (<40% long-term survival) despite the use of intensive therapies [2,3]. Therefore, new therapeutic strategies are needed to improve the survival of these patients. Immune therapies to cancer potentially offer specificity with minimal toxicity. These therapies include the administration of monoclonal antibodies, adoptive transfer of immune cells, and tumor vaccines in the form of whole tumor cells, purified proteins or peptides, or gene vectors [4,5]. However, immune therapies for neuroblastoma have proven difficult due to lack of known tumor antigens and inability to identify tumor-responsive CD8+ T cells.
The development of long-term immunity to a particular tumor antigen is dependent on generation of long-lived memory T cells. CD8+ memory T cells have unique properties that make them well suited to respond quickly and effectively during immunotherapy for neuroblastoma. Memory CD8+ cells remain primed for rapid proliferation in response to antigen reemergence, and they maintain mRNA expression of several cytotoxic proteins as well as pro-inflammatory cytokines [6,7]. The factors involved in the development of CD8+ T cell memory responses remain poorly understood. Following recognition of a cognate ligand and appropriate co-stimulatory signals, CD8+ T cells expand into armed effector cells as well as memory cells, though the factors involved and timing of memory development remains elusive. Multiple models have been developed to explain the development of CD8+ T cell memory [8]. It has been reported that the induction of memory T cells is programmed and/or initiated as early as the first day of antigen exposure [9–11].
We have previously reported that a cell-based vaccine for neuroblastoma that transiently expressed CD80, CD86, CD54, and CD137L generated protective immunity in resting mice [12] and following HSCT [13]. The protective immunity was based on both CD8+ and CD4+ T cells and generated tumor-reactive, IFN-γ producing T cells in the spleens of vaccinated mice. Anti-CD25 therapy is known to deplete and functionally inactivate CD4+CD25+Foxp3+ regulatory T cells (Tregs) [14–16]. The combination of anti-CD25 to the cell-based vaccine therapy enhanced vaccine efficacy compared to vaccine treatment alone [16]. These data demonstrated that anti-neuroblastoma immunity could be generated by the use of a cell-based vaccine and that the strength of the vaccine was enhanced by anti-CD25 therapy.
We report that a productive vaccine-induced immune response in mice results in CD8+ T cells with a genetic signature that is shared with stem cells of hematopoietic, neuronal, and embryonic origin. Interestingly, an opposing effect of vaccination is observed in tumor-bearing mice, where CD8+ T cells are driven away from the stem cell-related genetic signature and attenuated immune responses are observed. Therefore, we believe the “stemness” signature of CD8+ T cells represents an early signature of developing functional immune responses and may represent incipient CD8+ memory cells.
Materials and Methods
Animals and Cell Lines
A/J mice were purchased from The Jackson Laboratory and used at 6–8 wk of age. All experiments were performed under approved protocols in a specific pathogen-free environment at the Medical College of Wisconsin, which contains an American Association for the Accreditation of Laboratory Animal Care-certified facility. Generation of AGN2a, a subclone of Neuro-2a (obtained from American Type Culture Collection), was described previously [17]. Cryoperserved stocks of wild-type AGN2a cells were generated and used for all tumor challenge experiments to minimize experimental variability. For tumor vaccine generation (AGN2a-4P), AGN2a cells in log growth were electrotransfected with plasmids encoding CD80, CD86, CD54, and CD137-L using the AMAXA nucleofection system (Gaithersburg, MD) as previously described [12].
Tumor Inoculation, Vaccination and anti-CD25 Administration
Tumor-bearing mice were inoculated with 105 or 106 AGN2a cells by subcutaneous (s.c.) injection of the right hind flank (Day 0). Mice receiving vaccination were given 2×10⁶ AGN2a-4P cells by s.c. injection in the right hind flank on Day 6 or on Days 6 and 13. Mice treated with anti-CD25 monoclonal antibody (clone PC61) received 250μg of PC61 by intraperitoneal injection on Day 3. Control mice not receiving tumor, vaccine or anti-CD25 were injected with PBS.
Antibodies
The following monoclonal antibodies (mAbs), with or without a fluorescent label, were used in this study. Anti-CD80 (16-10A1), anti-CD4 (OX-35), anti-CD44 (IM7), anti-CD62L (MEL-14), anti-CD25 (7D4) and anti-CD137L (TKS-1) were purchased from BD Biosciences Pharmingen (San Jose, CA). Anti-CD8 (53-6.7), anti-CD86 (GL1) and anti-CD54 (YN1) was purchased from eBioscience (San Diego, CA). Anti-CD25 monoclonal antibody (PC61) was generated from a hybridoma obtained from the American Type Culture Collection. PC61 was produced using Integra CL 1000 bioreactors (Chur, Switzerland).
CD8+ Cell Enrichment
Spleens from A/J mice were collected, processed into single cell suspensions, and incubated with anti-CD8a conjugated microbeads (Miltenyi Biotec, Auburn, CA). CD8+ T cells were isolated by automated immunomagnetic cell sorting (AutoMACS, Miltenyi Biotec). CD8+ T cell enrichment was confirmed by flow cytometric analysis, and the cells were typically >95% CD8+. Samples used in gene expression studies were processed and sorted in ice-cold buffers to minimize changes in gene expression due to the experimental procedure.
Analysis of Cells by Flow Cytometry
Surface expression of T cell activation markers and immune co-stimulatory molecules on modified AGN2a tumor cells was verified as described previously [12]. Antibody-labeled cells were analyzed on a Becton-Dickinson FACSCalibur flow cytometer and data analyzed using Flow-Jo software (Tree Star, Ashland, OR).
IFN-γ ELISPOT Assays
ELISPOT assays to assess numbers of tumor-reactive IFN-γ-secreting CD8+ T cells were performed using a kit from BD Biosciences Pharmingen as previously described [16]. Briefly, 96-well hydrophobic polyvinylidine difluoride membranes were coated with IFN-γ capture monoclonal antibody. Two-fold dilutions of purified CD8+ T cells were added to the plates (concentrations varying from 105 to 2×10³ per well) in triplicate along with 5×10⁴ irradiated ANG2a target cells expressing CD80 and CD86 (AGN2a-80/86) or CD80 and CD137L (AGN2a-80/137L), which increased sensitivity of the response while maintaining specificity. Controls consisted of CD8+ T cells cultured alone and irradiated tumor cells cultured alone. The plates were incubated overnight at 37°C. After incubation, the plates were washed to remove the cells and biotinylated anti-IFN-γ detection antibody was added for 2 hours at room temperature. Extravidin alkaline phosphatase (Sigma-Aldrich Corp, St. Louis, MO) was added, and the spots developed by adding BCIP/NBT substrate (Sigma-Aldrich). Numbers of spots, corresponding to numbers of IFN-γ-secreting cells, were quantified with an ImmunoSpot Analyzer using included acquisition and analysis software (CTL Analyzers, LLC, Cleveland, OH).
RNA Isolation and Microarrays
To minimize processing-related changes in gene expression and RNA degradation, cells were collected, processed and isolated on ice. Splenic CD8+ T cells were isolated from individual mice as described above. RNA was isolated using Trizol reagent (Invitrogen, Carlsbad, CA) and further purified with the RNeasy Micro Kit (Qiagen, Valencia, CA). The purified RNA was quantified with a Nanodrop 1000 UV/Vis-spectrophotometer (Thermo Scientific, Wilmington, DE) and equal amounts of RNA from 5–6 mice were pooled. Pooled samples were sent to Expression Analysis Inc. (Durham, NC), where labeled cRNA was generated and hybridized to Affymetrix GeneChip® Mouse Genome 430.2 microarrays (Santa Clara, CA). Microarray data was exported from Affymetrix GCOS software as CEL files and normalized in dCHIP to the median intensity using the PM-only model [18]. The data was Log2 transformed and filtered to exclude probe sets with an “Absent” call in every sample.
Gene Set Enrichment Analysis
Gene Set Enrichment Analysis (GSEA) (http://www.broad.mit.edu/gsea/) was used to interrogate the filtered data for the enrichment of gene sets in the C2 collection of the Molecular Signature Database (MSigDB) [19]. Expression data was collapsed to the median probe set signal for each gene and genes were ranked based on the “Difference of Classes” metric by GSEA. Ranked gene lists were generated by comparing microarray data of tumor-bearing and tumor-free mice given the same treatments. Gene Set Enrichment Analysis was performed on ranked gene lists using 1000 permutations of the gene sets to normalize the enrichment scores. Gene sets were considered to be significantly enriched with a p value <0.05 and a false discovery rate (FDR) <0.05. Results were generated from averaging and normalizing two independent experiments. In each experiment, 5–6 mice from each group were pooled and one group was used per GeneChip®. GSEA was also performed on unfiltered microarray data or without collapsing probe set data, and yielded similar findings in regard to the enrichment of the “Stemcell_Common_Up” gene set (data not shown).
Leading Edge Analysis
Leading edge genes, as defined by GSEA, were examined from the “Stemcell_Common_Up” gene set. These are defined as the subset of genes that contribute most to the enrichment score. We identified the leading edge genes in tumor-free mice treated with vaccine plus anti-CD25 when compared to tumor-bearing mice given the same treatment. The probe sets representing these genes were collapsed using GSEA into a median expression value for each gene. Expression values were calculated relative to naïve (non-treated, tumor-free) mice and averaged between experiments. The data was normalized for each gene and hierarchically clustered using Genesis software [20].
Real Time RT-PCR
To validate the GSEA identification of the “Stemcell_Common_Up” gene set, we identified the probe sets demonstrating the greatest differential expression between tumor-free and tumor-bearing mice treated with anti-CD25 and vaccination. The interrogated sequence for each probe set was retrieved from the NetAffex database. Primers were designed as based on these sequences using Primer3 online software (http://primer3.sourceforge.net/). CD8+ T cell RNA from tumor-bearing and tumor-free mice was converted to cDNA using SuperScriptIII reverse transcriptase (Invitrogen). The cDNA was used as template in relative quantitative real time PCR with Quantifast SYBR green master mix (Qiagen). Fold change was determined using the delta-delta Ct method, with 18S RNA acting as the housekeeping control. Reactions were run without cDNA as negative controls, and melting curve analysis was performed to verify the product consisted of a single amplicon.
Statistics
All statistics were performed using Graphpad Prism 5.0a (La Jolla, CA). Survival curves were compared by log-rank analysis. Two-way ANOVA with Bonferroni post-test was performed for other analyses. P values < 0.05 were considered as significant. Statistics of gene set enrichment were calculated with GSEA. Gene sets with a p value < 0.05 and a False Discovery Rate (FDR) < 0.05 were considered as significantly enriched.
Results
Cell-based tumor vaccines do not rescue mice with established neuroblastoma
The AGN2a cell line is an aggressive subclone of the murine neuroblastoma cell line Neuro2a [17]. Similar to human neuroblastoma, this cell line lacks co-stimulatory molecules and is weakly immunogenic [17,21]. We have previously demonstrated that AGN2a cells expressing co-stimulatory molecules elicit an immune response which is protective to challenge with wild type tumor [12,17,22]. The most efficacious vaccine developed by this strategy is the AGN2a-4P vaccine, which expresses CD80 (B7-1), CD86 (B7-2), CD54 (ICAM-1) and CD137L (4-1BBL). Vaccination with two rounds of AGN2a-4P protected mice from a lethal challenge of wild type tumor cells [12]. We examined the effect of vaccination on mice with established tumors to test the vaccine in a more clinically relevant setting. Mice were inoculated with AGN2a cells, vaccinated twice, and monitored for tumor development (Figure 1A). Unlike previous studies in which vaccination prevented tumor formation, vaccination did not significantly increase the survival of tumor-bearing mice (Figure 1B).
Figure 1. Treatment of tumor-bearing mice with the AGN2a-4P vaccine +/− anti-CD25 did not enhance survival.
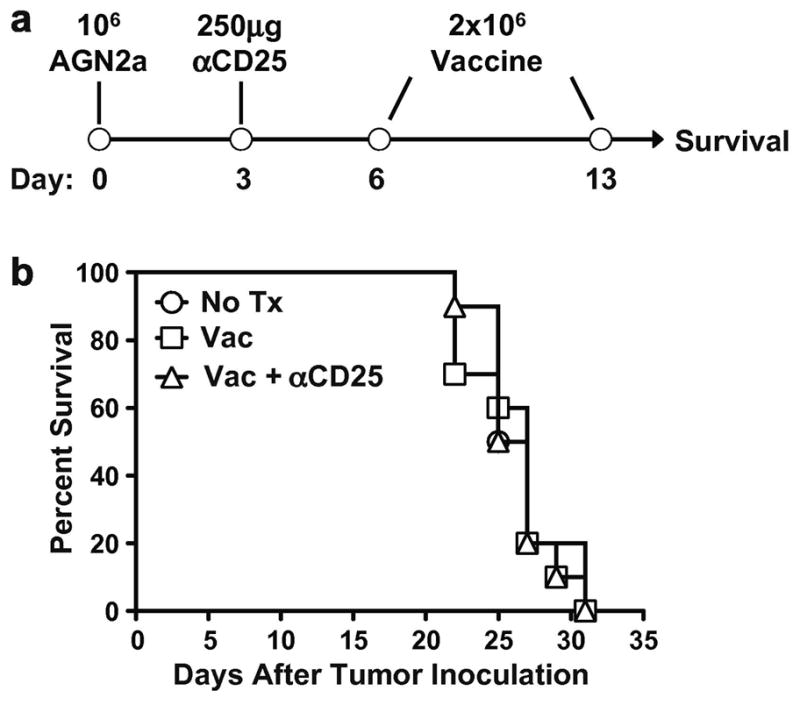
(A) A/J mice were inoculated with 106 AGN2a cells in the subcutaneous space of the right hind flank (Day 0). Mice were treated with 250μg of anti-CD25 monoclonal antibody by intraperitoneal injection (Day 3) and/or two vaccinations of 2×10⁶ AGN2a-4P cells given subcutaneously on Days 6 and 13. (B) Survival curves for groups of tumor-inoculated mice given no treatment (No Tx), vaccine only (Vac), or anti-CD25 and vaccine (Vac + αCD25). Tumor size was monitored and mice were considered as moribund when tumors exceeded 250mm2 in size. These data were combined from two independent experiments with 5 mice per group.
Regulatory T cells (Tregs) are a subset of CD4+ T cells which have been implicated in the control of autoimmunity and the suppression of tumor immunity [23–25]. Tregs, which constitutively express the α-chain of the IL-2 receptor (CD25), can be functionally inhibited by the administration of antibodies against CD25 [16,28,29]. Inhibition of Tregs with CD25-specific antibodies has been shown to enhance the efficacy of tumor vaccines in neuroblastoma and other tumor models [16,28,29]. To determine if Treg-mediated suppression was involved in the progression of established tumors, tumor-bearing mice were treated with anti-CD25 monoclonal antibody 3 days prior to vaccination (Figure 1A). Previous studies have demonstrated that incomplete depletion of Tregs with anti-CD25 provides significant immunomodulation in this neuroblastoma model [16]. While this vaccination strategy has been effective in tumor-free models, treatment with anti-CD25 and vaccine did not prolong the survival of tumor-bearing mice (Figure 1B). The inability of anti-CD25 administration to generate any protective response suggests that the lack of immune responsiveness to vaccine therapy is not due to increased Treg activity in tumor-bearing mice. The possibility also exists that anti-CD25 immunotherapy during an ongoing immune response could deplete effector cells and mask effector cell function. This highlights the need to develop alternative strategies for blocking Treg activity.
CD8 T cells from tumor-bearing mice have decreased effector function as compared to cells from tumor-free mice
Vaccination against neuroblastoma elicits a protective immune response which is dependent on CD8+ T cells [13]. Furthermore, protective immunity correlates with increased numbers of IFN-γ-secreting, tumor-reactive CD8+ T cells [12,13]. As the vaccine did not prolong the survival of tumor-bearing mice, we examined the frequency and function of tumor-reactive CD8+ T cells from tumor-bearing mice following vaccine therapy. Tumor-bearing and tumor-free mice were given two weekly vaccines. After each vaccination, splenic CD8+ T cells were isolated and analyzed in IFN-γ ELISPOT assays to quantify tumor-reactivity (Figure 2A). Five days following the initial vaccine, minimal CD8 effector responses were observed (Figure 2B). However, 3 days following the second vaccination, tumor-free mice given vaccination had a greater than ten-fold increase in the frequency of tumor-reactive CD8+ T cells (Figure 2C). In contrast, tumor-bearing mice demonstrated an attenuated response to vaccination, as the frequency of tumor-reactive CD8+ T cells only increased by ~80% as compared to mice given no treatment (Figure 2C). Vaccination in the context of Treg inhibition (anti-CD25 treatment) led to an even greater increase in the frequency of tumor-reactive CD8+ T cells in both tumor-free and tumor-bearing mice. This increase, however, was more pronounced in tumor-free mice as the frequency of tumor-reactive CD8+ T cells increased by 20-fold in these mice as compared to an approximate 4-fold increase in tumor-bearing mice (Figure 2C). T cells from both tumor-free and tumor-bearing mice were subsequently analyzed after vaccination for the expression of CD44 and CD62L. It was found that there was not a significant difference in the percentage of activated CD8+ T cells between vaccinated tumor-free and tumor-bearing mice (Figure 2D). These data demonstrate that vaccine-induced CD8+ T cell effector responses are attenuated in tumor-bearing mice, which correlates with the inability of vaccine therapy to prolong the survival of tumor-bearing mice.
Figure 2. Cell-based vaccines induce CD8+ T cell-mediated IFN-γ responses only in tumor-free mice.

(A) Tumor-bearing and tumor-free mice were generated by the subcutaneous inoculation of 106 AGN2a cells or PBS, respectively, on Day 0. Groups of the tumor-free and tumor-bearing mice were treated with 250μg of anti-CD25 monoclonal antibody intraperitoneally (Day 3) and/or two vaccinations of 2×10⁶ AGN2a-4P vaccine cells given subcutaneously on Days 6 and 13. (B and C) As depicted in panel A, CD8+ splenocytes were collected on Day 11 (B) or Day 16 (C) by immunomagnetic cell sorting and tested in overnight IFN-γ ELISPOT assays with AGN2a target cells. Spots were quantified using an ImmunoSpot Analyzer and adjusted to determine the frequency of IFN-γ tumor-reactive CD8+ T cells per well. Data is represented as the mean number of spots per 106 CD8+ cells ± standard error of the mean of individual mice (n=6). Differences between tumor-free and tumor-bearing mice were analyzed by Two-way ANOVA with Bonferroni post-test. * = p value < 0.05. Data are combined from two experiments. Data from C is representative of five independent experiments. (D) CD8+ splenocytes were analyzed for expression of CD44 and CD62L on day 16. Data is representative of more than six experiments.
CD8 T cells from tumor-bearing mice have decreased expression of stem cell-associated genes following vaccine therapy as compared to tumor-free mice
ELISPOT analysis of the CD8+ T cell compartment demonstrated that the immune response to vaccination is blunted in tumor-bearing mice, resulting in a decreased frequency of tumor-reactive CD8+ effectors. We hypothesized that the reduction of tumor immunity in tumor-bearing mice was due to alterations of T cell activation in response to vaccine. To test this hypothesis, we examined the gene expression profiles of CD8+ T cells from tumor-bearing and tumor-free mice early after administration of a single vaccine to examine the impact of tumor status on the response to vaccination. Mice were inoculated with AGN2a cells or PBS to generate tumor-bearing and tumor-free hosts, respectively, and were vaccinated six days later (Figure 3A). As Treg inhibition with anti-CD25 enhanced the CD8+ T cell response in both tumor-bearing and tumor-free mice, the effect of anti-CD25 treatment prior to vaccination on CD8+ T cell gene expression was also examined (Figure 3A). Splenic CD8+ T cells were collected from groups of 5–6 mice five days after vaccination. This time point was chosen as neither tumor-free or tumor-bearing mice had yet generated an appreciable response to the tumor (Figure 2B). RNA was isolated and used to generate labeled cRNA which was hybridized to Affymetrix GeneChip® Mouse Genome 430.2 microarrays. This experiment was performed twice in its entirety. Gene expression data from each experiment was normalized, filtered and analyzed in combination as replicates. Gene expression data was analyzed by Gene Set Enrichment Analysis (GSEA), a computational methodology designed to identify coordinated changes in biologically related genes (gene sets) [19]. GSEA was used to examine the gene expression profiles of the CD8+ T cells from tumor-bearing and tumor-free mice after vaccination ± anti-CD25 treatment.
Figure 3. Gene expression profiling of CD8 T cells from vaccinated tumor-free mice showed an enrichment of stem cell-related genes relative to CD8 T cells from vaccinated tumor-bearing mice.

(A) Tumor-bearing and tumor-free mice were generated by the subcutaneous inoculation of 106 AGN2a cells or PBS, respectively, on Day 0. Mice were treated with 250μg of anti-CD25 monoclonal antibody intraperitoneally (Day 3) and/or vaccinated with 2×10⁶ AGN2a-4P vaccine cells given subcutaneously on Days 6. CD8+ splenocytes were collected from 5–6 mice on Day 11 by immunomagnetic cell sorting. RNA was extracted and pooled for gene expression profiling on the Affymetrix GeneChip® Mouse Genome 430 2.0 microarray. GSEA was used to analyze the combined gene expression data of two independent experiments. The “Stemcell_Common_Up” gene set was identified as being enriched in treated tumor-free mice relative to treated tumor-bearing mice. The enrichment profiles of the “Stemcell_Common_Up” gene set are shown for mice given No Treatment (B), Vaccine (C) or Vaccine+anti-CD25 (D). For each enrichment profile, a rank ordered gene list was generated between tumor-free and tumor-bearing mice, in which all genes in the microarray were ordered from highest differential expression in tumor-free (left/red end of bar) to the highest differential expression in tumor-bearing (right/blue end of bar). Black lines represent the location of the “Stemcell_Common_Up” genes in the rank ordered gene list. A summing generates a running enrichment score (green line) which yields the overall enrichment of the gene set at the maximum deviation from zero.
“Stemcell_Common_Up” was found to be the only gene set, from a total of 1360 gene sets, which was consistently enriched in the CD8+ T cells of vaccinated tumor-free mice relative to T cells from vaccinated tumor-bearing mice (Table 1, Supplemental Table 1). This gene set consists of genes found to be over-expressed in embryonic, hematopoietic and neural stem cells relative to terminally differentiated cells [30], and it was significantly enriched in the CD8+ T cells of vaccinated tumor-free mice relative to CD8+ T cells from vaccinated tumor-bearing mice (p<0.001, FDR=0.003, Figure 3C). Similarly, CD8+ T cells of tumor-free mice treated with both anti-CD25 and vaccine demonstrated a significant enrichment of the “Stemcell_Common_Up” gene set relative to their tumor-bearing counterparts (p<0.001, FDR=0.019, Figure 3D). Importantly, this stem cell-related gene set was not enriched in the CD8+ T cells of non-treated tumor-free mice as compared to non-treated tumor-bearing mice (p=0.749, FDR=0.834, Figure 3B) indicating that this finding is related to the vaccine-induced immune response and not simply a reflection of the presence or absence of tumor.
Table 1. Enrichment of the “Stemcell_Common_Up” gene set in tumor-free mice relative to tumor-bearing mice.
Gene Set Enrichment Analysis (GSEA) was used to examine coordinated changes in the gene expression profile of tumor-free and tumor-bearing mice after undergoing treatment with vaccine ± anti-CD25. Gene expression data from two independent experiments was combined and analyzed by GSEA. Of the 1360 gene sets used to interrogate the gene expression data, only the “Stemcell_Common _Up” gene set was found to be consistently enriched in vaccinated tumor-free mice relative to tumor-bearing mice receiving the same treatment. Values above represent the p value and False Discovery Rate (FDR) of the enrichment of the “Stemcell_Common _Up” gene set in each treatment group.
| P value | False Discovery Rate | |
|---|---|---|
| No Treatment | 0.749 | 0.834 |
| Vaccine | < 0.001 | 0.003 |
| Vaccine + Anti-CD25 | < 0.001 | 0.019 |
To examine the enrichment of the “Stemcell_Common_Up” gene signature in the CD8+ T cells of vaccinated tumor-free mice relative to tumor-bearing mice, the individual genes of this gene set were further analyzed. The leading edge subset of a gene set consists of the genes that are the most differentially expressed between the experimental groups and therefore are the greatest contributors to the enrichment of the gene set [19]. We examined the leading edge genes of the “Stemcell_Common_Up” gene set when comparing tumor-free and tumor-bearing mice treated with anti-CD25 and vaccine (Figure 3D). This comparison was chosen as the CD8+ T cells of tumor-free and tumor-bearing mice treated with anti-CD25 and vaccine exhibited the greatest functional differences (Figure 2C). The leading edge consisted of 85 genes representing a variety of biological processes, including transcription, translation and the ubiquitin proteosome system (Supplemental Table 2). The expression of the leading edge genes was examined in each of the experimental groups relative to naïve (tumor-free, non-treated) mice. The gene expression was normalized and the genes and experimental groups were hierarchically clustered (Figure 4). Tumor-free mice treated with anti-CD25 and vaccine or vaccine alone were found to cluster together as did tumor-bearing mice given the same treatments (Figure 4). In tumor-free mice treated with vaccine ± anti-CD25, the majority of the leading edge genes were found to be expressed at levels higher than or equivalent to that of naïve mice, suggesting these genes are up-regulated upon T cell activation with this treatment regimen (Figure 4). In contrast, CD8+ T cells from tumor-bearing mice treated with vaccine ± anti-CD25 expressed the majority of the leading edge genes at lower levels than naïve mice. Interestingly, non-treated tumor-bearing mice expressed the majority of the leading edge genes at higher levels that naïve mice, demonstrating that the presence of tumor alone is not sufficient to account for the down-regulation of these genes as seen in vaccinated tumor-bearing mice (Figure 4). These findings suggest that the CD8+ T cell response to vaccination ± anti-CD25 treatment is dependent upon the tumor status of the host, as T cells from tumor-bearing mice down-regulated the identified stem cell-related genes, whereas the expression of these genes was maintained or up-regulated in T cells from vaccinated tumor-free mice.
Figure 4. Differential stem cell-related profiling of CD8+ T cells from productive and non-productive tumor responses.
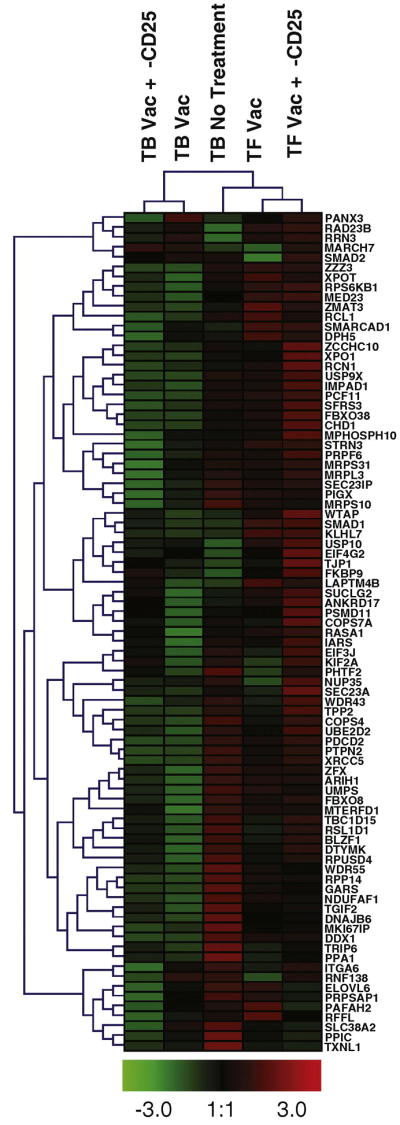
The leading edge genes from the “Stemcell_Common_Up” gene set were identified in the comparison of CD8+ T cells from tumor-free and tumor-bearing mice treated with vaccine and anti-CD25. The median expression of the leading edge genes was calculated using GSEA software, and was examined in each treatment group relative to CD8+ T cells from naïve (tumor-free, non-treated) mice. Results were averaged from two independent experiments, normalized and hierarchically clustered using Genesis software [20].
To validate the gene expression findings of the microarray experiments, real time RT-PCR was used to examine the expression levels of genes from the “Stemcell_Common_Up” gene set. Probe sets representing nine genes identified in the leading edge of tumor-free mice treated with vaccine and anti-CD25 were chosen for analysis. Primers were designed for each probe set according to the Affymetrix sequences and used in real time RT-PCR assays with cDNA from CD8+ T cell from tumor-free and tumor-bearing mice treated with anti-CD25 and vaccination. The results confirm the increased expression of 8 of the 9 genes in the CD8+ T cells of tumor-free mice relative to CD8+ T cells of tumor-bearing mice (Figure 5). Subsequent real time RT-PCR experiments were conducted to examine the expression of these genes in CD44hi and CD44low CD8+ T cells, to determine if this gene expression pattern was confined to a subpopulation of T cells. These experiments did not show a consistent correlation of expression in either subset relative to the other (data not shown). This data, along with the finding that the total percentage of CD44hi CD8+ T cells is unchanged between vaccinated tumor-free and tumor-bearing mice (Figure 2D), suggests that the expression of stem cell-related genes is not a reflection of increased effector cells, but of differential programming of CD8+ T cells after vaccination in tumor-free and tumor-bearing mice.
Figure 5. Real time RT-PCR validation of leading edge genes from the “Stemcell_Common_Up” gene set.
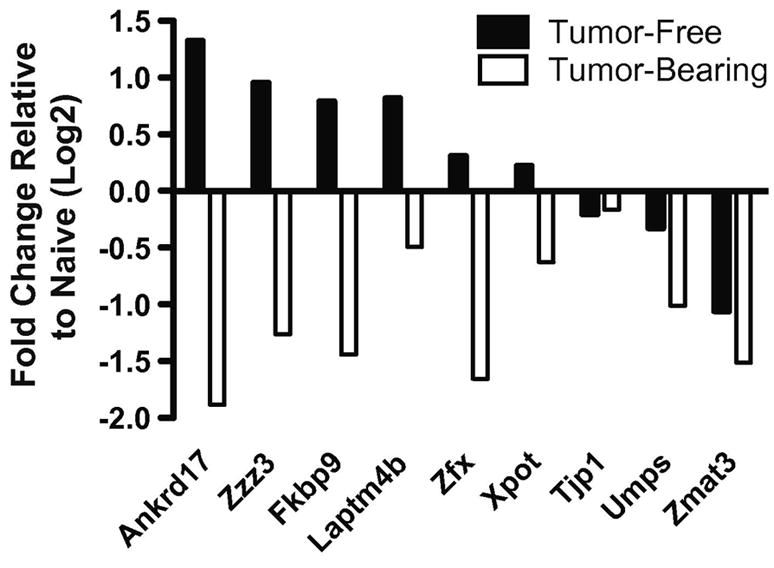
cDNA was generated from the CD8+ T cell of tumor-bearing and tumor-free mice treated with anti-CD25 and vaccine. cDNA was examined for the expression of probe sets representing leading edge genes of the “Stemcell_Common_Up” gene set by real time RT-PCR. Results were calculated using the ΔΔCt method with 18S rRNA as the internal reference and cDNA from CD8+ T cells from naïve (tumor-free, non-treated) mice as the calibrating sample. Results were generated using the same RNA samples used in one of the microarray experiments and are representative of two experiments using RNA samples from groups of mice from independent experiments.
Discussion
Dysregulation of the immune system in tumor-bearing hosts represents a significant barrier to the development of immune-based treatments for neoplastic disease [31–34]. Various mechanisms of immune dysregulation have been implicated, including alterations of T cell signaling, tolerizing effects of the tumor and the induction and/or expansion of immunosuppressive cell populations, such as regulatory T cells (Tregs), however the relative contributions of each of these mechanisms has not been universally established [23,32,35–39]. The ability to successfully vaccinate tumor-free hosts and protect them from a tumor challenge has been demonstrated in many different animal models. This same level of success has not been achieved in tumor-bearing hosts [31,40]. In a murine model of neuroblastoma we have previously demonstrated the ability to protect mice from a lethal tumor challenge with vaccine therapy [12]. However, mice inoculated with the same tumor dose 6 days prior to vaccination uniformly succumbed to tumor progression (Figure 1B). The inability to induce a therapeutic immune response to ‘established tumor’ correlated with decreased numbers of tumor-reactive CD8+ T cells in tumor-bearing mice after vaccination (Figure 2C). As CD8+ T cells have previously been demonstrated to be an essential mediator of tumor immunity after vaccination, the decreased numbers of tumor-reactive CD8+ T cells in tumor-bearing mice suggests that dysfunction of this population may underlie the inability to treat established tumors through vaccination [13].
Tregs have previously been implicated in the suppression of tumor immunity and their depletion has been utilized in immunotherapeutic regimens to enhance the efficacy of vaccination [16,23–25,28]. However, depletion and/or inhibition of Tregs with anti-CD25 monoclonal antibody before vaccination did not enhance the survival of tumor-bearing mice in the neuroblastoma model (Figure 1B). Treg inhibition prior to vaccination increased the number of tumor-reactive CD8+ T cells in tumor-bearing mice relative to mice given vaccine only; however, the production of tumor-reactive CD8+ T cells was diminished in tumor-bearing mice relative to tumor-free mice given the same treatment (Figure 2C). Anti-CD25 treatment was unable to completely restore CD8 effector function in tumor-bearing mice, suggesting that while Treg inhibition can enhance the T cell response to vaccination, the inability to induce therapeutic immunity in tumor-bearing mice is due to another mechanism.
T cell activation results in early changes in gene expression and epigenetic alterations which affect gene expression at later times [41–46]. Several different factors can influence T cell activation including TCR-antigen affinity, co-stimulation, and cytokines, and each of these factors alters the gene expression profile, as well as the functional outcome of activated T cells [6,47–52]. As tumor-bearing mice exhibited a diminished CD8+ T cell response upon vaccination, we sought to examine the effect of tumor-status on the gene expression profiles of CD8+ T cells. Using microarray analysis of the entire mouse genome, we compared gene expression profiles of CD8+ T cells from tumor-bearing and tumor-free mice that were treated with vaccine therapy with or without Treg inhibition (anti-CD25). CD8+ T cells collected from vaccinated tumor-free mice demonstrated a coordinated increase (or enrichment) in the expression of genes known to be expressed by hematopoietic, neural and embryonic stem cells relative to tumor-bearing mice (Figure 3C). This enrichment was also found when tumor-free and tumor-bearing mice treated with anti-CD25 and vaccination were compared (Figure 3D). Of note, there was no significant enrichment of stem cell-related genes in non-treated mice (Figure 3B), demonstrating that tumor-status alone did not account for this gene expression pattern. Examination of the leading edge genes, which are those genes most responsible for enrichment of a gene set, revealed that the responses to vaccination (± anti-CD25) in tumor-bearing and tumor-free mice were actually polarized in opposite directions (Figure 4). Tumor-free mice demonstrated an increased expression of the stem cell-related genes, whereas tumor-bearing mice demonstrated decreased expression of the same genes. This data demonstrated that CD8+ T cells from tumor-bearing mice responded to vaccination by down-regulating genes that would be up-regulated after vaccination in a tumor-free mouse. The up-regulation of the stem cell-related genes does not appear to be related to an increase in the production of effector T cells after vaccination, as there was no difference in the percentage of CD44hi CD8+ T cells after vaccination of tumor-free mice relative to tumor-bearing mice (Figure 2D). Furthermore, there was no enrichment of stem cell-related genes in the CD44hi population relative to the CD44low population in either tumor-free or tumor-bearing mice (data not shown). Taken together, the functional and gene expression data suggest that the expression of stem cell-related genes may play an important role in the generation of protective tumor immunity, and that the down-regulation of these genes in the CD8+ T cells of tumor-bearing mice underlies the diminished CD8+ T cell reactivity and the inability to generate a therapeutic immune response after vaccination.
In these studies we have demonstrated that CD8+ T cells from vaccinated tumor-bearing mice have decreased expression of a group of stem cell-related genes relative to vaccinated tumor-free mice. These stemness genes were originally identified as being commonly over-expressed in hematopoietic, neural and embryonic stem cells relative to differentiated cells [30]. While the expression of these stem cell-related genes correlates with a productive immune response after vaccination, the biological role of these genes in T cell activation is yet to be understood. While it is possible-because of our pooling strategy- that expression levels of individual genes may vary between mice- the advantage of the GSEA method is that it allows us to discern global changes according to a particular set of genes present within the “stemness” pathway. Of the genes found within the leading edge of tumor-free mice treated with vaccine and anti-CD25, many were found to be related to protein regulation either through translation or the ubiquitin-proteosome system (Supplemental Table 2). The decreased expression of various ribosomal subunits (Mrpl3, Mrps10, Mrps31), elongation factors (Eif4g2, Eif3j) and targets of the mTOR pathway (Rps6k2b1, Rrn3) suggests that CD8+ T cells from tumor-bearing mice may be deficient in their ability to efficiently translate proteins. As ribosomal biogenesis and the mTOR pathway are also linked to cellular ATP levels, the decreased expression of genes in the oxidative phosphorylation pathway in CD8+ T cells of tumor-bearing mice supports the idea that these cells may lack the ability to efficiently translate proteins [53]. Of interest, previous studies have demonstrated that T cell defects such as exhaustion and anergy are correlated with decreased expression of ribosomal proteins, decreased expression of genes involved in metabolism and defects in mTOR signaling [52,54]. Further studies will be required to understand the relationships of these cellular processes to vaccine responses and tumor immunity.
The role of stem cell-related genes in T cells during the early immune response to vaccination is uncertain; however, this may be interpreted as a sign of memory formation, as parallels exist between stem cells and memory T cells [55]. For one, each is long-lived and capable of maintaining its numbers through replication [55,56]. Also, the persistence of each requires external cues from other cells and cytokines, and both cell types demonstrate the ability to give rise to cells with a more defined functional role [56,57]. Furthermore, memory T cells have been shown to express many genes in common with long-term hematopoietic stem cells [58]. While the coordinated expression of stem cell-related genes in CD8+ T cells may be a marker of memory T cells within the population, the proximity to vaccination (5 days post-vaccine) and the absence of a definitive T cell response at this time point (Figure 2B) suggest the expression of stem cell-related genes may related to the formation of memory, as opposed to fully developed memory T cells. In chronic viral infections, where antigen persists and inflammation does not resolve, losses of T cell memory have been shown at early, as well as late, time points after infection [59,60]. The persistence of antigen and inflammation makes the tumor-bearing state analogous to chronic viral infection, and the decreased expression of stem cell-related genes may signify a decreased ability to form a memory response. Alternatively, the differential expression of stem cell-related genes may illustrate a qualitative difference in the effectors generated after vaccination as opposed to differences in memory formation. The down-regulation of stem cell-related genes in CD8+ T cells in tumor-bearing mice could indicate a greater level of terminal differentiation in effectors after vaccination. This could explain the lack of therapeutic immunity in tumor-bearing mice after vaccination, as terminal differentiation has been demonstrated to negatively correlate with tumor clearance in adoptive transfer models [61]. Ongoing studies will determine the relationship between stem cell-related genes, and the T cell response to cell-based vaccination in the tumor-free and tumor-bearing state, with particular focus on the role of stem cell-related genes in memory formation. Future studies will also evaluate the expression of stem cell-related genes as prognostic markers of vaccine responses, with the hope that such findings will allow for the development of a sensitive assay to predict outcomes of immunotherapeutic interventions early after treatment.
Supplementary Material
Gene expression data from CD8+ T cells collected from tumor-free and tumor-bearing mice treated with vaccine ± anti-CD25 was examined by GSEA. Data from two independent experiments was analyzed independently and in combination as replicates. Gene sets found to be enriched in tumor-free mice with a p value < 0.05 and a False Discovery Rate (FDR) <0.25 are listed for each experiment. The only gene set found to be enriched in tumor-free mice in all of these analyses was the “Stemcell_Common_Up” gene set.
The leading edge genes of the “Stemcell_Common_Up” gene set were identified in tumor-free mice treated with vaccine and anti-CD25 relative to tumor-bearing mice receiving the same treatment (Figures 3D and 4). These genes were grouped according to the biological processes in which each was reported to be involved. Genes are reported by their gene symbols and Unigene designations.
Acknowledgments
The authors would like to thank Weiqing Jing, Alexandra Liska-Baird, Laura McOlash, Katie Palen, James Weber, Mellissa Keller and Jamie Zernicke for outstanding technical assistance. The authors also thank Jill Gershan for helpful discussions involved in the generation of this manuscript. This publication has been funded all or in part by National Cancer Institute grant CA100030 (BDJ, RJO), Northwestern Mutual Life Foundation, Milwaukee, WI (MEK, RJO), Midwest Athletes Against Childhood Cancer (MACC) Fund, Milwaukee, WI (BDJ, WHDH, MEK, RJO), and the Schield’s Foundation, Milwaukee, WI (BDJ, MEK, RJO). Funding bodies had no input on data analysis and interpretation, manuscript submission, or publication decisions.
Footnotes
Publisher's Disclaimer: This is a PDF file of an unedited manuscript that has been accepted for publication. As a service to our customers we are providing this early version of the manuscript. The manuscript will undergo copyediting, typesetting, and review of the resulting proof before it is published in its final citable form. Please note that during the production process errors may be discovered which could affect the content, and all legal disclaimers that apply to the journal pertain.
Contributor Information
M. Eric Kohler, Email: mkohler@mcw.edu, Dept. Pediatrics, Section of Hematology Oncology, Medical College of Wisconsin, 8701 Watertown Plank Rd., Milwaukee, WI 53226.
William H.D. Hallett, Email: whallett@mcw.edu, Dept. Pediatrics, Section of Hematology Oncology, Medical College of Wisconsin, 8701 Watertown Plank Rd., Milwaukee, WI 53226.
Qing-Rong Chen, Email: chenqi@mail.nih.gov, Oncogenomics Section, Pediatric Oncology Branch, National Cancer Institute, National Institutes of Health, Advanced Technology Center, 8717 Grovemont Circle, Gaithersburg, MD 20877.
Javed Khan, Email: khanjav@mail.nih.gov, Oncogenomics Section, Pediatric Oncology Branch, National Cancer Institute, National Institutes of Health, Advanced Technology Center, 8717 Grovemont Circle, Gaithersburg, MD 20877.
Bryon D. Johnson, Email: bjohnson@mcw.edu, Dept. Pediatrics, Section of Hematology Oncology, Medical College of Wisconsin, 8701 Watertown Plank Rd., Milwaukee, WI 53226
Rimas J. Orentas, Email: Rimas.Orentas@nih.gov, Pediatric Oncology Branch, National Cancer Institute, National Institutes of Health, 10 Center Dr., 1W3840, Bethesda, MD 20892, T: 414-4565897, F: 414-456-7010
References
- 1.Klaassen RJ, Trebo MM, Koplewitz BZ, Weitzman SS, Calderwood S. High-risk neuroblastoma in Ontario: a report of experience from 1989 to 1995. J Pediatr Hematol Oncol. 2003;225:8–13. doi: 10.1097/00043426-200301000-00004. [DOI] [PubMed] [Google Scholar]
- 2.Maris JM, Hogarty MD, Bagatell R, Cohn SL. Neuroblastoma. Lancet. 2007;369:2106–2120. doi: 10.1016/S0140-6736(07)60983-0. [DOI] [PubMed] [Google Scholar]
- 3.Fish JD, Grupp SA. Stem cell transplantation for neuroblastoma. Bone Marrow Transplant. 2008;41:159–165. doi: 10.1038/sj.bmt.1705929. [DOI] [PMC free article] [PubMed] [Google Scholar]
- 4.Blattman JN, Greenberg PD. Cancer immunotherapy: a treatment for the masses. Science. 2004;305:200–205. doi: 10.1126/science.1100369. [DOI] [PubMed] [Google Scholar]
- 5.Mocellin S, Mandruzzato S, Bronte V, Lise M, Nitti D. Part I: Vaccines for solid tumours. Lancet Oncol. 2004;5:681–689. doi: 10.1016/S1470-2045(04)01610-9. [DOI] [PubMed] [Google Scholar]
- 6.Kaech SM, Hemby S, Kersh E, Ahmed R. Molecular and functional profiling of memory CD8 T cell differentiation. Cell. 2002;111:837–851. doi: 10.1016/s0092-8674(02)01139-x. [DOI] [PubMed] [Google Scholar]
- 7.Grayson JM, Murali-Krishna K, Altman JD, Ahmed R. Gene expression in antigen-specific CD8+ T cells during viral infection. J Immunol. 2001;166:795–799. doi: 10.4049/jimmunol.166.2.795. [DOI] [PubMed] [Google Scholar]
- 8.Kaech SM, Wherry EJ. Heterogeneity and cell-fate decisions in effector and memory CD8+ T cell differentiation during viral infection. Immunity. 2007;27:393–405. doi: 10.1016/j.immuni.2007.08.007. [DOI] [PMC free article] [PubMed] [Google Scholar]
- 9.Mercado R, Vijh S, Allen SE, Kerksiek K, Pilip IM, Pamer EG. Early programming of T cell populations responding to bacterial infection. J Immunol. 2000;165:6833–6839. doi: 10.4049/jimmunol.165.12.6833. [DOI] [PubMed] [Google Scholar]
- 10.Kaech SM, Ahmed R. Memory CD8+ T cell differentiation: initial antigen encounter triggers a developmental program in naive cells. Nat Immunol. 2001;2:415–422. doi: 10.1038/87720. [DOI] [PMC free article] [PubMed] [Google Scholar]
- 11.Prlic M, Hernandez-Hoyos G, Bevan MJ. Duration of the initial TCR stimulus controls the magnitude but not functionality of the CD8+ T cell response. J Exp Med. 2006;203:2135–2143. doi: 10.1084/jem.20060928. [DOI] [PMC free article] [PubMed] [Google Scholar]
- 12.Johnson BD, Gershan JA, Natalia N, Zujewski H, Weber JJ, Yan X, Orentas RJ. Neuroblastoma cells transiently transfected to simultaneously express the co-stimulatory molecules CD54, CD80, CD86, and CD137L generate antitumor immunity in mice. J Immunother. 2005;2005:449–460. doi: 10.1097/01.cji.0000171313.93299.74. [DOI] [PubMed] [Google Scholar]
- 13.Jing W, Orentas RJ, Johnson BD. Induction of immunity to neuroblastoma early after syngeneic hematopoietic stem cell transplantation using a novel mouse tumor vaccine. Biol Blood Marrow Transplant. 2007;13:277–292. doi: 10.1016/j.bbmt.2006.11.018. [DOI] [PMC free article] [PubMed] [Google Scholar]
- 14.Comes A, Rosso O, Orengo AM, Di Carlo E, Sorrentino C, Meazza R, Iazza T, Valzasina B, Nanni P, Colombo MP, Ferrini S. CD25+ regulatory T cell depletion augments immunotherapy of micrometastases by an IL-21-secreting cellular vaccine. J Immunol. 2006;176:1750–1758. doi: 10.4049/jimmunol.176.3.1750. [DOI] [PubMed] [Google Scholar]
- 15.Kohm AP, McMahon JS, Podojil JR, Begolka WS, DeGutes M, Kasprowicz DJ, Ziegler SF, Miller SD. Cutting Edge: Anti-CD25 monoclonal antibody injection results in the functional inactivation, not depletion, of CD4+CD25+ T regulatory cells. J Immunol. 2006;176:3301–3305. doi: 10.4049/jimmunol.176.6.3301. [DOI] [PubMed] [Google Scholar]
- 16.Johnson BD, Jing W, Orentas RJ. CD25+ regulatory T cell inhibition enhances vaccine-induced immunity to neuroblastoma. J Immunother. 2007;30:203–214. doi: 10.1097/01.cji.0000211336.91513.dd. [DOI] [PubMed] [Google Scholar]
- 17.Johnson BD, Yan X, Schauer DW, Orentas RJ. Dual expression of CD80 and CD86 produces a tumor vaccine superior to single expression of either molecule. Cell Immunol. 2003;222:15–26. doi: 10.1016/s0008-8749(03)00079-0. [DOI] [PubMed] [Google Scholar]
- 18.Li C, Wong WH. Model-based analysis of oligonucleotide arrays: expression index computation and outlier detection. Proc Natl Acad Sci USA. 2001;98:31–36. doi: 10.1073/pnas.011404098. [DOI] [PMC free article] [PubMed] [Google Scholar]
- 19.Subramanian A, Tanayo P, Mootha VK, Mukherjee S, Ebert BL, Gillette MA, Paulovich A, Pomeroy SL, Golub TR, Lander ES, Mesirov JP. Gene set enrichment analysis: a knowledge-based approach for interpreting genome-wide expression profiles. Proc Natl Acad Sci USA. 2005;102:15545–15550. doi: 10.1073/pnas.0506580102. [DOI] [PMC free article] [PubMed] [Google Scholar]
- 20.Sturn A, Quackenbush J, Trajanoski Z. Genesis: cluster analysis of microarray data. Bioinformatics. 2002;18:207–208. doi: 10.1093/bioinformatics/18.1.207. [DOI] [PubMed] [Google Scholar]
- 21.Prigione I, Corrias NV, Airoldi I, Raffaghello L, Morandi F, Bocca P, Cocco C, Ferrone S, Pistoia V. Immunogenicity of human neuroblastoma. Ann NY Acad Sci. 2004;1028:69–80. doi: 10.1196/annals.1322.008. [DOI] [PubMed] [Google Scholar]
- 22.Yan X, Johnson BD, Orentas RJ. Murine CD8 lymphocyte expansion in vitro by artificial antigen-presenting cells expressing CD137L (4-1BBL) is superior to CD28, and CD137L expressed on neuroblastoma expands CD8 tumour-reactive effector cells in vivo. Immunology. 2004;112:105–116. doi: 10.1111/j.1365-2567.2004.01853.x. [DOI] [PMC free article] [PubMed] [Google Scholar]
- 23.Orentas RJ, Kohler ME, Johnson BD. Suppression of anti-cancer immunity by regulatory T cells: back to the future. Semin Cancer Biol. 2006;16:137–149. doi: 10.1016/j.semcancer.2005.11.007. [DOI] [PubMed] [Google Scholar]
- 24.Sakaguchi S. Naturally arising CD4+ regulatory T cells for immunologic self-tolerance and negative control of immune responses. Annu Rev Immunol. 2004;22:531–562. doi: 10.1146/annurev.immunol.21.120601.141122. [DOI] [PubMed] [Google Scholar]
- 25.Shimizu J, Yamazaki S, Sakaguchi S. Induction of tumor immunity by removing CD25+CD4+ T cells: a common basis between tumor immunity and autoimmunity. J Immunol. 1999;163:5211–5218. [PubMed] [Google Scholar]
- 26.Sakaguchi S, Sakaguchi N, Asano M, Itoh M, Toda M. Immunologic self-tolerance maintained by activated T cells expressing IL-2 receptor alpha-chains (CD25). Breakdown of a single mechanism of self-tolerance causes various autoimmune diseases. J Immunol. 1995;155:1151–1164. [PubMed] [Google Scholar]
- 27.Onizuka S, Tawara I, Shimizu J, Sakaguchi S, Fujita T, Nakamaya E. Tumor rejection by in vivo administration of anti-CD25 (interleukin-2 receptor alpha) monoclonal antibody. Cancer Res. 1999;59:3128–3133. [PubMed] [Google Scholar]
- 28.Antony PA, Piccirillo CA, Akpinarli A, Finkelstein SE, Speiss PJ, Surman DR, Palmer DC, Chan CC, Klebanoff CA, Overwijk WW, Rosenberg SA, Restifo NP. CD8+ T cell immunity against a tumor/self-antigen is augmented by CD4+ T helper cells and hindered by naturally occurring T regulatory cells. J Immunol. 2005;174:2591–2601. doi: 10.4049/jimmunol.174.5.2591. [DOI] [PMC free article] [PubMed] [Google Scholar]
- 29.Golgher D, Jones E, Powrie F, Elliott T, Gallimore A. Depletion of CD25+ regulatory cells uncovers immune responses to shared murine tumor rejection antigens. Eur J Immunol. 2002;32:3267–3275. doi: 10.1002/1521-4141(200211)32:11<3267::AID-IMMU3267>3.0.CO;2-1. [DOI] [PubMed] [Google Scholar]
- 30.Ramalho-Santos M, Yoon S, Matsuzaki Y, Mulligan RC, Melton DA. “Stemness”: transcriptional profiling of embryonic and adult stem cells. Science. 2002;298:597–600. doi: 10.1126/science.1072530. [DOI] [PubMed] [Google Scholar]
- 31.Bocchia M, Bronte V, Colombo MP, De Vincentis A, Di Nicola M, Forni G, Lanata L, Lemoli RM, Massaia M, Rondelli D, Zanon P, Tura S. Antitumor vaccination: where we stand. Haematologica. 2000;85:1172–1206. [PubMed] [Google Scholar]
- 32.Staveley-O’Carroll K, Sotomayor E, Montgomery J, Borello I, Hwang L, Fein S, Pardoll D, Levitsky H. Induction of antigen-specific T cell anergy: An early event in the course of tumor progression. Proc Natl Acad Sci USA. 1998;95:1178–1183. doi: 10.1073/pnas.95.3.1178. [DOI] [PMC free article] [PubMed] [Google Scholar]
- 33.Chouaib S, Asselin-Paturel C, Mami-Chouaib F, Caignard A, Blay JY. The host-tumor immune conflict: from immunosuppression to resistance and destruction. Immunol Today. 1997;18:493–497. doi: 10.1016/s0167-5699(97)01115-8. [DOI] [PubMed] [Google Scholar]
- 34.Finke J, Ferrone S, Frey A, Mufson A, Ochoa A. Where have all the T cells gone? Mechanisms of immune evasion by tumors. Immunol Today. 1999;20:158–160. doi: 10.1016/s0167-5699(98)01435-2. [DOI] [PubMed] [Google Scholar]
- 35.Cuenca A, Cheng F, Wang H, Brayer J, Horna P, Gu L, Bien H, Borello IM, Levitsky HI, Sotomayor EM. Extra-lymphatic solid tumor growth is not immunologically ignored and results in early induction of antigen-specific T-cell anergy: dominant role of cross-tolerance to tumor antigens. Cancer Res. 2003;63:9007–9015. [PubMed] [Google Scholar]
- 36.Levey DL, Srivastava PK. Alterations in T cells of cancer-bearers: whence specificity? Immunol Today. 1996;1996:365–368. doi: 10.1016/0167-5699(96)10013-X. [DOI] [PubMed] [Google Scholar]
- 37.Mizoguchi H, O’Shea JJ, Longo DL, Loeffler CM, McVicar DW, Ochoa AC. Alterations in signal transduction molecules in T lymphocytes from tumor-bearing mice. Science. 1992;258:1795–1798. doi: 10.1126/science.1465616. [DOI] [PubMed] [Google Scholar]
- 38.Wick M, Dubey P, Koeppen H, Siegel CT, Fields PE, Chen L, Bluestone JA, Schreiber K. Antigenic cancer cells grow progressively in immune hosts without evidence for T cell exhaustion or systemic anergy. J Exp Med. 1997;186:229–238. doi: 10.1084/jem.186.2.229. [DOI] [PMC free article] [PubMed] [Google Scholar]
- 39.Bronte V, Serafini P, Apolloni E, Zanovello P. Tumor-induced immune dysfunctions caused by myeloid suppressor cells. J Immunother. 2001;24:431–446. doi: 10.1097/00002371-200111000-00001. [DOI] [PubMed] [Google Scholar]
- 40.Nanni P, Forni G, Lollini PL. Cytokine gene therapy: hopes and pitfalls. Ann Oncol. 1999;10:261–266. doi: 10.1023/a:1008304721889. [DOI] [PubMed] [Google Scholar]
- 41.Teague TK, Hildeman D, Kedl RM, Mitchell T, Rees W, Schaefer BC, Bender J, Kappler J, Marrack P. Activation changes the spectrum but not the diversity of genes expressed by T cells. Proc Natl Acad Sci USA. 1999;96:12691–12696. doi: 10.1073/pnas.96.22.12691. [DOI] [PMC free article] [PubMed] [Google Scholar]
- 42.Cheadle C, Fan J, Cho-Chung YS, Werner T, Ray J, Do L, Gorospe M, Becker KG. Control of gene expression during T cell activation: alternate regulation of mRNA transcription and mRNA stability. BMC Genomics. 2005;6:75. doi: 10.1186/1471-2164-6-75. [DOI] [PMC free article] [PubMed] [Google Scholar]
- 43.Cheadle C, Fan J, Cho-Chung YS, Werner T, Ray J, Do L, Gorospe M, Becker KG. Stability regulation of mRNA and the control of gene expression. Ann NY Acad Sci. 2005;1058:196–204. doi: 10.1196/annals.1359.026. [DOI] [PubMed] [Google Scholar]
- 44.Northrop JK, Thomas RM, Wells AD, Shen H. Epigenetic remodeling of the IL-2 and IFN-gamma loci in memory CD8 T cells is influenced by CD4 T cells. J Immunol. 2006;177:1062–1069. doi: 10.4049/jimmunol.177.2.1062. [DOI] [PubMed] [Google Scholar]
- 45.Fitzpatrick DR, Shirley KM, Kelso A. Cutting edge: stable epigenetic inheritance of regional IFN-gamma promoter demethylation in CD44highCD8+ T lymphocytes. J Immunol. 1999;162:5053–5057. [PubMed] [Google Scholar]
- 46.Chappell C, Beard C, Altman J, Jaenisch R, Jacob J. DNA methylation by DNA methyltransferase 1 is critical for effector CD8 T cell expansion. J Immunol. 2006;176:4562–4572. doi: 10.4049/jimmunol.176.8.4562. [DOI] [PubMed] [Google Scholar]
- 47.Diehn M, Alizadeh AA, Rando OJ, Liu CL, Stankunas K, Botstein D, Crabtree GR, Brown PO. Genomic expression programs and the integration of the CD28 costimulatory signal in T cell activation. Proc Natl Acad Sci USA. 2002;99:11796–11801. doi: 10.1073/pnas.092284399. [DOI] [PMC free article] [PubMed] [Google Scholar]
- 48.Chtanova T, Kemp RA, Sutherland AP, Ronchese F, Mackay CR. Gene microarrays reveal extensive differential gene expression in both CD4(+) and CD8(+) type 1 and type 2 T cells. J Immunol. 2001;167:3057–3063. doi: 10.4049/jimmunol.167.6.3057. [DOI] [PubMed] [Google Scholar]
- 49.Chtanova T, Tangye SG, Newton R, Frank N, Hodge MR, Rolph MS, Mackay CR. T follicular helper cells express a distinctive transcriptional profile, reflecting their role as non-Th1/Th2 effector cells that provide help for B cells. J Immunol. 2004;173:68–78. doi: 10.4049/jimmunol.173.1.68. [DOI] [PubMed] [Google Scholar]
- 50.Riley JL, Mao M, Kobayashi S, Biery M, Burchard J, Cavet G, Gregson BP, June CH, Linsley PS. Modulation of TCR-induced transcriptional profiles by ligation of CD28, ICOS, and CTLA-4 receptors. Proc Natl Acad Sci USA. 2002;99:11790–11795. doi: 10.1073/pnas.162359999. [DOI] [PMC free article] [PubMed] [Google Scholar]
- 51.Carrabba MG, Castelli C, Maeurer MJ, Squarcina P, Cova A, Pilla L, Renkvist N, Parmiani G, Rivoltini L. Suboptimal activation of CD8(+) T cells by melanoma-derived altered peptide ligands: role of Melan-A/MART-1 optimized analogues. Cancer Res. 2003;63:1560–1567. [PubMed] [Google Scholar]
- 52.Wherry EJ, Ha SJ, Kaech SM, Haining WN, Sarkar S, Kalia SV, Subramaniam S, Blattman JN, Barber DL, Ahmed R. Molecular signature of CD8+ T cell exhaustion during chronic viral infection. Immunity. 2007;27:670–684. doi: 10.1016/j.immuni.2007.09.006. [DOI] [PubMed] [Google Scholar]
- 53.Hay N, Sonenberg N. Upstream and downstream of mTOR. Genes Dev. 2004;18:1926–1945. doi: 10.1101/gad.1212704. [DOI] [PubMed] [Google Scholar]
- 54.Zheng Y, Collins SL, Lutz MA, Allen AN, Kole TP, Zarek PE, Powell JD. A role for mammalian target of rapamycin in regulating T cell activation versus anergy. J Immunol. 2007;178:2163–2170. doi: 10.4049/jimmunol.178.4.2163. [DOI] [PubMed] [Google Scholar]
- 55.Kaech SM, Wherry EJ, Ahmed R. Effector and memory T-cell differentiation: implications for vaccine development. Nat Rev Immunol. 2002;2:251–262. doi: 10.1038/nri778. [DOI] [PubMed] [Google Scholar]
- 56.Watt FM, Hogan BL. Out of Eden: stem cells and their niches. Science. 2000;287:1427–1430. doi: 10.1126/science.287.5457.1427. [DOI] [PubMed] [Google Scholar]
- 57.Williams MA, Bevan MJ. Effector and memory CTL differentiation. Annu Rev Immunol. 2007;25:171–192. doi: 10.1146/annurev.immunol.25.022106.141548. [DOI] [PubMed] [Google Scholar]
- 58.Luckey CJ, Bhattacharaya D, Goldrath AW, Weissman IL, Benoist C, Mathis D. Memory T and memory B cells share a transcriptional program of self-renewal with long-term hematopoietic stem cells. Proc Natl Acad Sci USA. 2006;103:3304–3309. doi: 10.1073/pnas.0511137103. [DOI] [PMC free article] [PubMed] [Google Scholar]
- 59.Joshi NS, Nair N, Begum G, Joshi NB, Sinkar VP, Vora S. Inflammation directs memory precursor and short-lived effector CD8(+) T cell fates via the graded expression of T-bet transcription factor. Immunity. 2007;27:281–295. doi: 10.1016/j.immuni.2007.07.010. [DOI] [PMC free article] [PubMed] [Google Scholar]
- 60.Wherry EJ, Barber DL, Kaech SM, Blattman JN, Ahmed R. Antigen-independent memory CD8 T cells do not develop during chronic viral infection. Proc Natl Acad Sci USA. 2004;101:16004–16009. doi: 10.1073/pnas.0407192101. [DOI] [PMC free article] [PubMed] [Google Scholar]
- 61.Gattinoni L, Klebnoff CA, Palmer DC, Wrzesinski C, Kerstann K, Yu Z, Finkelstein SE, Theoret MR, Rosenberg SA, Restifo NP. Acquisition of full effector function in vitro paradoxically impairs the in vivo antitumor efficacy of adoptively transferred CD8+ T cells. J Clin Invest. 2005;115:1616–1626. doi: 10.1172/JCI24480. [DOI] [PMC free article] [PubMed] [Google Scholar]
Associated Data
This section collects any data citations, data availability statements, or supplementary materials included in this article.
Supplementary Materials
Gene expression data from CD8+ T cells collected from tumor-free and tumor-bearing mice treated with vaccine ± anti-CD25 was examined by GSEA. Data from two independent experiments was analyzed independently and in combination as replicates. Gene sets found to be enriched in tumor-free mice with a p value < 0.05 and a False Discovery Rate (FDR) <0.25 are listed for each experiment. The only gene set found to be enriched in tumor-free mice in all of these analyses was the “Stemcell_Common_Up” gene set.
The leading edge genes of the “Stemcell_Common_Up” gene set were identified in tumor-free mice treated with vaccine and anti-CD25 relative to tumor-bearing mice receiving the same treatment (Figures 3D and 4). These genes were grouped according to the biological processes in which each was reported to be involved. Genes are reported by their gene symbols and Unigene designations.