Abstract
Background
Little is known about long-duration ventricular fibrillation (LDVF), lasting 1-10 minutes when resuscitation is still possible.
Methods and Results
To determine global LV endocardial activation during LDVF, 6 canines (9.5±0.8 kg) received a 64-electrode basket catheter in the left ventricle (LV), a right ventricular (RV) catheter, and a 12-lead ECG. Activation sequences of 15 successive cycles after initiation and after 1, 2, 3, 5, 7, and 10 minutes of LDVF were determined. Early during VF, LV endocardial activation was complex and present throughout most (78.0±9.7%) of each cycle consistent with reentry. After 3-7 min of LDVF in 5 animals, endocardial activation became highly synchronized and present for only a small percentage of each cycle (18.2±7.7%), indicating that LV endocardial reentry was no longer present. During this synchronization, activations arose focally in Purkinje fibers and spread as large wavefronts to excite the Purkinje system followed by the subendocardial working myocardium. During this synchronization, the ECG continued to appear irregular, consistent with VF, and LV cycle length (183±29 ms) was significantly different than RV cycle length (144±14 ms) and significantly different than the LV cycle length when synchronization was not present (130±11 ms).
Conclusion
After 3-7 minutes of LDVF, a highly organized, synchronous, focal LV endocardial activation pattern frequently occurs that is not consistent with reentry but is consistent with triggered activity or abnormal automaticity in Purkinje fibers. The ECG continues to appear irregular during this period, partially because of differences in LV and RV cycle lengths.
Keywords: ventricular fibrillation, mapping, reentry, Purkinje fibers, triggered activity
INTRODUCTION
Sudden cardiac death due to ventricular fibrillation (VF) accounts for at least 100,000 deaths per year in the United States.1 Although much research has been performed investigating VF initiation and early VF, little is known about VF after the first minute, i.e., long-duration VF (LDVF), when most patients are found out-of-hospital with VF. For example, in casinos where the response time is rapid, the median time to the first shock was 4.4 minutes,2 although in most communities the response time is slower than this.3 A few patients are resuscitated after even 10 minutes of VF.1 After 5 minutes of VF, cardiopulmonary resuscitation (CPR) for 3 minutes prior to the first shock resulted in a 22% survival to hospital discharge compared with 4% survival when the defibrillation shock was given before CPR.4 Thus, survival is still possible after more than 5 minutes of VF and different treatment algorithms may be preferable during different durations of LDVF. Therefore, it is important to understand the mechanisms of maintenance of LDVF.
While there is consensus that reentry in the working myocardium is the mechanism maintaining early VF,5 the mechanism of VF maintenance during LDVF is less clear. Li et al, using a 504 electrode 3D array in the LV free wall in a porcine model, found that all reentry ceased after 3 minutes of VF.6 Allison et al found differences in transmural electrical activity during LDVF in dogs and pigs.7 After 5 minutes of LDVF, dogs developed a transmural gradient of activation rate with the endocardium activating more rapidly than the epicardium and with the activation wavefronts traveling predominantly from the endocardium toward the epicardium with many wavefronts blocking en route, consistent with the earlier findings of Worley et al.8 Neither of these findings was present in pigs.7 These differences in LDVF activation may be related to the fact that the Purkinje fibers terminate near the endocardium in dogs, as in humans, but extend almost to the epicardium in pigs.9, 10 Using a 504-electrode plaque, Tabereaux et al mapped a small portion of the canine left ventricular (LV) endocardium and found evidence that Purkinje activation plays a significant role in LDVF maintenance, possibly through triggered activity or abnormal automaticity.11 They reported that wavefronts frequently appeared focally on the endocardium throughout LDVF with Purkinje to myocardial activation accounting for more than 20% of wavefronts during 5-7 minutes of LDVF.11 However, only about 5 cm2 of the endocardium was mapped in that study so that the degree of organization of Purkinje and subendocardial working myocardial activation throughout most of the endocardium is unknown.
Theses studies raise the possibility that, instead of reentry within the myocardium, LDVF in dogs is at least partially maintained by activation wavefronts that arise focally in Purkinje fibers near the endocardium and then propagate towards the epicardium with variable sites of intramural conduction block. Thus, to understand the maintenance of LDVF it is crucial to study the activation sequences near the endocardium. Although global endocardial mapping of myopathic human hearts during the first few seconds of VF,12 noncontact global endocardial mapping of dog hearts in LDVF,13 and simultaneous endocardial basket recording of the endocardium and optical mapping of the epicardium in small mammals14 have been performed, there have been no large animal studies to determine the characteristics and degree of organization of global LV endocardial activation during LDVF. The goal of this study was to perform such an experiment.
METHODS
The use of experimental animals in this study was managed in accordance with the guidelines established by the American Heart Association on research animals,15 and the protocol was approved by the Institutional Animal Care and Use Committee at the University of Alabama at Birmingham.
Six beagles (9.5±0.9kg) were fasted overnight and anesthetized with sodium thiopental, 25mg/kg IV, intubated with a cuffed endotracheal tube, and mechanically ventilated with 2%-3% isoflurane in 100% oxygen in a restrained, dorsally recumbent position. A water-heated pad was used to maintain body temperature at 37°C. Dogs were instrumented with a carotid arterial line for blood pressure measurement and an internal jugular vein access for electrolyte repletion with calcium, acid/base maintenance with sodium bicarbonate, volume maintenance with intravenous normal saline and anticoagulation with IV heparin. Heparin was administered with a 300 u/kg loading dose followed by a maintenance rate of 100 u/kg every hour.
Through carotid artery access, a 31 mm diameter, 64 unipolar electrode mapping basket (Constellation, Boston Scientific EP Technologies, Watertown, MA, USA) was positioned retrograde through the aortic valve into the LV apex with fluoroscopic guidance. An electrophysiology lead with a distal tip unipolar electrode and a proximal unipolar electrode was placed into the RV apex through internal jugular access under fluoroscopy. Another electrophysiology lead, similar to the RV lead, was maneuvered into the right atrial appendage. From the anterior-posterior and lateral views, fluoroscopy images were taken to identify the anatomical orientation of the basket. Electrodes for a 12 lead ECG and defibrillation patches with a left lateral to right lateral orientation were applied.
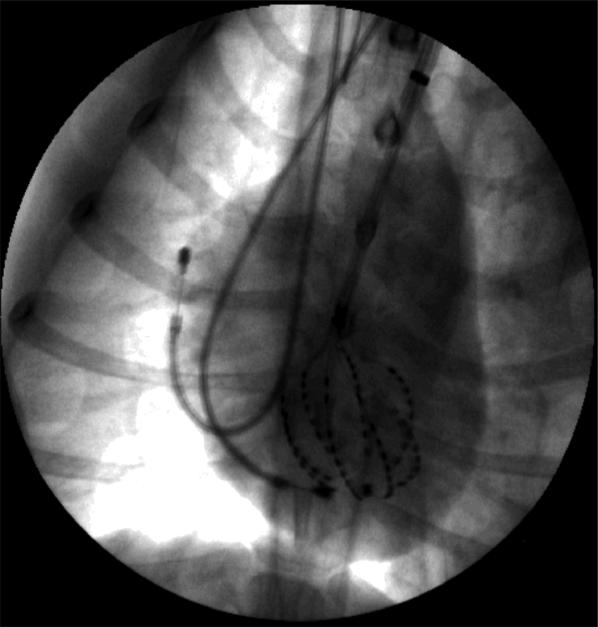
To provide control data for another study, a 3 crossing up-down DFT bracketing protocol was performed as previously described.16 This protocol required the induction of 5-7 episodes of short duration VF by rapid pacing through the RV apex. Five minutes after the DFT determination, normal sinus rhythm was recorded for 5 s. VF was then reinitiated and recorded until it spontaneously terminated. Fluoroscopy images were taken at the termination of the study to re-evaluate basket orientation (Figure 1).
Figure 1.
Anterior-posterior chest X-ray showing the basket electrodes in the LV as well as the RV and right atrial catheters in one animal.
The 64 electrodes of the basket, the 12 ECG leads, 2 right atrial electrodes, and 2 RV electrodes were recorded with a 528 channel cardiac data acquisition system at a 2 KHz sampling rate and filtered with 0.5 Hz high pass and 500 Hz low pass filters. Fifteen successive VF activation cycles were analyzed at the initiation of VF, and after 1, 2, 3, 5, 7, and 10 min of VF.
Purkinje and ventricular activations were identified in the 64 basket electrodes and the 2 RV electrode recordings using MATLAB software that was manually over-read as previously described.6 Ventricular (V) activations were chosen at the time of the most negative dV/dt during complexes that were >4 ms long and the dV/dt was more negative than -0.5 mV/ms. Purkinje (P) activations were identified at the time of the most negative dV/dt during complexes that were ≤4 ms long and the dV/dt was more negative than -0.1 mV/ms, as previously described.6
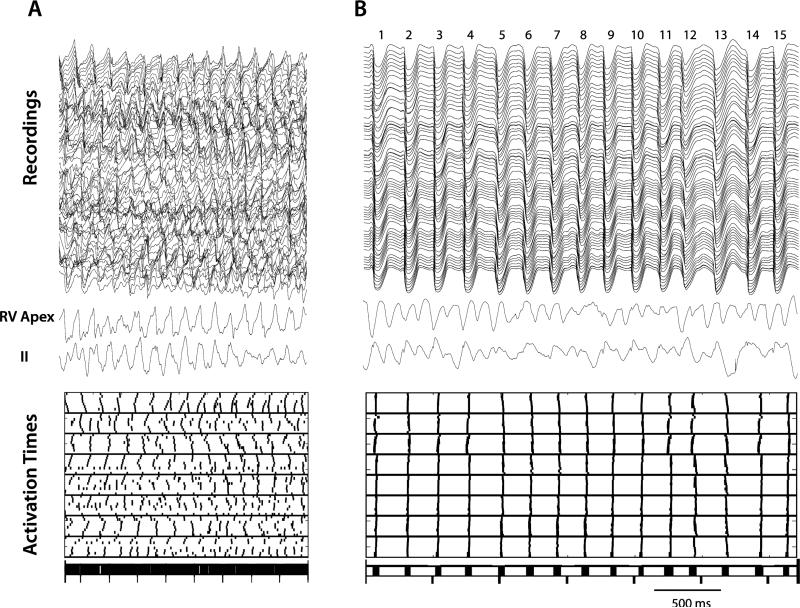
Our initial analysis of the activations during LDVF revealed periods of highly synchronous, almost simultaneous activation in the 64 electrodes with large temporal gaps between each cycle of activation (Figure 2). To quantify the fraction of the cycle lengths in which no activations were present the following analysis was performed. All of the V activation times for all 64 basket electrodes for the 15 analyzed cycles of VF were written in temporal order into a single string of activation times. The 14 largest temporal gaps in this string of activation times were determined (Figure 2). The mean of these 14 temporal gaps was divided by the mean cycle length to determine the mean fraction of the cycle lengths during which no activations were present for that time interval of VF.
Figure 2.
Recordings and activation times for 15 cycles soon after the onset of VF (A) and after 5 min of VF (B). The 64 unipolar basket recordings are shown in the top of each panel with an RV unipolar recording and ECG lead II below them. Below the ECG are the V activation times for the 64 basket electrodes during the same time period with each short vertical line representing an activation. At the bottom of each panel the activations for all 64 electrodes are shown on a single line. The 15 cycles are numbered at the top of panel B. In A, endocardial activations are present throughout the cardiac cycles consistent with reentry. In B, however, activation is highly synchronized with activation present during only a small part of the cardiac cycle, so that 14 large temporal gaps are present between the 15 cycles of activation in which no activations are present. This finding is inconsistent with reentry near the LV endocardium. In both panels, RV activation and ECG lead II appear disorganized as expected for VF.
RV activations were identified during these same time intervals using the RV electrode with the better signal. To determine the mean LV cycle length during VF, the earliest activation time in the 64 electrode recordings for the 1st cycle was subtracted from the earliest activation time for the 15th cycle and divided by 14. The same was done for the RV electrode to determine the mean RV cycle length. Differences in mean cycle length for the LV and RV were evaluated with a paired t-test. The ECG was examined during each time interval to verify that it exhibited the disorganized pattern of VF.
Isochronal maps of each cycle of each VF time interval were made separately for the P activations and the V activations for the basket electrode recordings. Based on the fluoroscopic images, the isochronal maps for each heart were rotated into approximately the same orientation with respect to cardiac anatomy. The V activation times of the 64 electrodes for each activation cycle were compared with the V activation times of all of the other cycles during that VF time interval for the same animal with Spearman's correlation coefficient. All cycles with a correlation coefficient >0.90 were placed in the same group and were taken to have similar activation sequences.
The relationship between P and V activations was assessed by determining the percentage of cycles during which P activations preceded V activations. When this relationship was present, the coupling intervals between the P and V activation were determined for each cycle. The locations of the earliest P activation and the earliest V activation were compared.
Means ± standard deviations are given unless specified otherwise. P≤0.05 was considered significant. Mutual information, a unitless measure of the mutual dependence of two variables, was calculated for all the analyzed time intervals of VF using the algorithm of Omichi et al17 between the six possible pairs of the following recordings: (1) one of the RV electrodes, (2) an LV electrode in the midseptum, (3) an LV electrode in the midfree wall, and (4) Limb Lead II. The recordings were normalized so that their largest value was 1 and the smallest value was 0. Each normalized recording was partitioned into 10 bins, 0.1 in size. The largest possible mutual information, when the two recordings are totally dependent, is equal to the entropy of the recordings, which is about 3 for LDVF. The smallest possible mutual information, when the two recordings are totally independent, is 0. Mutual information was compared during time intervals when ventricular electrical synchrony (VES, defined in the first paragraph of the Results Section) was present and when it was absent. ANOVA with repeated measures (SAS version 9.2, SAS Institute Inc., Carey, NC) was performed with mutual information as the dependent variable and the presence or absence of VES, the different pairs of recordings, and the duration of VF as factors with the animal number as subject factor.
RESULTS
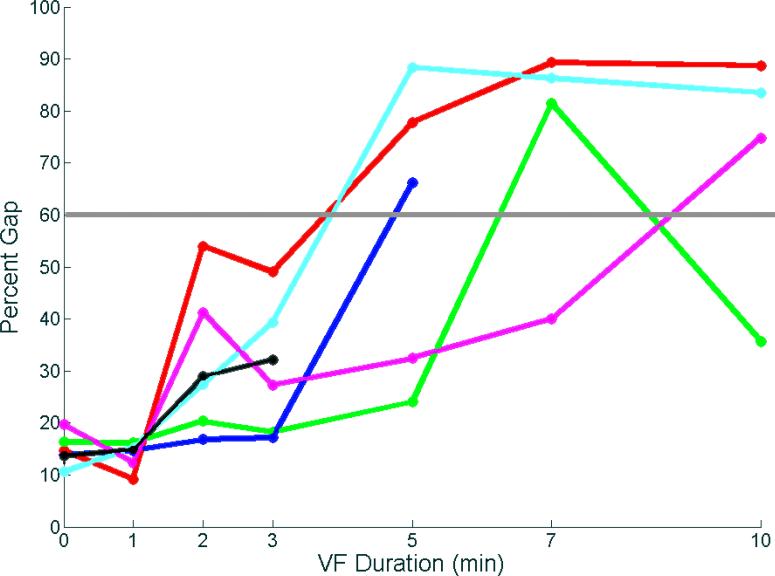
In 5 of the 6 dogs, the complex endocardial activation patterns of early VF (Figure 2A) were replaced after 3-7 min of VF by highly organized activation sequences (Figure 2B). During this time all of the endocardial V activations in the mapped region occurred synchronously during 40% or less of the cardiac cycle so that gaps with no endocardial activations were present 60% or more of the time. We named this activation pattern ventricular electrical synchrony (VES). The LV cycle lengths were irregular during VES, while RV activation appeared to be independent of that in the LV and continued to exhibit the disorganized pattern typical of VF as did the ECG (Figure 2).
The animals displayed VES at different time intervals, but no intervals were earlier than 3 minutes of VF (Figure 3). In 4 of the 5 animals that displayed VES, once this pattern began it was seen at all subsequent time points until spontaneous termination of VF occurred. In one animal, however, VES was present at 7 minutes, with a return to a more disorganized pattern with a percent gap <45% at 10 min of VF.
Figure 3.
Mean of the 14 largest gaps in activation times during different durations of VF in each animal. The gap is expressed as the percent of the mean VF cycle length during that time interval. Each animal is represented by a different color. VF spontaneously terminated after 3 min in the animal represented by the black line and after 5 min in the animal represented by the blue line. A percent gap >60% (gray line) was considered VES.
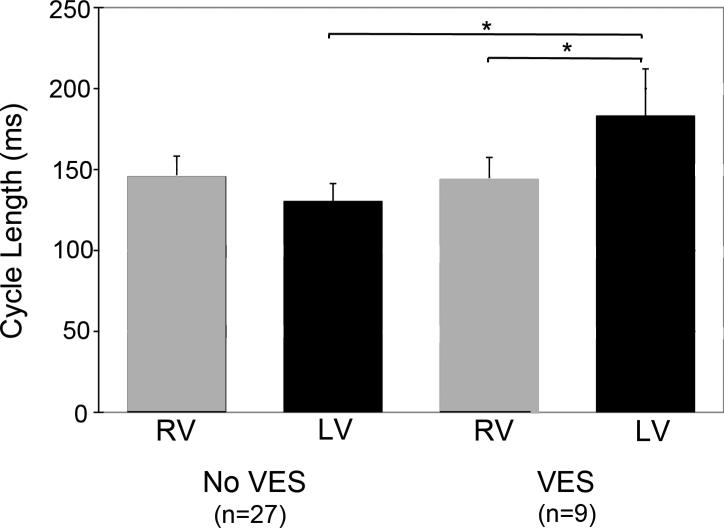
The mean LV activation rate was markedly slower (P<0.05) during VES than during the last time interval before VES began (Figure 4). The mean LV activation rate was also markedly slower (P<0.05) than the RV activation rate during VES. However, the RV activation rate was not significantly different than the LV activation rate for the time interval just before VES began nor did the RV activation rate change significantly when VES began in the LV.
Figure 4.
VF cycle lengths during the last time interval before VES onset and during VES. Mean RV and LV cycle lengths are shown with the standard deviation indicated by an error bar. The brackets with an asterisk indicate significant differences.
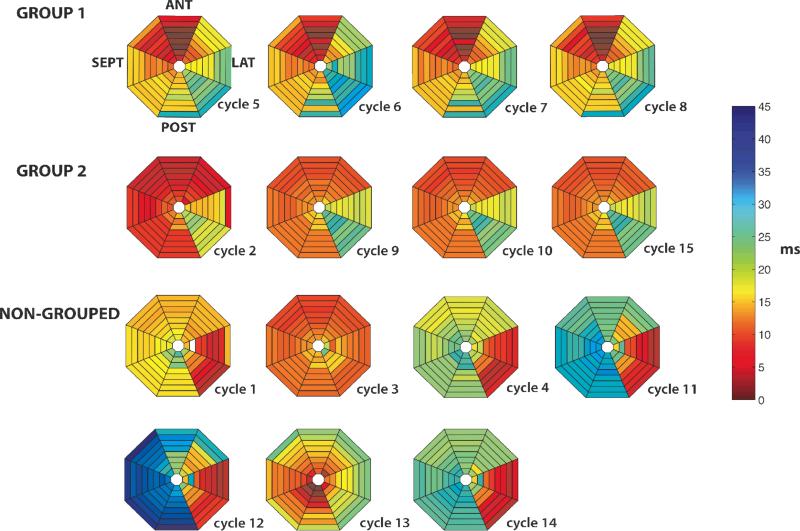
V activations during the VES cycles arose focally with no indication of reentry (Figure 5). However, the sites of the foci were not the same for all cycles. When all cycles of an analyzed time interval were assigned to groups with similar activation patterns by determining which cycles had a Spearman's correlation coefficient ≥0.9 with each other (Figure 5), 6.2±4.1 groups were found for each time interval analyzed for each animal, and 5.1±3.9 of these groups contained only a single cycle, indicating that the synchronous activation cycles arose focally from several different sites. Most of these sites, were not sites of early activation during sinus rhythm.
Figure 5.
V activation sequences for the 15 VES cycles shown in Figure 2B. Colors represent activation times of the 64 basket electrodes according to the time scale shown to the right. White indicates no activation recorded at that electrode, probably because of poor electrode contact of the basket with the endocardium. Each of the 8 pie-shaped numbered segments represents activation times from a single spline of the basket with the most apical electrode of the spline toward the center and the most basal electrode toward the periphery. The orientation of the basket within the LV is given for the top left activation map. All 15 cycles have a focal origin, but the location of the earliest activation site is not the same for all cycles. The 4 cycles in group 1 had a Spearman correlation ≥0.9 with each other as did the 4 cycles in group 2. The other 7 cycles did not have a Spearman correlation ≥0.9 with any of the other 14 cycles.
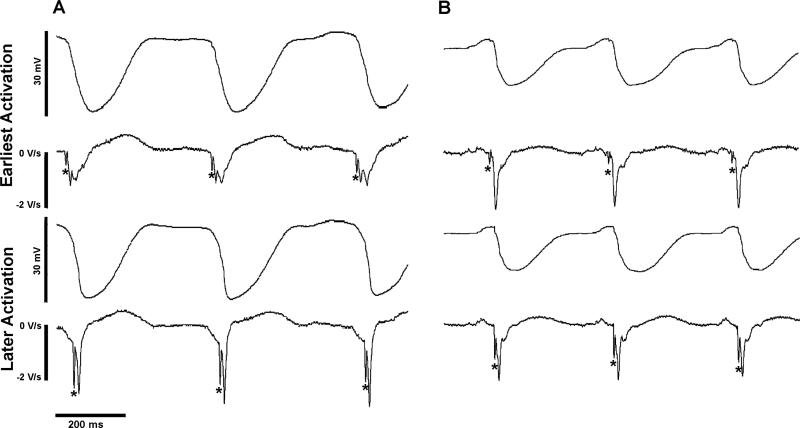
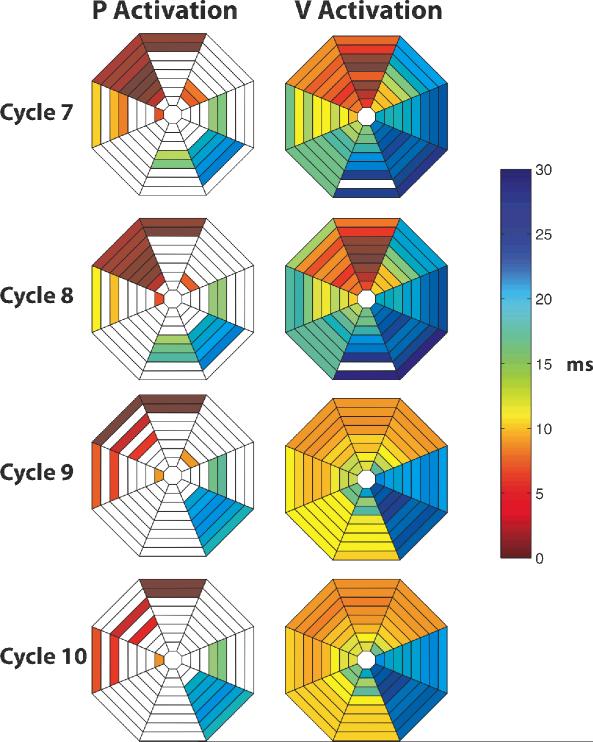
Fewer P activations than V activations were detected during VES. However, those P activations that were recorded almost always preceded V activations (Figure 6). In addition, the earliest recorded P activations were in the same anatomic region as and led the earliest V activations, (Figure 7) suggesting that the V activation sequence was initiated by P activation spreading through P-V junctions.
Figure 6.
Examples of P activations preceding V activations during VES. Unipolar recordings with their temporal derivatives below are shown with P activations indicated by asterisks. In (A), the top tracings are from the electrode recording earliest activation during cycles 6, 7, and 8 shown in Figure 2B after 5 min of VF. In (B), the top tracings are from the electrode recording earliest activation during 3 cycles after 10 min of VF in the same heart. In both (A) and (B), the lower tracings are from electrode 28 in the LV basket.
Figure 7.
P and V activation sequences for cycles 7-10 of the VES cycles shown in Figure 2B. P activations lead V activations and earliest P activations are near earliest V activations. Please see Figure 5 for explanation of the activation maps.
Mutual information among an RV electrode, an LV electrode in the midseptum, an LV electrode in the midfree wall, and Limb Lead II is shown in the Table for those analyzed time segments of VF when VES was absent and those segments when it was present. ANOVA indicated that mutual information (1) was significantly higher when VES was present than when it was absent, (2) was significantly higher between the two LV electrodes than between the LV and RV electrodes or between the cardiac electrodes and ECG lead II, and (3) increased as the duration of VF increased.
Table.
| Mutual Information | ||
|---|---|---|
| Comparison |
Non-VES |
VES |
| LVS-LVL |
0.65±0.27 |
1.80±0.21 |
| RV-LVS |
0.44±0.08 |
0.65±0.20 |
| RV-LVL |
0.42±0.09 |
0.62±0.18 |
| LVS-II |
0.53±0.20 |
0.69±0.30 |
| LVL-II |
0.50±0.22 |
0.70±0.30 |
| RV-II | 0.53±0.21 | 0.63±0.25 |
LVS=LV septum electrode, LVL=LV lateral free wall electrode, RV=RV electrode, II=limb lead II, NON-VES= the 28 analyzed time intervals when VES was absent, VES= the 9 analyzed time intervals when VES was present.
DISCUSSION
The major findings of this study are as follows: (1) After the first 3 minutes of VF, periods of VES occur in which activation near the endocardium is highly organized and synchronized, with activation present < 40% of the cardiac cycle; (2) During the periods of VES, instead of reentry, a focal activation pattern with an irregular cycle length is present in the working myocardium of the LV with earliest endocardial activation occurring at different sites during different cycles; (3) During the periods of VES, P activation is recorded before V activation; (4) During the periods of VES, the LV activation rate is significantly slower than when the VES pattern is not present; (5) During the periods of VES, RV and LV activation appears dissociated, with a significantly slower activation rate in the LV than in the RV and significantly lower mutual information between RV and LV electrodes than between two LV electrodes; (6) During the periods of VES, the body surface ECG continues to exhibit a disorganized VF pattern.
The two most common theories for VF maintenance both involve reentry. The multiple wavelet hypothesis proposed by Moe et al18 states that wavelets follow constantly changing pathways because of heterogeneity in refractoriness leading to variable sites of conduction block. The mother rotor hypothesis states that a single, stationary, stable reentrant circuit exists in the region with the shortest refractory period that gives rise to wavefronts that propagate to the remainder of the tissue, frequently blocking en route.19, 20,21 Both mechanisms have been studied extensively in early VF with controversy as to which maintains VF. Chen et al22 attempted to resolve this controversy by stating that VF can be broken into two distinct types: type 1 with rapidly activating, short-lived, non-repeating reentrant circuits maintaining VF by the multiple wavelet hypothesis and type 2 with slower activating, more reproducible pathways consistent the mother rotors. Nash et al23 reported that during early VF in humans, epicardial mapping showed both multiple wavelets and mother rotors to be present.
Several previous studies indicate that VF evolves during the first 10 minutes of its existence, passing through 3, 4, or 5 stages.24-26 Regardless of the number of stages, VF is not a static process and therefore mechanisms for its maintenance may also change as time elapses during VF. For example, Chen et al. reported that type 1 VF is seen early in VF, while type 2 is associated with VF lasting more than 1 minute, when the myocardial tissue is less excitable.22 The dynamic changes in VF over time suggest that the best treatment for the arrhythmia may also change with time,27 which further reinforces the need for better understanding of LDVF mechanisms.
Although reentry is frequently seen in rabbits and guinea pigs during early VF, less than 8% of epicardial wavefronts exhibit reentry in early VF in larger hearts 25, 28, 29 Intramural reentry has been proposed as a possible rotor site.30 Although intramural reentry has been detected during early VF by 3-dimensional intramural mapping in swine, it is no longer present after 3 min of VF.6 In this same study, intramural foci increased from 6% of all wavefronts in early VF to 27% by 10 min of VF.
One possible source for these foci is Purkinje fibers that are present almost transmurally in swine as opposed to humans and canines where they are primarily confined to the subendocardium.10 The characteristics of Purkinje fibers are consistent with their being a source of activation during LDVF. Due to their high glycogen reserves, they are more tolerant of the global ischemia during VF than is the working myocardium.31-33 In addition, the refractory period for Purkinje fibers decreases markedly as activation rates increase so that at the rapid activation rates of VF their refractory period is as short as or shorter than the working myocardium.34 Furthermore, triggered activity has been shown in Purkinje fibers during periods of low pH and high K+ as occurs during global ischemia, and abnormal automaticity in Purkinje fibers has been reported in ischemic hearts.35
With a plaque of 504 electrodes, 1 mm apart, Tabereaux et al recorded from approximately 5 cm2 of the endocardium at the insertion of the anterolateral papillary muscle in isolated canine hearts with the endocardium exposed during LDVF.11 They observed conduction from the working myocardium into Purkinje fibers as well as conduction from Purkinje fibers into working myocardium. They also observed wavefronts that appeared to arise focally on the endocardium.11 When Lugol's solution was used to ablate the Purkinje network in this model, VF spontaneously self-terminated significantly earlier (4.9 min) than in the control hearts in which Lugol's solution was not applied (9.2 min).36 All of these findings support the possibility that the Purkinje fibers contribute to the maintenance of LDVF and that activation may arise in them focally, by triggered activity or abnormal automaticity.
Because only about 5 cm2 of the endocardium was mapped in the study by Tabereaux et al,11 it was not possible to determine the spatial extent of the endocardium that was activated by the wavefronts arising focally in the Purkinje fibers. Our study demonstrated the surprising finding that during the VES pattern, the focal activations arising in the Purkinje fibers quickly spread through the majority of the endocardium, both in the Purkinje fibers as well as in the working myocardium so that LV global endocardial activation was highly organized and almost synchronous.
A rough calculation suggests that the endocardial conduction velocity was too rapid to have been caused by conduction through the working myocardium. The mean LV cycle length during VES was 183 ms and the mean fraction of the cycle length during which endocardial activation was present during VES was 0.182. Therefore, the mean time for the activation to propagate over the mapped endocardium during VES was 33.3 ms. The diameter of the basket was 38 mm, so that the circumference was 119.4 mm. The shortest distance for an activation front arising focally on the endocardium to activate all of the myocardium adjacent to the basket is half of the circumference, 59.7 mm. Thus, the minimum conduction velocity during VES was a mean of 1.79 m/s, which is too fast for propagation through working myocardium.37
It is possible that the VES pattern was caused by reentry that was not detected because of the widely spaced endocardial electrodes and the lack of intramural electrodes. However, several findings suggest that VES was caused by triggered activity or abnormal automaticity. One, during at least 60% of the cycle length no endocardial activations were recorded, suggesting reentry was not present near the endocardium. Two, the endocardial activation sequence had a focal activation pattern. Three, previous studies have indicated that the majority of intramural wavefronts propagate away from the endocardium during LDVF instead of towards it, which would be necessary if an intramural reentrant circuit was responsible for the focal endocardial activation sequence.7, 31 Four, neither the earliest site of recorded activation nor the cycle length was constant during VES as would be expected for a mother rotor. Five, the cycle lengths were longer during the VES pattern than before VES appeared. This is consistent with the rapid activations of reentry present before VES overdrive suppressing triggered activity or abnormal automaticity. When the rapid activations of reentry were no longer present during VES, the slower activations of triggered activity or abnormal automaticity could appear.
Another possibility is that the LV activation fronts during VES originated from the RV, which has a significantly higher activation rate during VES than does the LV (Figure 4). The fact that many of the foci arose in the free wall of the LV is not compatible with their source being wavefronts propagating across the septum from the RV to the LV. It is possible that activation could have proceeded retrogradely up the right bundle and then down the left bundle to give rise to the early sites in the Purkinje fibers. However, most of the early sites of focal activation during VES were not early sites of activation during sinus rhythm. In addition, although there was high mutual information between two LV electrodes during VES, the mutual information between an RV electrode and the two LV electrodes was low (Table), suggesting that activation in the two ventricles was not closely coupled during VES.
There are several possible reasons that the ECG continues to exhibit the disorganized pattern of VF while endocardial activation is synchronous and organized during VES. One, the different cycles have different activation sequences (Figure 5), each of which could cause a complex with different morphology in the ECG. Two, the synchronous wavefronts on the endocardium probably propagate through the LV wall towards the epicardium with variable incidence and location of conduction block en route, as has been reported previously in canines, which could generate a complex pattern in the ECG.7, 31 Three, RV activation appears disorganized (Figure 2) and has a different cycle length than the LV (Figure 4) during VES. Both of these factors would be expected to cause the contribution of the RV to the ECG to be complex and changing. However, as shown in the Table, there is some mutual information between lead II and the RV and LV electrodes and this mutual information is higher when VES is present than when it is absent.
Limitations
The study has several limitations. Although the lower two-thirds of the LV endocardium was mapped, the basal one-third was not. The endocardial electrodes were widely spaced so that fine details of the endocardial activation sequence were not identified. To allow the chest to remain intact so that the heart was in a more natural state and so that a good quality ECG could be recorded, intramural recordings were not made. The RV was not mapped.
Conclusions and Clinical Implication
In addition to the two types of VF described by Chen et al,22 a third type of VF appears to exist during LDVF in which global LV endocardial activation is rapid, synchronous, and present for no more than 40% of the cardiac cycle. This third type of VF, VES, may be maintained by triggered activity or abnormal automaticity arising in Purkinje fibers, instead of by reentry. The possible clinical significance of this finding is that the heart may respond differently to different therapies such as a defibrillation shock when VES is present than when it is absent.
Acknowledgments
We thank Frank Vance and Cheryl Killingsworth for assistance with the experimental preparation of the animals. We also thank Catherine Sreenan for her assistance with editing, figures and formatting.
This work was supported by National Institutes of Health grants HL-28429, HL-66256, and HL-85370
Footnotes
Robichaux: Periods of Highly Organized Activation during VF
No disclosures.
Literature Cited
- 1.Valenzuela TD, Roe DJ, Cretin S, Spaite DW, Larsen MP. Estimating effectiveness of cardiac arrest intervention: a logistic regression survival model. Circulation. 1997;96:3308–3313. doi: 10.1161/01.cir.96.10.3308. [DOI] [PubMed] [Google Scholar]
- 2.Valenzuela TD, Roe DJ, Nichol G, Clark LL, Spaite DW, Hardman RG. Outcomes of Rapid Defibrillation by Security Officers after Cardiac Arrest in Casinos. N Engl J Med. 2000;343:1206–1209. doi: 10.1056/NEJM200010263431701. [DOI] [PubMed] [Google Scholar]
- 3.Hallstrom AP, Ornato JP, Weisfeldt M, Travers A, Christenson J, McBurnie MA, Zalenski R, Becker LB, Schron EB, Proschan M. Public-access defibrillation and survival after out-of-hospital cardiac arrest. N Engl J Med. 2004;351:637–646. doi: 10.1056/NEJMoa040566. [DOI] [PubMed] [Google Scholar]
- 4.Wik L, Hansen TB, Fylling F, Steen T, Vaagenes P, Auestad BH, Steen PA. Delaying defibrillation to give basic cardiopulmonary resuscitation to patients with out-of-hospital ventricular fibrillation: a randomized trial. JAMA. 2003;289:1389–1395. doi: 10.1001/jama.289.11.1389. [DOI] [PubMed] [Google Scholar]
- 5.Weiss JN, Qu Z, Chen PS, Lin SF, Karagueuzian HS, Hayashi H, Garfinkel A, Karma A. The dynamics of cardiac fibrillation. Circulation. 2005;112:1232–1240. doi: 10.1161/CIRCULATIONAHA.104.529545. [DOI] [PubMed] [Google Scholar]
- 6.Li L, Jin Q, Huang J, Cheng KA, Ideker RE. Intramural foci during long duration fibrillation in the pig ventricle. Circ Res. 2008;102:1256–1264. doi: 10.1161/CIRCRESAHA.107.170399. [DOI] [PMC free article] [PubMed] [Google Scholar]
- 7.Allison JS, Qin H, Dosdall DJ, Huang J, Newton JC, Allred JD, Smith WM, Ideker RE. The transmural activation sequence in porcine and canine left ventricle is markedly different during long-duration ventricular fibrillation. J Cardiovasc Electrophysiol. 2007;18:1306–1312. doi: 10.1111/j.1540-8167.2007.00963.x. [DOI] [PubMed] [Google Scholar]
- 8.Worley SJ, Swain JL, Colavita PG, Smith WM, Ideker RE. Development of an endocardial-epicardial gradient of activation rate during electrically induced, sustained ventricular fibrillation in dogs. Am J Cardiol. 1985;55:813–820. doi: 10.1016/0002-9149(85)90162-6. [DOI] [PubMed] [Google Scholar]
- 9.Holland RP, Brooks H. The QRS complex during myocardial ischemia. An experimental analysis in the porcine heart. J Clin Invest. 1976;57:541–550. doi: 10.1172/JCI108309. [DOI] [PMC free article] [PubMed] [Google Scholar]
- 10.Hamlin RL, Burton RR, Leverett SD, Burns JW. Ventricular activation process in minipigs. J Electrocardiol. 1975;8:113–116. doi: 10.1016/s0022-0736(75)80018-5. [DOI] [PubMed] [Google Scholar]
- 11.Tabereaux PB, Walcott GP, Rogers JM, Kim J, Dosdall DJ, Robertson PG, Killingsworth CR, Smith WM, Ideker RE. Activation patterns of Purkinje fibers during long-duration ventricular fibrillation in an isolated canine heart model. Circulation. 2007;116:1113–1119. doi: 10.1161/CIRCULATIONAHA.107.699264. [DOI] [PubMed] [Google Scholar]
- 12.Masse S, Downar E, Chauhan V, Sevaptsidis E, Nanthakumar K. Ventricular fibrillation in myopathic human hearts: mechanistic insights from in vivo global endocardial and epicardial mapping. Am J Physiol Heart Circ Physiol. 2007;292:H2589–2597. doi: 10.1152/ajpheart.01336.2006. [DOI] [PubMed] [Google Scholar]
- 13.Pierpont GL, Chugh SS, Hauck JA, Gornick CC. Endocardial activation during ventricular fibrillation in normal and failing canine hearts. Am J Physiol Heart Circ Physiol. 2000;279:H1737–H1747. doi: 10.1152/ajpheart.2000.279.4.H1737. [DOI] [PubMed] [Google Scholar]
- 14.Wu TJ, Lin SF, Hsieh YC, Ting CT, Chen PS. Ventricular fibrillation during no-flow global ischemia in isolated rabbit hearts. J Cardiovasc Electrophysiol. 2006;17:1112–1120. doi: 10.1111/j.1540-8167.2006.00557.x. [DOI] [PubMed] [Google Scholar]
- 15.AHA Special Report: Position of the American Heart Association on Research Animal Use. Circulation. 1985;71:849A–850A. [PubMed] [Google Scholar]
- 16.Huang J, Rogers JM, Killingsworth CR, Walcott GP, KenKnight BH, Smith WM, Ideker RE. Improvement of defibrillation efficacy and quantification of activation patterns during ventricular fibrillation in a canine heart failure model. Circulation. 2001;103:1473–1478. doi: 10.1161/01.cir.103.10.1473. [DOI] [PubMed] [Google Scholar]
- 17.Omichi C, Lamp ST, Lin SF, Yang J, Baher A, Zhou S, Attin M, Lee MH, Karagueuzian HS, Kogan B, Qu Z, Garfinkel A, Chen PS, Weiss JN. Intracellular Ca dynamics in ventricular fibrillation. Am J Physiol Heart Circ Physiol. 2004;286:H1836–H1844. doi: 10.1152/ajpheart.00123.2003. [DOI] [PubMed] [Google Scholar]
- 18.Moe GK, Rheinboldt WC, Abildskov JA. A computer model of atrial fibrillation. Am Heart J. 1964;67:200–220. doi: 10.1016/0002-8703(64)90371-0. [DOI] [PubMed] [Google Scholar]
- 19.Lewis T. The Mechanism and Graphic Registration of the Heart Beat. Shaw and Sons, Ltd.; London: 1925. [Google Scholar]
- 20.Gurvich NL. The Main Principles of Cardiac Defibrillation. Medicine; Moscow, Russia: 1975. [Google Scholar]
- 21.Gray RA, Jalife J, Panfilov AV, Baxter WT, Cabo C, Davidenko JM, Pertsov AM. Mechanisms of cardiac fibrillation: Drifting rotors as a mechanism of cardiac fibrillation. Science. 1995;270:1222–1225. [PubMed] [Google Scholar]
- 22.Chen PS, Wu TJ, Ting CT, Karagueuzian HS, Garfinkel A, Lin SF, Weiss JN. A tale of two fibrillations. Circulation. 2003;108:2298–2303. doi: 10.1161/01.CIR.0000094404.26004.07. [DOI] [PubMed] [Google Scholar]
- 23.Nash MP, Mourad A, Clayton RH, Sutton PM, Bradley CP, Hayward M, Paterson DJ, Taggart P. Evidence for multiple mechanisms in human ventricular fibrillation. Circulation. 2006;114:536–542. doi: 10.1161/CIRCULATIONAHA.105.602870. [DOI] [PubMed] [Google Scholar]
- 24.Wiggers CJ. Studies of ventricular fibrillation caused by electric shock: Cinematographic and electrocardiographic observations of the natural process in the dog's heart: Its inhibition by potassium and the revival of coordinated beats by calcium. Am Heart J. 1930;5:351–365. doi: 10.1046/j.1542-474X.2003.08316.x. [DOI] [PMC free article] [PubMed] [Google Scholar]
- 25.Huang J, Rogers JM, Killingsworth CR, Singh KP, Smith WM, Ideker RE. Evolution of activation patterns during long-duration ventricular fibrillation in dogs. Am J Physiol Heart Circ Physiol. 2004;286:H1193–1200. doi: 10.1152/ajpheart.00773.2003. [DOI] [PubMed] [Google Scholar]
- 26.Huizar JF, Warren MD, Shvedko AG, Kalifa J, Moreno J, Mironov S, Jalife J, Zaitsev AV. Three distinct phases of VF during global ischemia in the isolated blood-perfused pig heart. Am J Physiol Heart Circ Physiol. 2007;293:H1617–1628. doi: 10.1152/ajpheart.00130.2007. [DOI] [PubMed] [Google Scholar]
- 27.Weisfeldt ML, Becker LB. Resuscitation after cardiac arrest: a 3-phase time-sensitive model. JAMA. 2002;288:3035–3038. doi: 10.1001/jama.288.23.3035. [DOI] [PubMed] [Google Scholar]
- 28.Rogers JM, Huang J, Smith WM, Ideker RE. Incidence, evolution and spatial distribution of functional reentry during ventricular fibrillation in pigs. Circ Res. 1999;84:945–954. doi: 10.1161/01.res.84.8.945. [DOI] [PubMed] [Google Scholar]
- 29.Nanthakumar K, Huang J, Rogers JM, Johnson PL, Newton JC, Walcott GP, Justice RK, Rollins DL, Smith WM, Ideker RE. Regional differences in ventricular fibrillation in the open-chest porcine left ventricle. Circ Res. 2002;91:733–740. doi: 10.1161/01.res.0000038945.66661.21. [DOI] [PubMed] [Google Scholar]
- 30.Winfree AT. Electrical turbulence in three-dimensional heart muscle. Science. 1994;266:1003–1006. doi: 10.1126/science.7973648. [DOI] [PubMed] [Google Scholar]
- 31.Gilmour RF, Jr., Zipes DP. Different electrophysiological responses of canine endocardium and epicardium to combined hyperkalemia, hypoxia, and acidosis. Circ Res. 1980;46:814–825. doi: 10.1161/01.res.46.6.814. [DOI] [PubMed] [Google Scholar]
- 32.Gilmour RF, Jr., Evans JJ, Zipes DP. Purkinje-muscle coupling and endocardial response to hyperkalemia, hypoxia, and acidosis. Am J Physiol. 1984;247:H303–311. doi: 10.1152/ajpheart.1984.247.2.H303. [DOI] [PubMed] [Google Scholar]
- 33.Bagdonas AA, Stuckey JH, Piera J, Amer NS, Hoffman BF. Effects of ischemia and hypoxia on the specialized conducting system of the canine heart. Am Heart J. 1961;61:206–218. doi: 10.1016/0002-8703(61)90577-4. [DOI] [PubMed] [Google Scholar]
- 34.Robinson RB, Boyden PA, Hoffman BF, Hewett KW. Electrical restitution process in dispersed canine cardiac Purkinje and ventricular cells. Am J Physiol. 1987;253:H1018–1025. doi: 10.1152/ajpheart.1987.253.5.H1018. [DOI] [PubMed] [Google Scholar]
- 35.Pogwizd SM, Onufer JR, Kramer JB, Sobel BE, Corr PB. Induction of delayed afterdepolarizations and triggered activity in canine Purkinje fibers by lysophosphoglycerides. Circ Res. 1986;59:416–426. doi: 10.1161/01.res.59.4.416. [DOI] [PubMed] [Google Scholar]
- 36.Dosdall DJ, Tabereaux PB, Kim JJ, Walcott GP, Rogers JM, Killingsworth CR, Huang J, Robertson PG, Smith WM, Ideker RE. Chemical Ablation of the Purkinje System Causes Early Termination and Activation Rate Slowing of Long Duration Ventricular Fibrillation in Dogs. Am J Physiol Heart Circ Physiol. 2008;295:H883–H889. doi: 10.1152/ajpheart.00466.2008. [DOI] [PMC free article] [PubMed] [Google Scholar]
- 37.Hoffman B, Cranefield PF. Electrophysiology of the Heart. McGraw-Hill Book Company Inc; New York: 1960. Ch. 4 The Ventricle: Conduction Velocity; p. 79. [Google Scholar]


