Abstract
Dunaliella salina is a halotolerant green alga that is well known for its carotenoid producing capacity. The produced carotenoids are mainly stored in lipid globules. For various research purposes, such as production and extraction kinetics, we would like to determine and/or localise the carotenoid globules in vivo. In this study, we show that the carotenoid-rich globules emit clear green fluorescence, which can be used in, for example, fluorescence microscopy (e.g. CLSM) to obtain pictures of the cells and their carotenoid content.
Keywords: β-carotene, Carotenoids, Dunaliella salina, Fluorescence microscopy, Globules
Introduction
Dunaliella salina Teodoresco is a green alga capable of producing high concentrations of carotenoids, i.e. more than 8% of dry weight (Ben-Amotz et al. 1982), when stressed. These carotenoids are stored in lipid globules. Good HPLC-based methods already exist for the separation, detection and quantification of a wide variety of carotenoids (Fraser et al. 2000). However, these methods do not give information about the intracellular localisation of the carotenoids.
To gain more insight into, for example, the milking process to extract carotenoids (Hejazi and Wijffels 2004), it would be advantageous to have an imaging technique at our disposal that can visualise these carotenoid-containing globules. Electron micrographs of Dunaliella cells show small globules in the chloroplast, labelled as carotenoid-containing lipid droplets (Ben-Amotz et al. 1982; Hejazi et al. 2004; Hejazi and Wijffels 2004; Borowitzka and Siva 2007). However, a disadvantage of electron microscopy is that it cannot be used on living cells.
Fluorescence microscopy is a noninvasive imaging technique and can be used to study cellular processes in vivo. The detection of endogenous fluorescence from cell components or exogenous fluorescence from added dyes can be used to show and localise cellular components in vivo. An example of an endogenous fluorophore is chlorophyll which is widely known for its autofluorescence (Papageorgiou and Govindjee 2004). Also, fluorescence of carotenoids in solution has been demonstrated (Gillbro and Cogdell 1989; Bondarev 1997). However, intracellular carotenoids as part of the photosystem are known to mainly quench fluorescence emitted by other cell components (Lichtenthaler 1987; Chappelle et al. 1991).
In this paper, we show that the carotenoid-containing globules produced by D. salina emit green fluorescence that can be detected with confocal laser scanning microscopy (CLSM). Absorbance and fluorescence measurements show that the fluorescence most likely originates from the β-carotene in these globules.
Materials and methods
Dunaliella salina CCAP 19/18 was obtained from CCAP (Culture Collection of Algae and Protozoa, Oban, UK). Cells were grown and stressed in a flat-panel photobioreactor with a working volume of 2,500 mL and a light path of 3 cm. The medium used was as described by Kleinegris et al. (2010). The cell suspension was mixed by gassing (0.6 N2 L.min−1), and pH was controlled at pH 7.5 by adding CO2 pulses. The temperature was kept at 30°C by circulating temperature-controlled water through the reactor water jacket. For the growth period, the reactor was illuminated from one side with an average irradiance of 206 μmol photons·m−2 s−1 (high-pressure sodium lamp). For the stress period, the irradiance was raised to 1,672 μmol photons·m−2 s−1 by moving the lamp closer to the reactor. Small amounts (1–5 mL) of green cells harvested during the growth period and orange cells harvested during the stress period were used for microscopy purposes. At the end of the cultivation, all remaining biomass was used for isolation of β-carotene globules.
Isolation of β-carotene globules
Isolation of β-carotene globules was performed as described by Ben-Amotz et al. (1982) with minor adaptations. From a stressed culture, 8 × 40 mL cell suspension was centrifuged at 1,000×g for 15 min. Each pellet was resuspended in 40 mL of 30 mM NaCl and centrifuged at 12,000×g for 10 min. To break the cells, each pellet was resuspended in 4 mL demineralised water and again centrifuged at 12,000×g for 10 min. The supernatant was mixed with a solution of 2 mL of 50% sucrose in 10 mM Tris–HCl (pH 8.0). On top of this mixture, 0.5 mL 10 mM Tris–HCl (pH 8.0) was layered. This mixture was centrifuged for 2 h at 48,000×g to separate the globules from the chloroplast membranes. The globules were collected from the top layer and pooled. All steps were performed at approximately 4°C. The pooled samples were stored on ice in a refrigerator at 4°C.
Absorbance and fluorescence determination
The absorbance and autofluorescence of the globules were measured using a spectrophotometer (Avaspec-2048-USB, Avantes, The Netherlands) and a spectrofluorimeter (Jobin Yvon Fluorolog FL3-22, Horiba), respectively. As reference sample, 10 mM Tris–HCl (pH 8.0) was used. The excitation wavelengths for the emission spectra of the autofluorescence were 450, 488 and 510 nm. For emission, the bandwidth was 0.6 nm and the step size was 0.2 nm.
Microscopy
Bright field microscopy pictures from cells and globule suspensions were made with a Microphot fluorescence microscope (Nikon) or a CK 40 bright field microscope (Olympus) equipped with an Olympus AX 70 camera. Fluorescence microscopy pictures of cells and globule suspensions were made with a CLSM (Zeiss LSM 510-META 18). The CLSM was connected to an inverted microscope (Axiovert 200 M) with differential interference contrast (DIC). For excitation, the argon diode laser (30 mW, 488 nm) was used. For the detection of emitted fluorescence, we applied the BP505-530/LP650 filtre combination. A Zeiss 639 α-Plan Fluar oil objective (NA 1.45) was used for all imaging experiments. The obtained CLSM pictures were a combination picture of images from three channels, namely a DIC microscopy image from the cell, an image from the green fluorescence between 505 and 530 nm and an image from the red fluorescence of 650 nm and higher.
Results
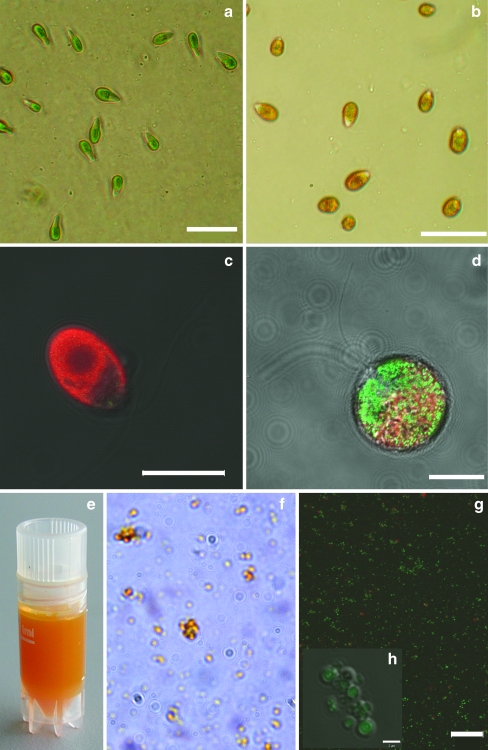
When Dunaliella salina cells are stressed, they start to produce carotenoids. The green cell which is dominated by the chloroplast starts to turn orange. The chloroplast shrinks, chloroplast membranes decrease in size and carotenoid-containing lipid globules are formed. Light microscopy clearly showed this difference between non-stressed and stressed cells (Fig. 1a, b). Fluorescence microscopy also showed that a distinct difference in fluorescence pattern arose after stress (Fig. 1c, d). The red fluorescence emitted by chlorophyll decreased and green fluorescence appeared.
Fig. 1.
a, b Bright field microscopy picture of non-stressed (a) and stressed (b) D. salina cells. Scale bars=20 μm. c, d Fluorescence microscopy pictures (CLSM) of non-stressed (c) and stressed (d) D. salina cells. Scale bars=10 μm. The CLSM pictures are combination images of three channels: DIC microscopy, green fluorescence (505–530 nm) and red fluorescence (>650 nm). e–h Isolated carotenoid-containing globules. e Isolated globules in Tris–HCl buffer (pH 8.0). f Bright field picture of the carotenoid-containing globules. g, h CLSM pictures of the carotenoid-containing globules. Scale bars=10 μm (g) and 2 μm (h). Green fluorescence comes from the globules, red fluorescence from chlorophyll remains
To prove that this green fluorescence was emitted by the carotenoid-containing globules, we isolated the globules (Fig. 1a–h). Light microscopy showed clear orange globules, and with the CLSM, the green fluorescence again was detected. This fluorescence was emitted by the globules and not by the solution as can be seen in Fig. 1h. Some red fluorescence indicated chlorophyll contamination.
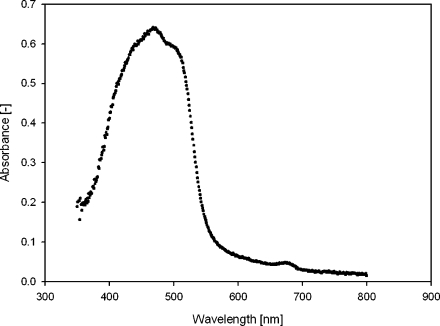
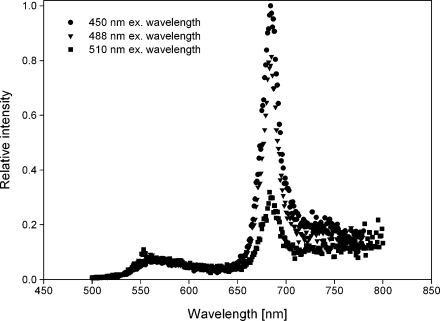
The absorbance and emitted fluorescence from the globule suspension were measured with a spectrophotometer and spectrofluorimeter, respectively, and are shown in Figs. 2 and 3.
Fig. 2.
Absorbance spectrum of carotenoid-containing globules. Peak from 400 to 550 nm was carotenoid absorbance. The peak at 670 nm was absorbance from chlorophyll
Fig. 3.
Emission spectra of carotenoid-containing globules for three different excitation wavelengths (450, 488 and 510 nm)
In the absorbance curve, the carotenoid peak is clearly visible (350–550 nm). Next to this peak, a very small peak at 670 nm was visible, originating from some chlorophyll contamination still left in the solution. In the fluorescence emission graph (Fig. 3), this chlorophyll contamination showed a very high emission peak at 670 nm. At 560 nm, a second, much smaller peak was visible, which must have originated from another component of the suspension, most likely the carotenoid-containing globules. With different excitation wavelengths, this emission peak did not shift its position with respect to the wavelength.
To determine whether the fluorescence peak at 560 nm was emitted by the β-carotene in the carotenoid-rich globules, we compared the relative values for the quantum yields of the chlorophyll peak and the 560-nm peak to see whether these compare to values found in literature for chlorophyll and carotenoid fluorescence.
Discussion
Dunaliella salina stores secondary carotenoids (predominantly β-carotene) in lipid globules in the chloroplast when cultivated under stress conditions. Non-stressed cells are dominated by the chloroplast, emitting red fluorescence originating from the chlorophyll in the thylakoid membranes. When the cells are stressed, the red fluorescence from chlorophyll partly disappears as the thylakoid membranes are broken down. At the same time, the cells start to produce carotenoid globules and green fluorescence appears simultaneously. Dunaliella salina cells show this distinct difference in red and green fluorescence pattern between non-stressed and stressed cells. We determined the relation between the carotenoid-containing globules and the green fluorescence and studied the possibility to visualise and localise these lipid globules inside the cells in vivo using this autofluorescence.
First, we isolated the carotenoid-containing globules. The purified globules, as determined by Ben-Amotz et al. (1982), are composed almost entirely of lipids. Over 90% of the lipids are neutral lipids, with β-carotene as the dominant fraction (65% of dry weight).
The carotenoid peak in the absorbance curve (350–550 nm) showed great similarity to the absorption spectrum of an 80% acetone extract of the purified β-carotene globules from D. bardawil, found by Ben-Amotz et al. (1982), and resembles the absorbance peak of pure β-carotene in solution (Kandori et al. 1994). The peak originated mainly from β-carotene, but other carotenoids might have contributed as well, just as some chlorophyll contamination. This originated probably from some chloroplast membrane remainders that were connected to the lipid globules. Chlorophyll has absorbance peaks between 400–500 and >600 nm (Lichtenthaler 1987). The small peak visible at 670 nm in the absorbance graph therefore must originate from chlorophyll still left in the solution.
The fact that with different excitation wavelengths the emission peak did not shift its position with respect to the wavelength proves that the peak is indeed fluorescence and cannot be ascribed as a Raman peak (Shanker and Bane 2008). The high relative intensity of the emitted fluorescence from the relatively small chlorophyll contamination coheres with its high quantum yield.
The ratio between the absorbance peaks and the emission peaks can be used to determine the ratios in quantum yields (Shanker and Bane 2008). The quantum yields for chlorophyll vary from 0.02 to 0.33 depending on whether measured in various solutions or in the cell (Forster and Livingston 1952; Latimer et al. 1956). According to Kandori et al. (1994), the quantum yield for β-carotene is 1.7 × 10⁻⁴. This results in a ratio between the quantum yields of β-carotene and chlorophyll varying from approximately 100 to 2000. The ratio in fluorescence between both peaks lies between 0.07 and 0.11 when we divide the maximum height of both peaks (e.g. 3.0 × 10⁴: 2.7 × 10⁵ for 488-nm excitation wavelength). The ratio between the absorbance peaks is around 14 when we divide the maximum height of both peaks (0.64:0.05). Consequently, the ratio between the relative values for the quantum yields for both peaks in this research is somewhere between 100 and 200. Comparing these to literature shows that the emission peak at 560 nm most likely originates from the β-carotene in the lipid globules.
In conclusion, D. salina stores secondary carotenoids in lipid globules when cultivated under stress conditions. To visualise these carotenoid-containing globules, CSLM can be used in combination with the autofluorescence of cell components. This autofluorescence of the cells is emitted by chlorophyll in the red part of the spectrum and by the carotenoid globules in the green part of the spectrum. When comparing the relative quantum yields obtained from the absorbance and fluorescence emission spectra with data from literature, we can conclude that the green fluorescence most likely is emitted by the β-carotene that comprises the main part of the carotenoid-rich globules.
Acknowledgements
The authors would like to thank André van Lammeren and Norbert de Ruijter for all help regarding confocal laser scanning microscopy. Furthermore, the authors would like to thank Herbert van Amerongen for his help with interpreting data and for useful discussions. This research was financially supported by the technology foundation STW (www.stw.nl; project WLM.6622), which is part of The Netherlands Organisation for Scientific Research (www.nwo.nl).
Open Access
This article is distributed under the terms of the Creative Commons Attribution Noncommercial License which permits any noncommercial use, distribution, and reproduction in any medium, provided the original author(s) and source are credited.
References
- Ben-Amotz A, Katz A, Avron M. Accumulation of β-carotene in halotolerant algae: purification and characterization of β-carotene-rich globules from Dunaliella bardawil (Chlorophyceae) J Phycol. 1982;18:529–537. doi: 10.1111/j.1529-8817.1982.tb03219.x. [DOI] [Google Scholar]
- Bondarev SL. Photophysics of β-carotene and related compounds (review) J Appl Spectrosc. 1997;64:1–15. doi: 10.1007/BF02683481. [DOI] [Google Scholar]
- Borowitzka MA, Siva CJ. The taxonomy of the genus Dunaliella (Chlorophyta, Dunaliellales) with emphasis on the marine and halophilic species. J Appl Phycol. 2007;19:567–590. doi: 10.1007/s10811-007-9171-x. [DOI] [Google Scholar]
- Chappelle EW, McMurtrey JE, III, Kim MS. Identification of the pigment responsible for the blue fluorescence band in the laser induced fluorescence (LIF) spectra of green plants, and the potential use of this band in remotely estimating rates of photosynthesis. Remote Sens Environ. 1991;36:213–218. doi: 10.1016/0034-4257(91)90058-E. [DOI] [Google Scholar]
- Forster LS, Livingston R. The absolute quantum yields of the fluorescence of chlorophyll solutions. J Chem Phys. 1952;20:1315–1320. doi: 10.1063/1.1700727. [DOI] [Google Scholar]
- Fraser PD, Pinto MES, Holloway DE, Bramley PM. Application of high-performance liquid chromatography with photo-diode array detection to the metabolic profiling of plant isoprenoids. Plant J. 2000;24:551–558. doi: 10.1046/j.1365-313x.2000.00896.x. [DOI] [PubMed] [Google Scholar]
- Gillbro T, Cogdell RJ. Carotenoid fluorescence. Chem Phys Lett. 1989;158:312–316. doi: 10.1016/0009-2614(89)87342-7. [DOI] [Google Scholar]
- Hejazi MA, Wijffels RH. Milking of microalgae. Trends Biotechnol. 2004;22:189–194. doi: 10.1016/j.tibtech.2004.02.009. [DOI] [PubMed] [Google Scholar]
- Hejazi MA, Kleinegris D, Wijffels RH. Mechanism of extraction of β-carotene from microalgae Dunaliella salina in two-phase bioreactors. Biotechnol Bioeng. 2004;88:593–600. doi: 10.1002/bit.20238. [DOI] [PubMed] [Google Scholar]
- Kandori H, Sasabe H, Mimuro M. Direct determination of a lifetime of the S2 state of β-carotene by femtosecond time-resolved fluorescence spectroscopy. J Am Chem Soc. 1994;116:2671–2672. doi: 10.1021/ja00085a078. [DOI] [Google Scholar]
- Kleinegris DMM, Janssen M, Brandenburg WA, Wijffels RH (2010) The selectivity of milking of Dunaliella salina. Mar Biotech 12:14–23 [DOI] [PMC free article] [PubMed]
- Latimer P, Bannister TT, Rabinowitch E. Quantum yields of fluorescence of plant pigments. Science. 1956;124:585–586. doi: 10.1126/science.124.3222.585. [DOI] [PubMed] [Google Scholar]
- Lichtenthaler HK. Chlorophylls and carotenoids: pigments of photosynthetic biomembranes. Method Enzymol. 1987;148:350–382. doi: 10.1016/0076-6879(87)48036-1. [DOI] [Google Scholar]
- Papageorgiou GC, Govindjee . Chlorophyll a fluorescence: a signature of photosynthesis. Dordrecht: Springer; 2004. pp. 1–818. [Google Scholar]
- Shanker N, Bane SL. Basic aspects of absorption and fluorescence spectroscopy and resonance energy transfer methods. Methods Cell Biol. 2008;84:213–242. doi: 10.1016/S0091-679X(07)84008-8. [DOI] [PubMed] [Google Scholar]


