HMGB1 displaces Bcl-2 from Beclin1 to induce and sustain autophagy in response to cell stress.
Abstract
Autophagy clears long-lived proteins and dysfunctional organelles and generates substrates for adenosine triphosphate production during periods of starvation and other types of cellular stress. Here we show that high mobility group box 1 (HMGB1), a chromatin-associated nuclear protein and extracellular damage-associated molecular pattern molecule, is a critical regulator of autophagy. Stimuli that enhance reactive oxygen species promote cytosolic translocation of HMGB1 and thereby enhance autophagic flux. HMGB1 directly interacts with the autophagy protein Beclin1 displacing Bcl-2. Mutation of cysteine 106 (C106), but not the vicinal C23 and C45, of HMGB1 promotes cytosolic localization and sustained autophagy. Pharmacological inhibition of HMGB1 cytoplasmic translocation by agents such as ethyl pyruvate limits starvation-induced autophagy. Moreover, the intramolecular disulfide bridge (C23/45) of HMGB1 is required for binding to Beclin1 and sustaining autophagy. Thus, endogenous HMGB1 is a critical pro-autophagic protein that enhances cell survival and limits programmed apoptotic cell death.
Introduction
During macroautophagy (subsequently referred to simply as autophagy), subcellular membranes undergo dynamic morphological changes that lead to the engulfment and degradation of cellular proteins and cytoplasmic organelles (Maiuri et al., 2007; Levine and Kroemer, 2008). Disruption of autophagic pathways is associated with multiple disease states, including neurodegenerative diseases, cancer, infection, and several types of myopathy (Levine and Kroemer, 2008; Livesey et al., 2009). Autophagy is also a major mechanism by which starving cells reallocate nutrients from unnecessary to more essential processes (Levine and Kroemer, 2008). During autophagy, a cytosolic form of light chain 3 (LC3; LC3-I) is cleaved and then conjugated to phosphatidylethanolamine to form the LC3-phosphatidylethanolamine conjugate (LC3-II), which is recruited to autophagosomal membranes. Detecting microtubule-associated protein LC3 by immunoblotting or immunofluorescence has become a widely used method for monitoring autophagy and autophagy-related processes (Mizushima and Yoshimori, 2007).
High mobility group box 1 (HMGB1) protein is a highly conserved nuclear protein, which acts as an architectural chromatin-binding factor that bends DNA and promotes protein assembly at specific DNA targets (Lotze and Tracey, 2005). In addition to its intranuclear role, HMGB1 also functions as an extracellular signaling molecule during inflammation, cell differentiation, cell migration, and tumor metastasis (Lotze and Tracey, 2005; Tang et al., 2010a). HMGB1 is released from necrotic cells and secreted by activated macrophages, natural killer cells, and mature dendritic cells, where it mediates the response to infection, injury, and inflammation (Wang et al., 1999). In contrast, after DNA damage induced by UV light irradiation or platination, HMGB1 is sequestered in the nucleus, which is classically associated with apoptotic, but not necrotic, cell death (Scaffidi et al., 2002).
Although substantial information exists about HMGB1 in the setting of apoptosis and necrosis, the role of HMGB1 in autophagy is essentially uncharacterized. Here we demonstrate that HMGB1 is a critical regulator of autophagy, as HMGB1 translocation induces autophagy after prolonged cellular stress. Interestingly, HMGB1 translocation requires a redox-dependent signal. Moreover, targeted ablation of HMGB1 increases apoptosis and inhibits autophagy by sustaining the interaction between Beclin1 and Bcl-2. Mutation of cysteine 106 (C106), but not the vicinal C23 and C45, of HMGB1 promotes cytosolic localization and autophagy. Additionally, the intramolecular disulfide bridge (C23/45) of HMGB1 is required for binding to Beclin1 and induction of autophagy. These findings define a new biological function for HMGB1 in promoting cell survival by sustaining autophagy in response to cellular stress.
Results
Autophagic stimuli promote translocation of HMGB1 to the cytosol
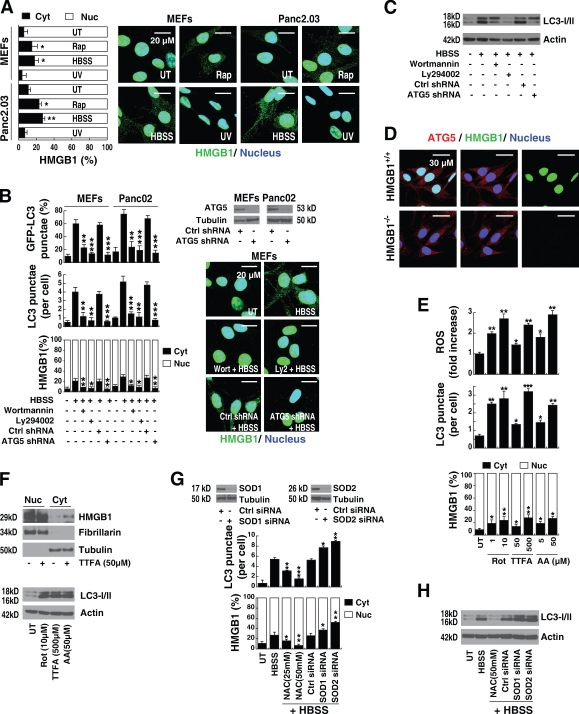
To investigate the role of HMGB1 when cells are exposed to stimuli that promote autophagy, we first analyzed its expression and location. Classical autophagic stimuli, such as starvation (HBSS) or rapamycin treatment, promoted HMGB1 translocation from the nucleus to the cytosol in cultured mouse embryonic fibroblasts (MEFs), human Panc2.03 (Fig. 1 A), and other cell lines, such as mouse Panc02, human HCT116, and mouse RAW264.7 (not depicted). Treatment with rapamycin or starvation induced HMGB1 translocation unaccompanied by measurable lactate dehydrogenase release (Fig. S1), a marker of plasma membrane disruption. This suggests that the HMGB1 translocation, observed during early events with heightened autophagy, is an active process. Furthermore, pretreatment of the MEF and Panc02 cell lines with the nominal broad phosphatidylinositol-3 kinase inhibitors, such as wortmannin and Ly294002, blocked starvation-induced accumulation of LC3 punctae, LC3-II, and HMGB1 translocation (Fig. 1, B and C). Moreover, knockdown of ATG5, a gene product required for the formation of autophagosomes (Levine and Kroemer, 2008), significantly inhibited the number of starvation-induced LC3 punctae, LC3-II expression, and HMGB1 translocation (Fig. 1, B and C). This suggests that autophagic stimuli regulate HMGB1 cytoplasmic translocation. In contrast, there were no significant differences observed in ATG5 staining when comparing Hmgb1−/− and Hmgb1+/+ immortalized MEFs (Fig. 1 D), consistent with the notion that ATG5 is not downstream of HMGB1.
Figure 1.
Autophagy promotes extranuclear HMGB1 translocation and is dependent on ROS generation. (A) HMGB1 translocates from the nucleus to the cytosol during autophagy, but not apoptosis. Mouse embryonic fibroblasts (MEFs) and the human Panc2.03 tumor cell line were treated with 1 µM rapamycin (Rap) for 12 h, starvation (HBSS) for 3 h, or UV irradiation at 50 mJ/cm2 for 5 min before a 12-h recovery and then were immunostained with HMGB1-specific antibody (green) and Hoechst 33342 (blue). The mean nuclear (Nuc) and cytosolic (Cyt) HMGB1 intensity per cell was determined by imaging cytometric analysis as described in Materials and methods. *, P < 0.05 and **, P < 0.005 versus untreated (UT) group; n = 3. Representative images are depicted (right). (B) Inhibition of autophagy blocks HMGB1 translocation. Cells were pretreated as indicated with 100 nM wortmannin or 10 µM Ly294002 for 1 h or ATG5-specific shRNA for 48 h and were stimulated with starvation (HBSS) for 3 h and immunostained with HMGB1- or LC3-specific antibody and Hoechst 33342. The mean nuclear/cytosolic HMGB1 intensity and LC3 punctae per cell were determined by imaging cytometric analysis. A representative Western blot of ATG5 level after shRNA and HMGB1 staining is depicted (right). In parallel, the indicated cells were transfected with GFP-LC3 plasmid and assayed for autophagy by quantifying the percentage of cells with GFP-LC3 punctae. *, P < 0.05, **, P < 0.005, and ***, P < 0.0005 versus HBSS group; n = 3. Ctrl, control. (C) Knockdown of ATG5 inhibits LC3-II expression. Western blot analysis of LC3-I/II expression in Panc02 cells under the conditions described in B. Actin was used as a loading control. (D) Hmgb1−/− does not influence ATG5 staining. Hmgb1−/− and Hmgb1+/+ MEFs were immunostained with HMGB1-specific antibody (green), ATG-5–specific antibody (red), and Hoechst 33342 (dark blue). Representative images are depicted in the right panels. (E) mETC inhibitors promote ROS production, autophagy, and HMGB1 translocation. Panc2.03 cells were stimulated with rotenone (Rot), thenoyltrifluoroacetone (TTFA), and antimycin A (AA) at indicated doses for 12 h, and ROS production was assessed by measuring the fluorescent intensity of CM-H2DCFDA in a fluorescent plate reader. In parallel experiments, cells were then immunostained with HMGB1- or LC3-specific antibody and Hoechst 33342. The mean nuclear/cytosolic HMGB1 intensity and LC3 punctae per cell were determined by imaging cytometric analysis. *, P < 0.05, **, P < 0.005, and ***, P < 0.0005 versus untreated group; n = 3. (F) mETC inhibitors increase LC3-II expression and promote HMGB1 translocation. Western blot analysis of LC3-I/II and nuclear/cytosolic HMGB1 expression as indicated in E. Fibrillarin is a nuclear fraction control, and tubulin is a cytoplasmic fraction control. (G) Antioxidant and SOD RNAi limit starvation-induced autophagy and HMGB1 translocation. Panc2.03 cells were pretreated with the antioxidant (NAC) at the indicated concentrations for 1 h or with SOD1 or SOD2 siRNA for 48 h. Then cells were starved (HBSS) for 3 h and analyzed by imaging cytometry to determine the mean nuclear/cytosolic HMGB1 intensity and LC3 punctae per cell. *, P < 0.05; **, P < 0.005; and ***, P < 0.0005 versus HBSS group; n = 3. A representative Western blot for SOD1 and SOD2 level after siRNA is depicted here. (H) Antioxidant and SOD RNAi limit starvation-induced autophagy as measured by LC3-II expression. Western blot analysis of LC3-I/II expression under the conditions indicated in G. Actin was used as a loading control. Data are means ± SEM.
Reactive oxygen species (ROS)–dependent signals are required for HMGB1 translocation and enhanced autophagy
ROS are signaling molecules important in several pathways that regulate both cell survival and cell death. Indeed, many stimuli that induce ROS generation, such as nutrient starvation, mitochondrial toxins, and hypoxia, also induce autophagy (Fig. S2). ROS formation in the mitochondria is a fundamental regulatory event that promotes autophagy (Scherz-Shouval and Elazar, 2007). The major source of endogenous ROS is the mitochondrial electron transport chain (mETC; Scherz-Shouval and Elazar, 2007).
To evaluate the relationship between mitochondrial ROS production and HMGB1 translocation during autophagy, we treated cells with several different mETC inhibitors. Treatment with rotenone (Rot; complex I inhibitor), thenoyltrifluoroacetone (complex II inhibitor), and antimycin A (complex III inhibitor) increased ROS production, LC3 punctae, and LC3-II expression (Fig. 1, E and F). These mETC inhibitors also induced HMGB1 translocation from the nucleus to the cytosol, as assessed by imaging cytometry and Western blot of subcellular fractions (Fig. 1, E and F). Under physiological conditions, ROS are cleared from cells by the action of the superoxide dismutase (SOD) family members, catalase, or glutathione peroxidase (Scherz-Shouval and Elazar, 2007). As expected, knockdown of SOD1 and SOD2 increased starvation- and rapamycin-induced autophagy and HMGB1 translocation in Panc2.03 cells (Fig. 1, G and H; and Fig. S3). Furthermore, N-acetyl cysteine (NAC), an ROS quencher, dose-dependently inhibited starvation- and rapamycin-induced autophagy and HMGB1 translocation (Fig. 1, G and H; and Fig. S3). Moreover, starvation and rapamycin increased ROS/mitochondrial superoxide levels and decreased SOD activity but did not affect catalase activity or detected levels (Fig. S2). Together, these results are consistent with the notion that ROS signals are required for HMGB1 translocation and sustained autophagy.
Lack of HMGB1 limits autophagy
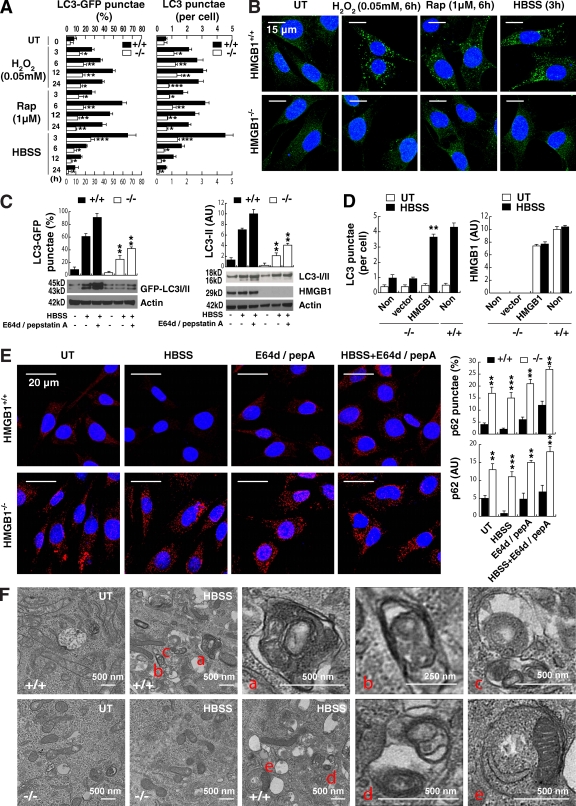
To assess the role of HMGB1 in autophagy, we first evaluated autophagic flux in wild-type and Hmgb1−/− MEFs. Hmgb1−/− MEFs had markedly diminished LC3-GFP punctae, endogenous LC3 punctae formation, and LC3-II expression in cells after treatment with several autophagic stimuli, including H2O2, rapamycin, and starvation (Fig. 2, A–C). Treatment with the lysosomal protease inhibitors pepstatin or E64D (Mizushima and Yoshimori, 2007) induced a further increase in LC3-GFP punctae and LC3-II expression in wild-type, but not Hmgb1−/−, MEFs (Fig. 2 C). Similarly, knockdown of HMGB1 in HCT116 and Panc2.03 cells also decreased accumulation of LC3 punctae and expression of LC3-II (Fig. S4). Moreover, up-regulation of HMGB1 expression in Hmgb1−/− MEFs after gene transfection restored LC3 punctae formation (Fig. 2 D). Inhibition of autophagy leads to an increase in the size and number of p62 bodies and p62 protein levels (Bjørkøy et al., 2005). Loss of HMGB1 increases the size and number of p62 bodies and p62 protein levels (Fig. 2 E), indicating that its degradation is dependent on HMGB1-mediated autophagy. Ultrastructural analysis revealed that Hmgb1−/− MEFs exhibited fewer type I autophagosomes and type II autophagolysosomes when compared with wild-type MEFs (Fig. 2 F). These results indicate that HMGB1 is indeed an important factor that regulates autophagy.
Figure 2.
Depletion of HMGB1 inhibits autophagy. (A) HMGB1 knockout inhibits LC3 punctae formation. HMGB1−/− and HMGB1+/+ MEFs were treated with autophagic stimuli as indicated, and LC3 punctae formation was detected by LC3 antibody or GFP-LC3 as described in Materials and methods. *, P < 0.05; **, P < 0.005; and ***, P < 0.0005 versus Hmgb1+/+ group; n = 3. UT, untreated. (B) Representative images of LC3 punctae in Hmgb1−/− and HMGB1+/+ MEFs with the indicated treatments are depicted. The percentage of cells showing accumulation of LC3 punctae was reported in A. (C) Analysis of LC3 processing by autophagy in the presence or absence of lysosomal protease inhibitors pepstatin A (pepA) at 10 µg/ml and E64D at 10 µg/ml after starvation treatment for 3 h. **, P < 0.05 versus Hmgb1+/+ group; n = 3. Actin was used as a loading control. AU, arbitrary units. (D) Up-regulation of HMGB1 protein expression restores starvation-induced autophagy. Hmgb1−/− MEFs were transfected with HMGB1 plasmid or empty vector and then were treated with starvation for 3 h. LC3 punctae formation was assayed by imaging cytometric analysis. **, P < 0.05 versus vector group; n = 3. Non, nontransfected. (E) Analysis of p62 processing by autophagy in the presence or absence of lysosomal protease inhibitors pepstatin A at 10 µg/ml and E64D at 10 µg/ml after starvation treatment for 3 h. **, P < 0.005 and ***, P < 0.0005 versus Hmgb1+/+ group; n = 3. Representative images are depicted (left). (F) Ultrastructural features in Hmgb1−/− and Hmgb1+/+ MEFs with or without starvation (HBSS for 3 h) treatment (a–e point to autophagosomes and autolysosomes). Data are means ± SEM.
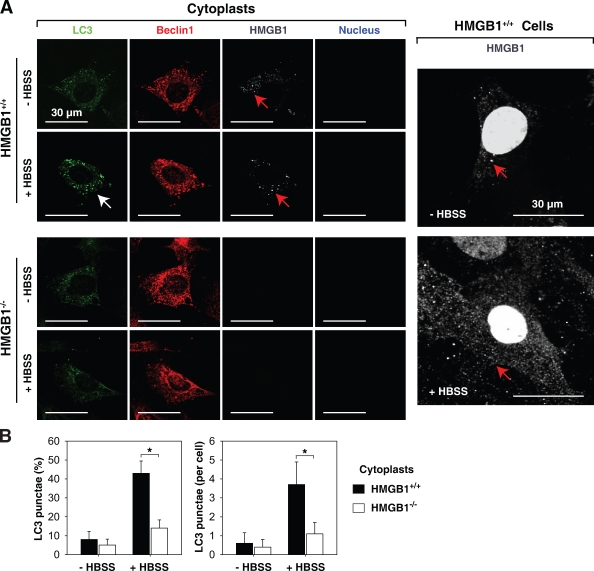
Under normal conditions, 5–10% of HMGB1 protein is located in the cytosol, with the specific quantity dependent on the cell type (Fig. 1 A and Fig. 3 A). Moreover, autophagic stimuli promote translocation of HMGB1 to the cytosol (Fig. 1 A and Fig. 3 A). To assess the role of cytoplasmic HMGB1 in the setting of autophagy, we created cytoplasts (anucleate cells). In response to starvation (HBSS), Hmgb1+/+ MEF cytoplasts were still able to accumulate LC3 punctae (Fig. 3, A and B; Tasdemir et al., 2008). In contrast, Hmgb1−/− MEF cytoplasts demonstrated a lower level of LC3 punctae than HMGB1+/+ (Fig. 3, A and B), indicating that cytoplasmic HMGB1 was required for starvation-stimulated autophagy.
Figure 3.
Inhibition of autophagy by cytoplasmic HMGB1. Hmgb1−/− and Hmgb1+/+ MEFs were enucleated by centrifugation after cytochalasin B treatment as described in Materials and methods and then were treated with HBSS for 3 h, and LC3 punctae formation was detected by a confocal microscope. (A) Representative images of LC3 punctae (white arrows) and HMGB1 (red arrows) in cytoplasts of Hmgb1−/− and Hmgb1+/+ MEFs are depicted. (B) The percentage of cells showing accumulation of LC3 punctae was reported (*, P < 0.05; n = 3). Data are means ± SEM.
Both starvation and rapamycin treatment enhance autophagy and induce apoptosis in some cell lines (Maiuri et al., 2007). We therefore evaluated the relationship between HMGB1 and apoptosis under these conditions. Increased apoptosis was observed in Hmgb1−/− MEFs when compared with wild-type cells by flow cytometry using an annexin V stain, by finding increased cleaved poly(ADP-ribose) polymerase (PARP), and by increased caspase-3 activation (Fig. S5). Collectively, these data suggest that HMGB1 plays a major role in promoting autophagy and limiting apoptosis.
Depletion of HMGB1 promotes persistent Beclin1–Bcl-2 interaction
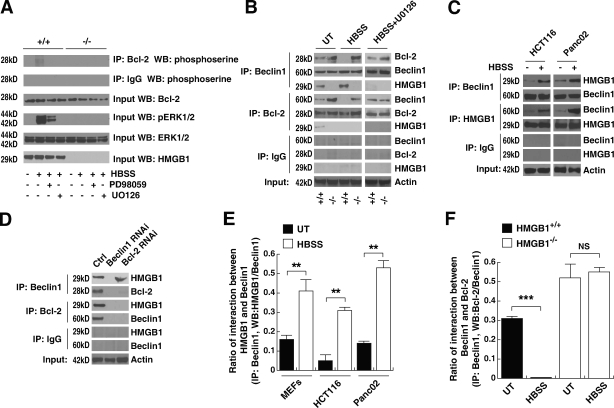
An important molecular event observed during autophagy is the disassociation of the Bcl-2–Beclin1 complex (Pattingre et al., 2005). The Bcl-2 family of antiapoptotic proteins regulates Beclin1-dependent autophagy (Pattingre et al., 2005). Thus, we determined the effect of HMGB1 on the interaction between Bcl-2 and Beclin1. The MAPK kinase (MEK)/extracellular signal-regulated kinase (ERK) inhibitors PD98059 and U0126 inhibited starvation-induced phosphorylation of ERK (p-ERK1/2) and Bcl-2 (Fig. 4 A). Moreover, knockout of HMGB1, as well as addition of the MEK/ERK inhibitor U0126, blocked the dissociation of Bcl-2–Beclin1 in the setting of enhanced autophagy (Fig. 4, B and F), suggesting that ERK1/2-mediated phosphorylation of Bcl-2 regulates starvation-induced autophagy. When present, endogenous HMGB1 demonstrated an interaction with Beclin1 by coimmunoprecipitation (IP [co-IP]) assay in MEFs, HCT116, and Panc02 cells (Fig. 4, B, C, and E). Knockdown of Beclin1 inhibited the interaction between Bcl-2 and HMGB1 in untreated HMGB1 wild-type MEFs (Fig. 4, B and D), suggesting that HMGB1 interaction with Bcl-2 is directly dependent on Beclin1. Thus, via binding to Beclin1 and regulating the phosphorylation of Bcl-2 in cells after starvation, endogenous HMGB1 inhibits the interaction between Beclin1 and Bcl-2.
Figure 4.
Absence of HMGB1 sustains Beclin1–Bcl-2 interactions. (A) MEK inhibitors block starvation-induced p-ERK and Bcl-2. HMGB1−/− and HMGB1+/+ MEFs were starved in the presence or absence of 10 µM U0126 and 20 µM PD98059 for 6 h. Protein expression levels were assessed as indicated by co-IP or Western blotting. (B) Knockout of HMGB1 limits the disassociation of the Bcl-2–Beclin1 complex during treatment with autophagic stimuli. HMGB1−/− and HMGB1+/+ MEFs were starved in the presence or absence of 10 µM U0126 for 3 h. Protein expression levels were then assayed as indicated by co-IP or Western blotting. (C) HMGB1 interacts directly with Beclin1 during autophagy. HCT116 and Panc02 cells were treated with HBSS for 3 h and then assayed for protein expression levels as indicated by co-IP or Western blotting. (D) HMGB1 direct interactions with Bcl-2 are dependent on Beclin1. Knockdown of Beclin1 and Bcl-2 by siRNA in HMGB1 wild-type MEFs was performed, and protein expression levels were then assayed as indicated by co-IP or Western blotting. Ctrl, control. (E and F) Quantitative data demonstrating the interaction between HMGB1–Beclin1 and Beclin1–HMGB1 using densitometry software to assay the relative protein band intensity in co-IP experiments as shown in A–D. **, P < 0.005 and ***, P < 0.0005; n = 3. UT, untreated. Data are means ± SEM.
Oxidation of HMGB1 regulates autophagic flux
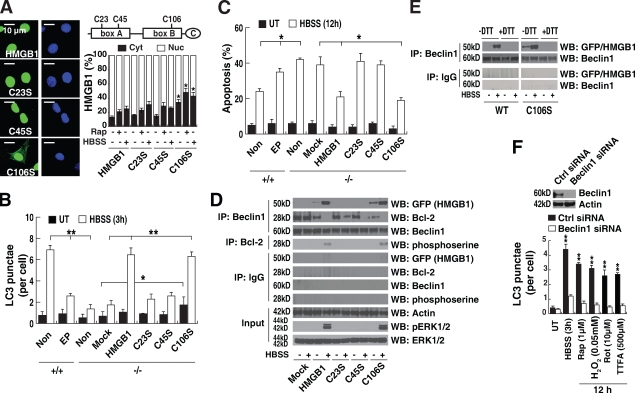
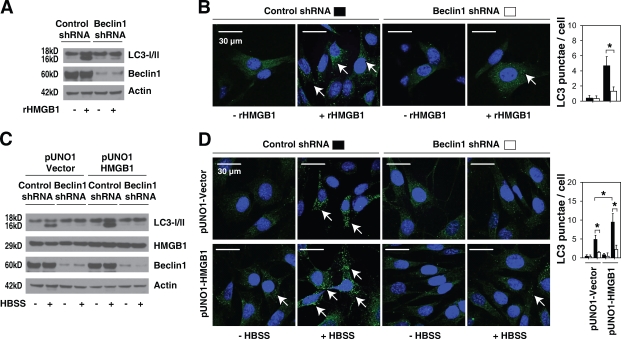
Oxidation of the three cysteines found within HMGB1 is important to its function (Hoppe et al., 2006; Kazama et al., 2008). These cysteines are encoded at positions 23, 45, and 106 (C23, C45, and C106, respectively; Fig. 5 A). Under mild oxidative conditions, the vicinal cysteines C23 and C45 readily form an intramolecular disulfide bridge, whereas C106 remains in a reduced form (Hoppe et al., 2006). Blocking sites of oxidation in HMGB1 prevents the induction of tolerance by apoptotic cells (Kazama et al., 2008). Transfection of the constitutively active redox sensor HMGB1-GFP-C106 mutation (C106S) into HMGB1 knockout cells impaired nuclear localization of HMGB1, which increases cytoplasmic aggregation of HMGB1 (Fig. 5 A; Hoppe et al., 2006) and LC3 punctae formation (Fig. 5 B). This suggests that the C106 of HMGB1 may play a role in regulating its intracellular translocation and, subsequently, autophagy. Moreover, autophagic stimuli (rapamycin or starvation) promoted translocation of wild type as well as mutant C23S, C45S, and C106S HMGB1 into the cytosol (Fig. 5 A). Inhibition of HMGB1 cytoplasmic translocation by ethyl pyruvate (Ulloa et al., 2002) blocked starvation-induced aggregation of LC3 punctae (Fig. 5 B), suggesting that cytoplasmic HMGB1 regulates autophagy. Consequently, transfection of wild-type HMGB1 and the C106S variant, but not the mutant C23S or C45S plasmids that are localized to the nucleus, up-regulated autophagy and down-regulated apoptosis in Hmgb1−/− cells after starvation (Fig. 5, B and C). The HMGB1 C106S mutation increased the dissociation of Bcl-2 and Beclin1 and promoted p-ERK1/2 and Bcl-2 in HMGB1−/− cells after starvation (Fig. 5 D). The C23S and C45S variants, but not those with the C106S mutation, impaired the interaction between HMGB1 and Beclin1 and the p-ERK1/2 and Bcl-2 (Fig. 5 D), suggesting that the intramolecular disulfide bridge (C23/45) is required for binding to Beclin1. To further confirm this hypothesis, we applied a reducing reagent (DTT) during the IP experiments. As expected, samples treated with DTT (Fig. 5 E, +DTT) before IP disrupted the interaction between wild-type/C106S HMGB1 and Beclin1. Furthermore, siRNA knockdown of Beclin1 inhibited autophagy under conditions that induce HMGB1 translocation from the nucleus to the cytosol, such as H2O2, rapamycin, Rot, thenoyltrifluoroacetone, and HBSS (Fig. 5 F). Moreover, knockdown of Beclin1 inhibited autophagy induced by treatment with exogenous HMGB1 and overexpression of HMGB1 with or without starvation, suggesting that Beclin1 was required for HMGB1-mediated autophagy (Fig. 6, A–D).
Figure 5.
Oxidation of HMGB1 regulates HMGB1 subcellular localization and autophagy. (A) The C106 mutation (C106S) of HMGB1 impairs its nuclear localization. Hmgb1−/− MEFs were transfected with wild-type and cysteine mutant HMGB1-GFP plasmids as indicated and then were treated with 1 µM rapamycin for 12 h or starved (HBSS) for 3 h. The mean nuclear (Nuc) and cytosolic (Cyt) HMGB1 intensity per cell was analyzed by imaging cytometric analysis. *, P < 0.05 versus HMGB1+/+ group; n = 3. Representative images of HMGB1 location are shown on the left (green, HMGB1; blue, nucleus). The right panel is a schematic diagram of HMGB1 structure illustrating the basic A box and B box as well as the acidic C-terminal domain, with the cysteine mutation locations identified. (B and C) Cytoplasmic HMGB1 enhances autophagy and limits apoptosis. HMGB1−/− MEFs were transfected with wild-type or cysteine mutant HMGB1-GFP plasmids as indicated and then were starved (HBSS) for the indicated time. In a parallel experiment, Hmgb1+/+ MEFs were pretreated with 5 mM ethyl pyruvate (EP) for 2 h and then starved as indicated. LC3 punctae formation was assayed by imaging cytometric analysis (B), and apoptosis was assayed by FACS (C) as described in Materials and methods. *, P < 0.05 and **, P < 0.005; n = 3. UT, untreated. Non, nontransfection. (D) C23/C45 is required for the binding of HMGB1 to Beclin1. Hmgb1−/− MEFs were transfected with wild-type or cysteine mutant HMGB1-GFP plasmids as indicated and stimulated with starvation (HBSS) for 3 h. These cells were then assayed for protein expression levels as indicated by IP or Western blotting. Blots are representative of three independent experiments with similar results. (E) Reducing reagents disrupt the interaction between wild-type/C106 HMGB1 and Beclin1. As a control, before IP, samples were incubated with 50 mM DTT (+DTT) and assayed for protein expression levels as indicated by IP or Western blotting. Blots are representative of two independent experiments with similar results. (F) Knockdown of Beclin1 by siRNA inhibits autophagy under conditions of HMGB1 translocation from the nucleus to the cytosol. Cells were stimulated with HBSS, rapamycin (Rap), rotenone (Rot), or thenoyltrifluoroacetone (TTFA) for 3 h or 12 h, and LC3 punctae formation was assayed as indicated. **, P < 0.005 versus Beclin1 shRNA group; n = 3. Ctrl, control. Data are means ± SEM.
Figure 6.
Beclin1 is required for HMGB1-mediated autophagy. (A and B) Knockdown of Beclin1 in MEFs by shRNA inhibits exogenous HMGB1-induced autophagy. Cells as indicated were stimulated with 1 µg/ml HMGB1 protein (rHMGB1) for 24 h, and LC3 expression was detected by Western blotting (A). LC3 punctae formation (arrows) was assayed by immunofluorescence (B; n = 3; *, P < 0.05). (C and D) Knockdown of Beclin1 in MEFs by shRNA inhibits HBSS-induced autophagy with and without pUNO1-HMGB1 transfection. Cells as indicated were stimulated with Earle’s balanced salt solution for 3 h, and LC3 expression was detected by Western blotting (C). LC3 punctae formation (arrows) was assayed by immunofluorescence (D; n = 3; *, P < 0.05). Data are means ± SEM.
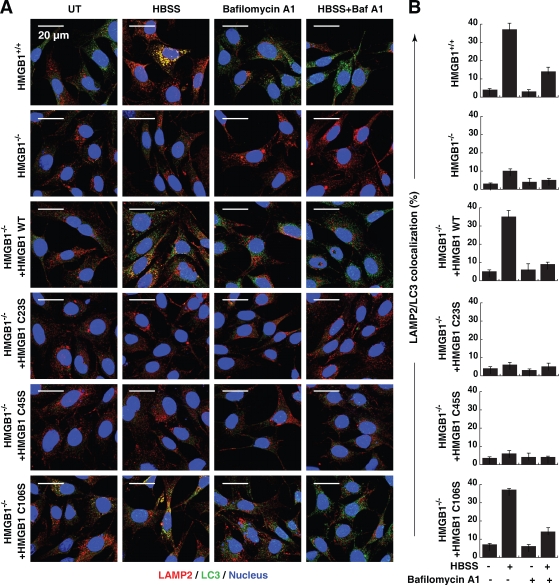
To further confirm that oxidation of HMGB1 regulates autophagic flux, we analyzed the colocalization of lysosomal-associated membrane protein 2 (LAMP2) and LC3 in the presence or absence of bafilomycin A1, an inhibitor of autophagic vacuole and lysosome fusion. Bafilomycin A1 decreased LAMP2/LC3 colocalization after starvation-mediated autophagy in wild-type MEFs (Fig. 7, A and B). Moreover, expression of HMGB1 or the C106S mutant, but not the C23S and C45S mutants, restored autophagic flux in Hmgb1−/− MEFs (Fig. 7, A and B).
Figure 7.
Expression of HMGB1 or the C106S mutant, but not C23S and C45S mutants, restore autophagic flux in Hmgb1−/− MEFs. (A) HMGB1−/− MEFs were transfected with wild-type (WT) or the cysteine mutant HMGB1-GFP plasmids as indicated, starved (HBSS) for 3 h in the presence or absence of 100 nM bafilomycin A1, and then immunostained with LAMP2-specific antibody/Alexa Fluor 594 secondary antibody (shown in red), LC3-specific antibody/Alexa Fluor 647 secondary antibody (shown in green), and Hoechst 33342 (shown in blue). Images were acquired digitally from a randomly selected pool of 10–15 fields under each condition. (B) Quantitative analysis of the percentage of LAMP2/LC3 colocalization was detected by Image-Pro Plus 5.1 software. Data are means ± SEM.
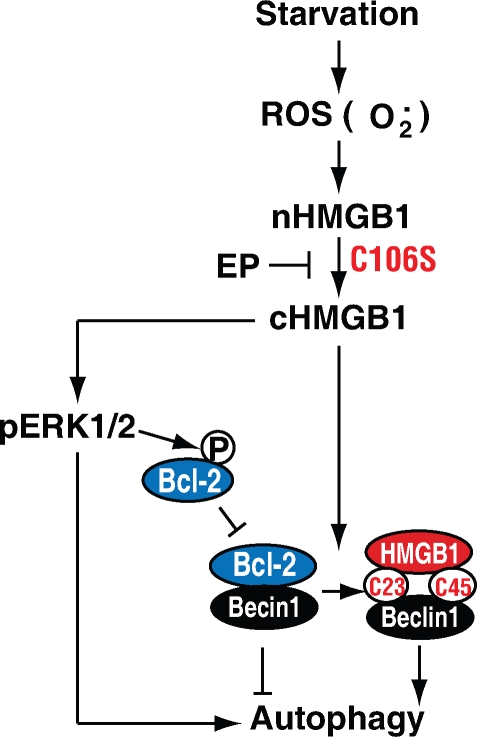
Together, these findings demonstrate that oxidation of HMGB1 promotes its localization to the cytosol and subsequent induction of autophagy (Fig. 8). Our findings also suggest that cytoplasmic translocation of HMGB1 is necessary, but may not be sufficient, to promote and sustain autophagy.
Figure 8.
Conceptual relationships between endogenous HMGB1 and autophagy. ROS trigger HMGB1 translocation to the cytosol in the setting of starvation-mediated autophagy. Cytosolic HMGB1 then binds Beclin1, which requires C23/45. This results in dissociation of Beclin1–Bcl-2 and subsequent induction of autophagy. C106 mutation (C106S) in HMGB1 impairs its nuclear localization and promotes autophagy. Inhibition of HMGB1 translocation by ethyl pyruvate (EP) blocks autophagy. Additionally, HMGB1 promotes phosphorylation and activation of the ERK1/2 (p-ERK1/2) pathway, which is an important autophagy-dependent signal pathway.
Discussion
The response of multicellular organisms to stress and maintenance of tissue homeostasis is a common biological problem in all eukaryotes, dictated by both genetic and environmental factors. Highly integrated and stereotypic response patterns are found in many organisms, but the means by which so many diverse pathways, critical for cellular, tissue, and ultimately organismal survival, are coordinated has yet to be elucidated. Here, we show that depletion of the evolutionarily ancient and highly conserved HMGB1 protein inhibits autophagy in human and murine cells. Conversely, inhibition of autophagy limits HMGB1 translocation, suggesting that HMGB1 is central to the regulation of autophagy. Moreover, we have shown that this effect is controlled by ERK1/2 phosphorylation and by interrupting the interaction of Beclin1 with Bcl-2. HMGB1 C106 is important for its translocation between the nucleus and cytoplasm, and oxidized C23/45 is required for the binding to Beclin1. These findings have implications for the temporal and spatial regulation of HMGB1 within cells and tissues, the connection between HMGB1 and autophagic pathways, and the role of HMGB1 as a critical regulator of cell survival.
HMGB1 protein is both a nuclear DNA binding factor and a secreted protein that is critically important for cell death and survival (Tang et al., 2010b). Its activities are determined by its intracellular localization and posttranslational modifications (including acetylation, ADP-ribosylation, phosphorylation, and thiol oxidation; Scaffidi et al., 2002; Lotze and Tracey, 2005; Hoppe et al., 2006; Kazama et al., 2008). HMGB1 is released during necrosis as an endogenous damage-associated molecular pattern molecule, or “danger” signal, during cell death (Scaffidi et al., 2002). Late-stage apoptotic cells can indeed release HMGB1, and oxidation of HMGB1 interferes with its ability to promote immunity (Kazama et al., 2008). ROS also function as signaling molecules in various pathways regulating both cell survival and cell death. ROS can induce autophagy through several distinct mechanisms involving catalase activation of Atg4 and disturbances in the mETC (Scherz-Shouval et al., 2007). We have shown here that ROS generated during starvation and rapamycin treatment serve as signaling molecules that initiate autophagy. Importantly, these stimuli caused HMGB1 cytosolic translocation from the nucleus, indicating that the function and localization of HMGB1 necessary to enhance autophagy are different from that observed in apoptosis. Moreover, we have demonstrated that HMGB1 translocation in autophagy is ROS dependent. Indeed, oxidative stress regulates HMGB1 release and subsequent inflammation in recruited macrophages and neutrophils and in ischemic tissues, including hepatocytes (Tang et al., 2007c; Tsung et al., 2007).
These findings (Fig. 2 and Fig. 3) suggest that HMGB1 is directly involved in the positive regulation and maintenance of autophagy in stressed cells. Autophagy was first discovered as a nonselective pathway for the degradation of intracellular constituents, activated in response to starvation (Maiuri et al., 2007; Levine and Kroemer, 2008). It is now clear that selective autophagic degradation of specific organelles and proteins occurs in response to diverse stimuli, varying from survival-promoting removal of pathogens, to degradation of damaged organelles and proteins, to programmed cell survival or cell death (Scherz-Shouval and Elazar, 2007). We found that targeted deletion of HMGB1 limits starvation-induced autophagy and enhances apoptosis. In the setting of cancer, overexpression of HMGB1 is associated with aberrant survival of many types of cancer, including breast, colon, melanoma, and others (Tang et al., 2010b). Thus, HMGB1 plays an important role in the regulation of autophagy in response to metabolic stress, oxidative injury, and genomic instability promoting programmed cell survival.
This study demonstrates that HMGB1 promotes and sustains autophagy, and we explored the mechanism by which this occurs. HMGB1 confers pro-autophagic activities, likely by controlling Beclin1–Bcl-2 complex formation. The dissociation of Bcl-2 from Beclin1 is an important mechanism involved in activating autophagy and limiting apoptosis in response to starvation and potentially after other physiological stimuli (Pattingre et al., 2005). Before this study, the regulation of the interaction between Bcl-2 and Beclin1 by adverse nutrient conditions was not thoroughly explored. We found that HMGB1 disrupts the interaction between Beclin1 and Bcl-2 by competitively binding to Beclin1 after starvation. The oxidation-sensitive C106, but not the vicinal C23 and C45, of HMGB1 regulated cytosolic localization and autophagy. C106S mutants have much higher cytoplasmic levels of HMGB1 and demonstrate enhanced binding to Beclin1, leading to the subsequent dissociation of Bcl-2 from Beclin1. C106S mutants were capable of initiating starvation-induced autophagy as efficiently as wild-type HMGB1, whereas C23S and C45S mutations abolished this effect. Thus, in two independent experiments, C106S mutants behave in a similar fashion to wild-type HMGB1. Meanwhile, C23S and C45S mutants lose their ability to mediate autophagy, as they are unable to bind Beclin1 and, therefore, cannot disrupt Bcl-2–Beclin1 interactions. These findings demonstrate that oxidation of HMGB1 regulates its localization and ability to sustain autophagy (Fig. 6). It thus appears that cytoplasmic translocation of HMGB1 is necessary but may not be sufficient to enhance autophagy.
The antiapoptotic molecule Bcl-2 is involved in the regulation of cell death and survival pathways during apoptosis and autophagy. It was previously reported that the phosphorylation of Bcl-2, likely by kinases of the JNK or ERK signaling pathway, is required for its antiapoptotic activity (Subramanian and Shaha, 2007; Wei et al., 2008). Our findings suggest that HMGB1 may also be involved in the regulation of Bcl-2 phosphorylation by the ERK/MAPK pathway because ablation of HMGB1 diminishes starvation-induced phosphorylation of both ERK1/2 and Bcl-2, although the mechanism of this effect is not clear. A recent study has shown that the HMGB1 receptor, receptor for advanced glycation endproducts, directly binds to ERK through a D domain–like docking site and regulates p-ERK1/2 (Ishihara et al., 2003). It is possible that cytoplasmic HMGB1 interacts with the cytosolic domain of receptor for advanced glycation endproducts and mediates concomitant ERK1/2 and Bcl-2 phosphorylation.
Based on the work reported here and previous findings implicating the nuclear sequestration of HMGB1 in apoptosis, its extracellular release in inflammation (Wang et al., 1999; Scaffidi et al., 2002; Kazama et al., 2008), and its critical role as a universal DNA sensor (Yanai et al., 2009; Sims et al., 2010), we propose a more nuanced conceptual model involving HMGB1 and cell death. In this model, ROS generated by cellular stress promote HMGB1 translocation to the cytosol, which induces autophagy, enhancing ERK signaling and disrupting Beclin1–Bcl-2 complex formation (Fig. 6). Thus, endogenous HMGB1 plays a central role in regulating programmed cell death (apoptosis) and programmed cell survival (autophagy). These findings will be instrumental in developing more effective therapies in the context of chronic inflammatory diseases, some of them associated with release of damage-associated molecular proteins (Zhang et al., 2010), including neurodegenerative disorders, autoimmunity, and cancer.
Materials and methods
Reagents
The antibodies to HMGB1 were obtained from Sigma-Aldrich and Novus Biologicals. The antibodies to caspase-3, cleaved caspase-3, cleaved PARP, GFP, Bcl-2, p-ERK (Thr202/Tyr204), and ERK were obtained from Cell Signaling Technology. The antibodies to tubulin and actin were obtained from Sigma-Aldrich. The antibodies to phosphoserine, SOD1, SOD2, fibrillarin, and catalase were obtained from Abcam. The antibodies to ATG5 and Beclin1 were purchased from Novus Biologicals. The antibody to LC3 was purchased from Novus Biologicals or AnaSpec. The antibody to p62 was obtained from Santa Cruz Biotechnology, Inc. The SOD activity assay kit was also obtained from Abcam. The nuclear and cytoplasmic extraction kit was obtained from Thermo Fisher Scientific. Other reagents and kits were obtained from Sigma-Aldrich.
Cell culture
Panc2.03, Panc02, HCT116, and Hmgb1−/− and Hmgb1+/+ immortalized MEF (Scaffidi et al., 2002) cells were cultured in RPMI 1640, DME, or McCoy’s 5a medium supplemented with 10% heat-inactivated FBS, 2 mM glutamine, and antibiotic–antifungal mix (10,000 units/ml penicillin and 10,000 µg/ml streptomycin; Invitrogen) in a humidified incubator with 5% CO2.
Gene transfection and RNAi
HMGB1-GFP or mutant (C23S, C45S, or C106S; Hoppe et al., 2006) or pUNO1-HMGB1 (InvivoGen) expression vectors were transfected into cells using Lipofectamine 2000 reagent (Invitrogen) according to the manufacturer’s instructions. Constructs were sequenced and confirmed in the University of Pittsburgh core sequencing laboratories. Human SOD1/SOD2-siRNA, mouse Beclin1–Bcl-2 siRNA (Santa Cruz Biotechnology, Inc.), mouse Beclin1 short hairpin RNA (shRNA), human HMGB1 shRNA, and mouse ATG5 shRNA (Sigma-Aldrich) were transfected into cells using Lipofectamine RNAiMAX reagent (for siRNA) or Lipofectamine 2000 reagent (for shRNA) according to the manufacturer’s instructions (Invitrogen). After gene transfection and RNAi for 48 h, the medium over the cells was changed before subsequent treatments.
Western blotting
Whole-cell lysates were resolved on 4–12% Criterion XT Bis-Tris gels (Bio-Rad Laboratories) and transferred to a nitrocellulose membrane as previously described (Tang et al., 2007b). After blocking, the membrane was incubated for 2 h at 25°C or overnight at 4°C with various primary antibodies. After incubation with peroxidase-conjugated secondary antibodies for 1 h at 25°C, the signals were visualized by enhanced chemiluminescence (Thermo Fisher Scientific) according to the manufacturer’s instruction. The relative band intensity was quantified using the Gel-pro Analyzer software (Media Cybernetics).
Measurement of intracellular ROS and mitochondrial superoxide
Cells were seeded in 96-well plates and cultured in the presence of a given stimuli for the indicated time. ROS were assessed with cell-permeable dye CM-H2DCFDA (Invitrogen) and mitochondrial superoxide using MitoSox (Invitrogen) as described previously (Kang et al., 2010b). Analysis of signal intensity was performed using a fluorescent plate reader.
IP analysis
Cells were lysed at 4°C in ice-cold radioimmunoprecipitation assay lysis buffer (Millipore), and cell lysates were cleared by a brief centrifugation for 10 min at 12,000 g. Concentrations of proteins in the supernatant were determined by bicinchoninic acid assay. Before IP, samples containing equal amounts of proteins were precleared with protein A or protein G agarose/Sepharose at 4°C for 3 h and subsequently incubated with 2–5 µg/ml various irrelevant IgG or specific antibodies in the presence of protein A or G agarose/Sepharose beads for 2 h or overnight at 4°C with gentle shaking (Tang et al., 2007a,b). After incubation, agarose/Sepharose beads were washed extensively with PBS, and proteins were eluted by boiling in 2× SDS sample buffer before SDS-PAGE electrophoresis. As a control, a portion of the lysate was treated with 50 mM DTT to reduce sample as described previously (Anathy et al., 2009).
Analysis of HMGB1 translocation and LC3 punctae formation by imaging cytometry
Cells were seeded in 96-well plates, cultured in the presence of various stimuli for given times, and then were fixed with 3% paraformaldehyde and stained with HMGB1 or LC3 antibody. Secondary antibodies were goat IgG conjugated either with Alexa Fluor 488 or Alexa Fluor 647 fluorochromes. Nuclear morphology was visualized with the fluorescent dye Hoechst 33342 (Sigma-Aldrich). Imaging data were collected with an imaging cytometer (ArrayScan HCS 4.0; Cellomics) with a 20x objective at 25°C. The ArrayScan is an automated fluorescent imaging microscope that collects information about the spatial distribution of fluorescently labeled components in cells placed in 96-well microtiter plates. The Spot Detector BioApplication (Thermo Fisher Scientific) was used to acquire and analyze the images after optimization. Images of 500–1,000 cells for each treatment group were analyzed to obtain the mean nuclear and cytosolic HMGB1 intensity and LC3 fluorescence punctae number per cell (Tang et al., 2009).
Autophagy assays
All assays for endogenous LC3 punctae were performed by imaging cytometry as previously described (Kang et al., 2010a). Formation of autophagic vesicles was further monitored by transient expression of GFP-LC3 (gifts of X.-M. Yin, University of Pittsburgh, Pittsburgh, PA) aggregation in cell lines. The percentage of cells with GFP-LC3 punctae was determined by counting the number of positively staining cells from 100 randomly chosen cells from three separate experiments. Autophagic flux assays were performed by Western blotting for LC3-I/II formation after starvation in the presence or absence of lysosomal protease inhibitors (E64d/pepstatin A) as recommended (Mizushima and Yoshimori, 2007).
Confocal microscopy analysis of p62 and colocalization of LAMP2/LC3 were performed. Images were collected using a laser-scanning confocal microscope (Fluoview FV-1000; Olympus) using a 60x Plan Apo/1.45 oil immersion objective at 25°C and were captured and analyzed by Fluoview software (FV10-ASW 1.6; Olympus). Images were subsequently analyzed for the level and colocalization by Image-Pro Plus 5.1 software (Media Cybernetics).
Transmission electron microscopy assessment of autophagosome and autophagolysosomes was performed as previously described (Shao et al., 2004). In brief, cells were fixed with 2% paraformaldehyde and 2% glutaraldehyde in 0.1 mol/L phosphate buffer, pH 7.4, followed by postfixation for 6 h in 1% OsO4. After dehydration with graded alcohols, the samples were embedded in epoxy resin (epon). Then, thin sections (70 nm) were cut with a microtome (Ultracut R; Leica), mounted on copper grids and poststained with 2% uranyl acetate and 1% lead citrate, dried, and analyzed using a transmission electron microscope at 25°C (100CX; JEOL, Inc.). Thick sections were cut (300 nm) and stained with 1% toluidine blue. Images were acquired digitally from a randomly selected pool of 10–15 fields under each condition.
Apoptosis assays
Apoptosis in cells was assessed using the FITC Annexin V Apoptosis Detection kit (BD; annexin V–FITC, propidium iodide (PI) solution, and annexin V binding buffer). This assay involves staining cells with annexin V–FITC (a phospholipid-binding protein that binds to disrupted cell membranes) in combination with PI (a vital dye that binds to DNA penetrating into apoptotic cells). Flow cytometric analysis (FACS) was performed to determine the percentage of cells that were undergoing apoptosis (annexin V+/PI−). Cleaved PARP and cleaved caspase-3 were measured by Western blotting analysis.
Enucleation by centrifugation
HMGB1−/− and HMGB1+/+ MEFs grown on collagen-coated minicoverslips were enucleated as described previously, with minor modifications (Goldman et al., 1973; Miller and Ruddle, 1974). To enucleate the cells, the minicoverslips were inverted (cell side down) and placed into the bottom of 1.5-ml Eppendorf tubes containing 10 µg/ml cytochalasin B (Sigma-Aldrich) in medium. After centrifugation at 12,000 g for 60 min, the minicoverslips were removed from the tubes and placed cell side up into a 6-well plate containing 2 ml of medium without cytochalasin B for subsequent studies and staining for autophagy.
Statistical analysis
Data are expressed as means ± SEM of three independent experiments performed in triplicate. One-way analysis of variance was used for comparison among the different groups by SPSS 12.0. When the analysis of variance was significant, post-hoc testing of differences between groups was performed using Fisher’s least significant difference test. A p-value <0.05 was considered significant; P < 0.005 and P < 0.0005 were reported where applicable.
Online supplemental material
Fig. S1 shows that autophagic stimuli promote cytosolic HMGB1 translocation that is not dependent on plasma membrane disruption. Fig. S2 shows that autophagic stimuli increase ROS and mitochondrial superoxide levels and decrease SOD activity while having no direct effect on catalase activity levels. Fig. S3 shows that provision of antioxidants or knockdown of SOD1 and SOD2 increases rapamycin-induced autophagy and HMGB1 translocation. Fig. S4 shows that knockdown of HMGB1 limits autophagy in HCT116 and Panc2.03 cells. Fig. S5 shows that HMGB1 depletion promotes apoptosis. Online supplemental material is available at http://www.jcb.org/cgi/content/full/jcb.200911078/DC1.
Acknowledgments
Thoughtful discussions and review of this work with Timothy Billiar and Sarah Berman at the University of Pittsburgh and external colleagues Guido Kroemer, Douglas Green, Matthew Albert, Eva Szegezdi, and Beth Levine were much appreciated. We also thank the reviewers for constructive suggestions.
This project was funded by the National Institutes of Health (an Integrating NK and DC into Cancer Therapy grant [1 P01 CA 101944-04] from the National Cancer Institute to M.T. Lotze) and a grant from Associazione Italiana Ricerca sul Cancro (to M.E. Bianchi).
Footnotes
Abbreviations used in this paper:
- ERK
- extracellular signal-regulated kinase
- IP
- immunoprecipitation
- MEF
- mouse embryonic fibroblast
- MEK
- MAPK kinase
- mETC
- mitochondrial electron transport chain
- NAC
- N-acetyl cysteine
- PARP
- poly(ADP-ribose) polymerase
- p-ERK
- phosphorylation of ERK
- PI
- propidium iodide
- ROS
- reactive oxygen species
- Rot
- rotenone
- shRNA
- short hairpin RNA
- SOD
- superoxide dismutase
References
- Anathy V., Aesif S.W., Guala A.S., Havermans M., Reynaert N.L., Ho Y.S., Budd R.C., Janssen-Heininger Y.M. 2009. Redox amplification of apoptosis by caspase-dependent cleavage of glutaredoxin 1 and S-glutathionylation of Fas. J. Cell Biol. 184:241–252 10.1083/jcb.200807019 [DOI] [PMC free article] [PubMed] [Google Scholar]
- Bjørkøy G., Lamark T., Brech A., Outzen H., Perander M., Overvatn A., Stenmark H., Johansen T. 2005. p62/SQSTM1 forms protein aggregates degraded by autophagy and has a protective effect on huntingtin-induced cell death. J. Cell Biol. 171:603–614 10.1083/jcb.200507002 [DOI] [PMC free article] [PubMed] [Google Scholar]
- Goldman R.D., Pollack R., Hopkins N.H. 1973. Preservation of normal behavior by enucleated cells in culture. Proc. Natl. Acad. Sci. USA. 70:750–754 10.1073/pnas.70.3.750 [DOI] [PMC free article] [PubMed] [Google Scholar]
- Hoppe G., Talcott K.E., Bhattacharya S.K., Crabb J.W., Sears J.E. 2006. Molecular basis for the redox control of nuclear transport of the structural chromatin protein Hmgb1. Exp. Cell Res. 312:3526–3538 10.1016/j.yexcr.2006.07.020 [DOI] [PubMed] [Google Scholar]
- Ishihara K., Tsutsumi K., Kawane S., Nakajima M., Kasaoka T. 2003. The receptor for advanced glycation end-products (RAGE) directly binds to ERK by a D-domain-like docking site. FEBS Lett. 550:107–113 10.1016/S0014-5793(03)00846-9 [DOI] [PubMed] [Google Scholar]
- Kang R., Tang D., Schapiro N.E., Livesey K.M., Farkas A., Loughran P., Bierhaus A., Lotze M.T., Zeh H.J. 2010a. The receptor for advanced glycation end products (RAGE) sustains autophagy and limits apoptosis, promoting pancreatic tumor cell survival. Cell Death Differ. 17:666–676 10.1038/cdd.2009.149 [DOI] [PMC free article] [PubMed] [Google Scholar]
- Kang R., Tang D., Yu Y., Wang Z., Hu T., Wang H., Cao L. 2010b. WAVE1 regulates Bcl-2 localization and phosphorylation in leukemia cells. Leukemia. 24:177–186 10.1038/leu.2009.224 [DOI] [PMC free article] [PubMed] [Google Scholar]
- Kazama H., Ricci J.E., Herndon J.M., Hoppe G., Green D.R., Ferguson T.A. 2008. Induction of immunological tolerance by apoptotic cells requires caspase-dependent oxidation of high-mobility group box-1 protein. Immunity. 29:21–32 10.1016/j.immuni.2008.05.013 [DOI] [PMC free article] [PubMed] [Google Scholar]
- Levine B., Kroemer G. 2008. Autophagy in the pathogenesis of disease. Cell. 132:27–42 10.1016/j.cell.2007.12.018 [DOI] [PMC free article] [PubMed] [Google Scholar]
- Livesey K.M., Tang D., Zeh H.J., Lotze M.T. 2009. Autophagy inhibition in combination cancer treatment. Curr. Opin. Investig. Drugs. 10:1269–1279 [PubMed] [Google Scholar]
- Lotze M.T., Tracey K.J. 2005. High-mobility group box 1 protein (HMGB1): nuclear weapon in the immune arsenal. Nat. Rev. Immunol. 5:331–342 10.1038/nri1594 [DOI] [PubMed] [Google Scholar]
- Maiuri M.C., Zalckvar E., Kimchi A., Kroemer G. 2007. Self-eating and self-killing: crosstalk between autophagy and apoptosis. Nat. Rev. Mol. Cell Biol. 8:741–752 10.1038/nrm2239 [DOI] [PubMed] [Google Scholar]
- Miller R.A., Ruddle F.H. 1974. Enucleated neuroblastoma cells form neurites when treated with dibutyryl cyclic AMP. J. Cell Biol. 63:295–299 10.1083/jcb.63.1.295 [DOI] [PMC free article] [PubMed] [Google Scholar]
- Mizushima N., Yoshimori T. 2007. How to interpret LC3 immunoblotting. Autophagy. 3:542–545 [DOI] [PubMed] [Google Scholar]
- Pattingre S., Tassa A., Qu X., Garuti R., Liang X.H., Mizushima N., Packer M., Schneider M.D., Levine B. 2005. Bcl-2 antiapoptotic proteins inhibit Beclin 1-dependent autophagy. Cell. 122:927–939 10.1016/j.cell.2005.07.002 [DOI] [PubMed] [Google Scholar]
- Scaffidi P., Misteli T., Bianchi M.E. 2002. Release of chromatin protein HMGB1 by necrotic cells triggers inflammation. Nature. 418:191–195 10.1038/nature00858 [DOI] [PubMed] [Google Scholar]
- Scherz-Shouval R., Elazar Z. 2007. ROS, mitochondria and the regulation of autophagy. Trends Cell Biol. 17:422–427 10.1016/j.tcb.2007.07.009 [DOI] [PubMed] [Google Scholar]
- Scherz-Shouval R., Shvets E., Fass E., Shorer H., Gil L., Elazar Z. 2007. Reactive oxygen species are essential for autophagy and specifically regulate the activity of Atg4. EMBO J. 26:1749–1760 10.1038/sj.emboj.7601623 [DOI] [PMC free article] [PubMed] [Google Scholar]
- Shao Y., Gao Z., Marks P.A., Jiang X. 2004. Apoptotic and autophagic cell death induced by histone deacetylase inhibitors. Proc. Natl. Acad. Sci. USA. 101:18030–18035 10.1073/pnas.0408345102 [DOI] [PMC free article] [PubMed] [Google Scholar]
- Sims G.P., Rowe D.C., Rietdijk S.T., Herbst R., Coyle A.J. 2010. HMGB1 and RAGE in inflammation and cancer. Annu. Rev. Immunol. 28:367–388 10.1146/annurev.immunol.021908.132603 [DOI] [PubMed] [Google Scholar]
- Subramanian M., Shaha C. 2007. Up-regulation of Bcl-2 through ERK phosphorylation is associated with human macrophage survival in an estrogen microenvironment. J. Immunol. 179:2330–2338 [DOI] [PubMed] [Google Scholar]
- Tang D., Kang R., Xiao W., Jiang L., Liu M., Shi Y., Wang K., Wang H., Xiao X. 2007a. Nuclear heat shock protein 72 as a negative regulator of oxidative stress (hydrogen peroxide)-induced HMGB1 cytoplasmic translocation and release. J. Immunol. 178:7376–7384 [DOI] [PMC free article] [PubMed] [Google Scholar]
- Tang D., Kang R., Xiao W., Wang H., Calderwood S.K., Xiao X. 2007b. The anti-inflammatory effects of heat shock protein 72 involve inhibition of high-mobility-group box 1 release and proinflammatory function in macrophages. J. Immunol. 179:1236–1244 [DOI] [PMC free article] [PubMed] [Google Scholar]
- Tang D., Shi Y., Kang R., Li T., Xiao W., Wang H., Xiao X. 2007c. Hydrogen peroxide stimulates macrophages and monocytes to actively release HMGB1. J. Leukoc. Biol. 81:741–747 10.1189/jlb.0806540 [DOI] [PMC free article] [PubMed] [Google Scholar]
- Tang D., Kang R., Xiao W., Zhang H., Lotze M.T., Wang H., Xiao X. 2009. Quercetin prevents LPS-induced high-mobility group box 1 release and proinflammatory function. Am. J. Respir. Cell Mol. Biol. 41:651–660 10.1165/rcmb.2008-0119OC [DOI] [PMC free article] [PubMed] [Google Scholar]
- Tang D., Kang R., Cheh C.W., Livesey K.M., Liang X., Schapiro N.E., Benschop R., Sparvero L.J., Amoscato A.A., Tracey K.J., et al. 2010a. HMGB1 release and redox regulates autophagy and apoptosis in cancer cells. Oncogene. 10.1038/onc.2010.261 [DOI] [PMC free article] [PubMed] [Google Scholar]
- Tang D., Kang R., Zeh H.J., III, Lotze M.T. 2010b. High-mobility group box 1 and cancer. Biochim. Biophys. Acta. 1799:131–140 [DOI] [PMC free article] [PubMed] [Google Scholar]
- Tasdemir E., Maiuri M.C., Galluzzi L., Vitale I., Djavaheri-Mergny M., D’Amelio M., Criollo A., Morselli E., Zhu C., Harper F., et al. 2008. Regulation of autophagy by cytoplasmic p53. Nat. Cell Biol. 10:676–687 10.1038/ncb1730 [DOI] [PMC free article] [PubMed] [Google Scholar]
- Tsung A., Klune J.R., Zhang X., Jeyabalan G., Cao Z., Peng X., Stolz D.B., Geller D.A., Rosengart M.R., Billiar T.R. 2007. HMGB1 release induced by liver ischemia involves Toll-like receptor 4 dependent reactive oxygen species production and calcium-mediated signaling. J. Exp. Med. 204:2913–2923 10.1084/jem.20070247 [DOI] [PMC free article] [PubMed] [Google Scholar]
- Ulloa L., Ochani M., Yang H., Tanovic M., Halperin D., Yang R., Czura C.J., Fink M.P., Tracey K.J. 2002. Ethyl pyruvate prevents lethality in mice with established lethal sepsis and systemic inflammation. Proc. Natl. Acad. Sci. USA. 99:12351–12356 10.1073/pnas.192222999 [DOI] [PMC free article] [PubMed] [Google Scholar]
- Wang H., Bloom O., Zhang M., Vishnubhakat J.M., Ombrellino M., Che J., Frazier A., Yang H., Ivanova S., Borovikova L., et al. 1999. HMG-1 as a late mediator of endotoxin lethality in mice. Science. 285:248–251 10.1126/science.285.5425.248 [DOI] [PubMed] [Google Scholar]
- Wei Y., Pattingre S., Sinha S., Bassik M., Levine B. 2008. JNK1-mediated phosphorylation of Bcl-2 regulates starvation-induced autophagy. Mol. Cell. 30:678–688 10.1016/j.molcel.2008.06.001 [DOI] [PMC free article] [PubMed] [Google Scholar]
- Yanai H., Ban T., Wang Z., Choi M.K., Kawamura T., Negishi H., Nakasato M., Lu Y., Hangai S., Koshiba R., et al. 2009. HMGB proteins function as universal sentinels for nucleic-acid-mediated innate immune responses. Nature. 462:99–103 10.1038/nature08512 [DOI] [PubMed] [Google Scholar]
- Zhang Q., Raoof M., Chen Y., Sumi Y., Sursal T., Junger W., Brohi K., Itagaki K., Hauser C.J. 2010. Circulating mitochondrial DAMPs cause inflammatory responses to injury. Nature. 464:104–107 10.1038/nature08780 [DOI] [PMC free article] [PubMed] [Google Scholar]


