

Abstract
An experimental study has been conducted to determine the stress–strain behaviour of human corneal tissue and how the behaviour varies with age. Fifty-seven well-preserved ex vivo donor corneas aged between 30 and 99 years were subjected to cycles of posterior pressure up to 60 mm Hg while monitoring their behaviour. The corneas were mechanically clamped along their ring of scleral tissue and kept in physiological conditions of temperature and hydration. The tissue demonstrated hyper-elastic pressure-deformation and stress–strain behaviour that closely matched an exponential trend. Clear stiffening (increased resistance to deformation) with age was observed in all loading cycles, and the rate of stiffness growth was nonlinear with bias towards older specimens. With a strong statistical association between stiffness and age (p < 0.05), it was possible to develop generic stress–strain equations that were suitable for all ages between 30 and 99 years. These equations, which closely matched the experimental results, depicted corneal stiffening with age in a form suitable for implementation in numerical simulations of ocular biomechanical behaviour.
Keywords: ocular biomechanics, cornea, ageing, stress–strain behaviour
1. Introduction
A thorough understanding of the biomechanical behaviour of the cornea is essential for a number of clinical applications including tonometry (Orssengo & Pye 1999; Liu & Roberts 2005), contact lens wear (Caroline 2001; Swarbrick 2006), injury treatment (Uchio et al. 1999) and refractive surgery (Alastrue et al. 2006; Fernandez et al. 2006). The biomechanical behaviour of the human cornea is dominated by the fibrous stroma (Boyce et al. 2008), which forms about 90 per cent of the total corneal thickness (Coster 2001), and has been found to exhibit significantly higher mechanical stiffness compared with other corneal layers (Elsheikh et al. 2008a). The stroma has a composite structure with 200–300 superimposed lamellae, each composed of parallel collagen fibrils embedded in an extracellular matrix rich in proteoglycans, glycoproteins and keratocytes (Parry & Craig 1979; Komai & Ushiki 1991; Meek & Boote 2004; Muller et al. 2004). Earlier research identified collagen fibrils as the main load carrying components of the stroma, and found a clear link between the content and distribution of fibrils and the biomechanical behaviour of the cornea (Kokott 1938; Boote et al. 2005).
Stromal microstructure is known to undergo changes with age including an increase in the cross-sectional areas of both collagen fibrils (Daxer et al. 1998) and fibrillar molecules (Malik et al. 1992) which may be due to an increase in non-enzymatic cross-linking. Age is also associated with a decrease in the inter-fibrillar spacing (Kanai & Kaufman 1973), which could be related to changes in the proteoglycan composition of the inter-fibrillar matrix. The important role collagen fibrils play in corneal biomechanics (Boote et al. 2009) makes these structural changes important and strongly indicative of tissue stiffening with age.
Other indirect evidence relating age to corneal biomechanics was obtained in a number of tonometry studies where age could be associated with an overestimation of intraocular pressure, IOP (Klein et al. 1992; Leske et al. 1997; Rochtchina et al. 2002; Kotecha et al. 2005; Tonnu et al. 2005). This evidence suggested that increased age led to stiffening of corneal tissue, higher resistance to deformation under tonometry loading and hence increased IOP readings (Friedenwald 1937). This observation encouraged earlier research by the authors to assess the variation of corneal stiffness with age using tests on ex vivo donor corneas (Elsheikh et al. 2007a, 2008c). The research found strong statistical association between age and tissue stiffening and led to the development of stress–strain equations for corneas within three age ranges, namely 50–64, 65–79 and 80–95 years. The present study builds on this earlier effort, involves the testing of more corneas within a wider age range, and attempts to derive generic stress–strain equations without particular emphasis on any specific age.
2. Material and methods
Fifty-nine corneas from human donors aged between 30 and 99 years were obtained fresh from the Banca degli Occhi di Monza and the Fondazione Banca degli Occhi del Veneto, Italy. With a mean age of 76.0 ± 13.3 years, the number of specimens within each age decade from the 30s to the 90s (1, 3, 8, 8, 14, 17, 8, respectively) were biased towards old age. The eyes were enucleated 6–12 h after death, and the corneas (with a 3 mm wide ring of scleral tissue) were extracted and preserved in storage medium Eusol-C (Alchima, Padova, Italy), and used within 7 days post-mortem. The limit of 7 days was adhered to based on earlier research confirming the maintenance of tissue quality for this period (Amato et al. in press; Pocobelli et al. in press). Routine screening was used to exclude donors with human immunodeficiency virus, hepatitis B and C, syphilis, central nervous system degenerative diseases, active infections and eye tumours. The corneas were not frozen at any stage. Ethical approval to use the specimens in research was obtained by the eye banks in accordance with the Declaration of Helsinki.
The specimen dimensions were measured with an electronic vernier calliper (D00352, Duratool, Taiwan) with 10 µm accuracy. The vertical (superior–inferior) and horizontal (temporal–nasal) diameters of the corneas were 10.99 ± 0.69 mm and 11.81 ± 0.69 mm, respectively. The central anterior radius, Rant, was measured from digital images of corneal profile taken with a FinePix S7000 8 Mp digital camera (Fujifilm, Tokyo, Japan) and the average value was 7.62 ± 0.79 mm.
The central corneal thickness, CCT, was measured with a Pachmate 55 Pachymeter (DGH Technologies, Exton, PA), and the average and standard deviation results were 584 ± 53 µm. The average value was about 6.6 per cent and 39 µm higher than the average in vivo value (543 µm) reported in the literature (Aghaian et al. 2004), indicating that Eusol-C was successful in maintaining specimen hydration. The peripheral corneal thickness, PCT, was also measured 1 mm from the limbus at the ends of the vertical and horizontal diameters, and the average value was 773 ± 62 µm. Measurements were repeated three times at each location, and the average value considered in later analysis.
The corneas were subjected to cycles of posterior pressure increase and decrease using an inflation test rig developed in an earlier study (Elsheikh et al. 2007a), as shown in figure 1. The rig enabled control of specimen temperature at 37°C and hydration at the normal physiological level, uninterrupted pressure increase or decrease to pre-selected rates, and non-contact monitoring of behaviour using two 8 Mp digital cameras and a 1 µm accuracy laser beam of the LK series (Keyence, Milton Keynes, UK). The specimens were connected, along their rings of scleral tissue, to the rig's pressure chamber using only mechanical clamps and without the need for adhesive. The pressure chamber was filled with saline solution and connected to a small reservoir, whose vertical movement was computer-controlled to set the pressure change rate at 37.5 mm Hg min−1. The actual pressure in the chamber was measured using a differential wet/wet pressure transducer of the FDW series (RDP Electronics, Wolverhampton, UK) and the measurements (along with those of the laser beam) were logged automatically. The specimen's anterior surface was wetted regularly with a viscous tear film supplement (Visco-tears, Novartis, Australia) to prevent drying. The wetting took place just before the start of each new pressure cycle and involved the release of three drops onto the clamping area above the cornea so that the tear film supplement would flow slowly over the specimen and maintain a thin film that would not interfere with the behaviour monitoring devices.
Figure 1.

Inflation rig used for cornea testing. (a) Shows [1] the pressure chamber, [2] the laser beam used to monitor cornea apical displacement, [3] pressure transducer that monitors the posterior pressure acting on corneal specimens, [4] temperature controller to enable conduct of tests at 37°C, [5] pressure vessel, [6] fitting for a camera used to monitor corneal profile during test—cameras are not shown for clarity. (b) Shows a cross section through the front piece of the pressure chamber.
The pressure rate selected was close to the rate of IOP change from standing or seated to supine position—reported to be between 0.6 and 6 mm Hg taking place in a few seconds (Kothe 1994)—or the change in IOP during normal eye rubbing (McMonnies 2007, 2008).
The maximum pressure applied was 60 mm Hg, which was above the normal physiological level. Three cycles of loading and unloading were applied to condition the tissue and stabilize its mechanical behaviour before considering the results in the fourth cycle as representative of the cornea's biomechanical behaviour. In the last group of specimens, involving 19 corneas, 10 loading cycles were applied to assess the changes in mechanical behaviour over more than four cycles, and the conditioning behaviour of these specimens was correlated with their age values. However, for consistency with earlier studies (Bryant & McDonnell 1996; Zeng et al. 2001; Elsheikh et al. 2007a) and because the specimens demonstrated only small changes beyond the third cycle, the results of the fourth cycle were considered representative of the behaviour after conditioning in the comparisons presented below.
The analysis presented in this paper covered the results of both the first and fourth loading cycles, i.e. before and after conditioning. Both sets of results were thought to be important and representative of corneal response at different behaviour stages. While the conditioned behaviour indicated the response to actions which had been in existence for a significant time period or repeated sufficiently to ensure behaviour stabilization, the behaviour before conditioning could represent the response to new mechanical actions that create stresses, which are higher or different from those experienced under common loads such as normal IOP, but still within the current test range, such as IOP rise above the normal level, quasi-static contact tonometry and wear of rigid contact lenses.
The main outputs of the inflation rig were the measurements of posterior pressure and corneal apical displacement recorded every 0.5 s, in addition to camera images taken at the start of the test and at the end of each pressure cycle. These electronic images were digitized to locate several points on the anterior surface and, with the thickness measurements at corneal apex and near the limbus, also locate points on the posterior surface. These sets of points were used to determine the radius of the best-fit sphere of the cornea's median surface, Rm, using the least squares method. The radius of intersection between the cornea's and sclera's median surfaces, Ri, was also measured directly from the same images.
Further camera images were taken at 15, 30, 45 and 60 mm Hg applied pressures and used to relate the forward displacements at the apex with those at the corneo-scleral intersection. This was needed so that the corneal rise used in later analysis did not include an element of scleral deformation.
The posterior pressure and apical displacement results were converted into stress–strain behaviour using mathematical shell analysis (Anderson et al. 2004; Elsheikh et al. 2007b). The analysis used the following equation to derive the secant modulus, Es:
| 2.1 |
where p is the posterior pressure, r apical rise, t average corneal thickness (taken as the average of CCT and PCT), ν Poisson's ratio taken as 0.49 assuming the cornea to behave as an incompressible material, 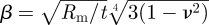 , and η = sin−1(Ri/Rm). The strain at this behaviour point, at which p and r were obtained, was defined as
| 2.2 |
and the stress as
| 2.3 |
This process was repeated for all pressure-rise data points to derive the corresponding stress–strain relationship of the tissue and to enable tracing the nonlinear behaviour of corneal tissue. Further information on the repeated application of the analysis equation can be found in Elsheikh et al. (2007a).
2.1. Statistical analysis
The significance of associations including those between age and stress levels was assessed in this study by the χ2 test. Statistical analyses were performed in SPSS 17.0 (SPSS Inc., IL).
3. Results
3.1. Overall specimen behaviour
An example set of results for a cornea of a 79-year-old donor is shown in figure 2. The results include the pressure–apical rise behaviour over all the applied loading cycles—10 in this case—the stress–strain behaviour obtained over both the first and fourth cycles, the variation of material stiffness (as measured by the tangent modulus, E) with applied stress within the first and fourth cycles, and the variation of E with the progression of load cycles.
Figure 2.

Example results of a cornea specimen obtained from a 79-year-old donor. The results include: (a) the pressure–apical behaviour under 10 load cycles, (b) stress–strain behaviour based on the results of the first (grey line) and fourth (black line) load cycles, (c) the relationship between the tangent modulus, E, and stress within the first (grey) and fourth (black) load cycles and (d) the variation of E at different stress levels (filled squares, stress = 0.01 MPa; filled triangles, stress = 0.02 MPa; filled circles, stress = 0.03 MPa) with the progression of load cycles.
Specimens exhibited nonlinear pressure-rise and stress–strain behaviour with an initial low stiffness increasing gradually under higher stresses. The transition from low to high stiffness was gradual, although it was faster at low stress levels. Converting the stress–strain results to E–σ behaviour, as in figure 2c, showed a linear relationship in most cases. The linear form of E–σ results could be related to the usual exponential stress–strain relationship, σ = A[eBɛ − 1] (where A and B are constants), which was found to closely fit the σ–ɛ results. Differentiating the stress, σ, with respect to the strain, ɛ, to derive the tangential modulus, E, led to the linear relationship
| 3.1 |
All corneas further demonstrated conditioning behaviour similar to, although slightly slower than, that shown in figure 2d. Following considerable stiffening in the first 2–3 cycles, little change was seen in subsequent cycles. By considering the behaviour to have stabilized by the third cycle, the rate of conditioning (or behaviour stabilization) was assessed by comparing the final E in the first three cycles, E1–E3, against the average of E4–E10. The average values of the ratios E1/E4–10, E2/E4–10 and E3/E4–10 were 0.835 ± 0.102, 0.961 ± 0.075 and 0.990 ± 0.053, respectively.
3.2. Behaviour comparisons
The stress–strain behaviour patterns of all corneas as obtained from the first and fourth loading cycles are plotted together in figure 3a,b, respectively. Results of the fourth cycle were plotted from a point of zero strain to enable direct comparison between the behaviour patterns of different specimens and to exclude the effect of viscoelasticity, which was responsible for shifting the stress–strain relationship with repeated loading cycles. Further, in order to overcome the local noise in the data and to facilitate later analysis, the stress–strain results of each specimen were fitted to an exponential equation, σ = A[eBɛ − 1], using the least squares method, and the stress–strain relationship as derived from this equation was used in the comparisons in figure 3.
Figure 3.

Stress–strain behaviour of corneas as obtained from (a,c,e) first loading cycle and (b,d,f) fourth loading cycle. The results include: (a,b) the results of all corneas, (c,d) the results of corneas aged 40–59 years and (e,f) the results of corneas aged 80–99 years. Black lines represent the average behaviour in each case.
The average behaviour, which was obtained in each case by calculating the average stress at each strain level, is plotted with a heavy line. The figures show that while all specimens exhibited similar nonlinear behaviour, there was a considerable scatter in the results. For instance, at a strain of 0.02, the ratio between the highest and lowest stiffness was 4.72 and 6.69 in results within the first and fourth loading cycles, respectively.
To illustrate the age effects on behaviour, the figures are reproduced in figure 3c–f with only results of specimens within age ranges 40–59 and 80–99 years, respectively. The separation in results that can be seen in the figures provided qualitative evidence that higher stiffness was associated with increased age.
An exercise was then carried out in which the stresses at a specific strain level were plotted against specimen age, and it became clear that, regardless of the strain level considered, there was a nonlinear relationship between stress and age. Figure 4 presents an example of the stress–age relationships obtained at a strain of 0.8 per cent, which corresponded to an IOP of 15 mm Hg for a cornea with average dimensions and material properties. The relationships pointed at gradual increases in stress with age, which were particularly clear at the high end of the age range considered. The association between the stress level and age was also significant (p < 0.05) for all of the strain range covered, except in fourth cycle results where it became insignificant at strains below 0.8 per cent.
Figure 4.

Variation of stress with age at strain = 0.008 (which corresponds to an IOP of 15 mm Hg for a cornea with average dimensions and material properties) showing the nonlinear polynomial relationship between the two parameters. (a) First loading cycle (y =1 × 10−7x2 +2 × 10⁻⁶x + 0.0011, R2 = 0.1444) and (b) fourth loading cycle (y =5 × 10−7x2 −1 × 10⁻⁵x + 0.0017, R2 = 0.2866).
In order to develop a generic stress–strain relationship that is representative of corneal tissue behaviour in any age, consideration was made both of the exponential relationship (σ = A[eBɛ − 1]) between stress and strain followed by individual specimens, and the second order polynomial correlation between stress and age similar to those seen in figure 4. Therefore, a stress–strain relationship of the form
| 3.2 |
was assumed. In this form, the parameters a–g would be derived using the least-squares method to achieve the best match with the experimental stress–strain results. Initial values of the parameters were derived from the average behaviour of all specimens shown in figure 3a,b, and the nonlinear relationship between stress and age depicted in figure 4. These parameter values were used to calculate the stresses corresponding to strain levels between 0.1 and 3 per cent in steps of 0.1 per cent. The errors in predicting stress (calculated stress − actual stress) were determined for each specimen at each strain level, giving a total of 1770 points (59 specimens × 30 strain levels). An optimization exercise was then carried out whereby the sum of the squared errors was minimized while controlling the values of parameters a–g. This exercise was repeated twice to fit the first cycle and fourth cycle results, respectively, and the minimum sums of squared errors achieved in the two cases were 0.0018 and 0.0083 MPa2—the equivalent of 0.0010 and 0.0022 MPa average error in stress at each analysis point. The corresponding values of parameters a to g are as given in equations (3.3) and (3.4):
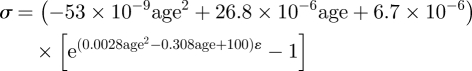 |
3.3 |
and
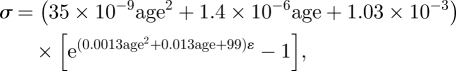 |
3.4 |
where σ is in MPa and age in years. The variation of stress and tangent modulus with age as predicted using equations (3.3) and (3.4) is demonstrated numerically in tables 1 and 2, respectively. As the level of strain increases linearly, both stresses and E values increase nonlinearly, but the relationship between stress and E remains close to linear. The results also show the nonlinear increase in E associated with ageing and how the increase in E accelerates at the higher end of the age range considered. There is also clear stiffening, seen in consistent increases in the values of E, with conditioning between the first and fourth loading cycles. On average, the increase in E, which was particularly evident in younger corneas, was 52.2, 28.2, 18.4 and 13.5 per cent for corneas aged 40, 60, 80 and 100 years, respectively. The corresponding average increases in stress (at the same levels of strain) were similarly most apparent in younger corneas: 43.2, 17.8, 7.3 and 2.3 per cent.
Table 1.
Variation of stress, σ, and tangent modulus, E, with both the strain level, ɛ, and age as obtained from equation (3.3) for behaviour within the first loading cycle.
| 40-year-old corneas (MPa) |
60-year-old corneas (MPa) |
80-year-old corneas (MPa) |
100-year-old corneas (MPa) |
|||||
|---|---|---|---|---|---|---|---|---|
| σ | E | σ | E | σ | E | σ | E | |
| ɛ = 0.01 | 0.002 | 0.231 | 0.002 | 0.327 | 0.003 | 0.431 | 0.004 | 0.556 |
| ɛ = 0.02 | 0.005 | 0.580 | 0.007 | 0.817 | 0.010 | 1.095 | 0.013 | 1.471 |
| ɛ = 0.03 | 0.015 | 1.457 | 0.021 | 2.042 | 0.028 | 2.784 | 0.038 | 3.891 |
Table 2.
Variation of stress, σ, and tangent modulus, E, with both the strain level, ɛ, and age as obtained from equation (3.4) for behaviour within the fourth loading cycle.
| 40-year-old corneas (MPa) |
60-year-old corneas (MPa) |
80-year-old corneas (MPa) |
100-year-old corneas (MPa) |
|||||
|---|---|---|---|---|---|---|---|---|
| σ | E | σ | E | σ | E | σ | E | |
| ɛ = 0.01 | 0.002 | 0.320 | 0.002 | 0.367 | 0.003 | 0.437 | 0.003 | 0.534 |
| ɛ = 0.02 | 0.008 | 0.880 | 0.009 | 1.041 | 0.011 | 1.288 | 0.013 | 1.655 |
| ɛ = 0.03 | 0.023 | 2.424 | 0.027 | 2.951 | 0.034 | 3.795 | 0.044 | 5.128 |
The close fit between equations (3.3) and (3.4) and the experimental results is illustrated in figure 5 where the stress–strain fourth-cycle behaviour patterns predicted by equation (3.4) are compared with the average experimental behaviour obtained for corneas within each age decade. The comparisons were limited to corneas aged between 50 and 99 years since the number of specimens aged below 50 years was insufficient to hold reliable comparisons. The average values of specimen age within each age decade were 55.5, 64.0, 74.9, 84.5 and 94.0 years, respectively. These values were quite close to the middle points of age decades, ensuring that the average stress–strain behaviour could reasonably be considered representative of the behaviour within the corresponding age group. The comparisons demonstrated the suitability of equation (3.4) to describe the behaviour within all age groups, with the maximum difference between the equation predictions and the average behaviour limited to 11 per cent. Similar results were obtained when comparing equation (3.3) predictions to first-cycle experimental data.
Figure 5.

Comparisons between the stress–strain constitutive models obtained using equation (3.4) and the average experimental behaviour of corneas aged between (a) solid line, 50 and 59 years; dashed line, equation 55 years; (b) solid line, 60 and 69 years; dashed line, equation 65 years; (c) solid line, 70 and 79 years; dashed line, equation 75 years; (d) solid line, 80 and 89 years; dashed line, equation 85 years; (e) solid line, 90 and 99 years; dashed line, equation 95 years. The results of equation (3.4) for different age groups are compared in (f): solid line, equation 55 years; dash dotted line, equation 65 years; long-dashed line, equation 75 years; short-dashed line, equation 85 years; dashed-double dotted line, equation 95 years. The error bars represent the standard deviation of stress values.
3.3. Conditioning behaviour
While all corneas exhibited similar conditioning behaviour with gradual stabilization of mechanical response to successive loading cycles, there was evidence of some differences in the rate of stabilization between specimens. In order to quantify these differences, ratios between the final E obtained in the first three cycles, E1–E3 and the average E of cycles 4–10, E4–10, are plotted against age in figure 6. The figure shows that, on average, older corneas stabilized their behaviour with fewer pressure cycles. Specimens aged 50–70 years had average values of E1/(E4–10), E2/(E4–10) and E3/E(4–10) of 0.814 ± 0.155, 0.944 ± 0.070 and 0.997 ± 0.057, respectively. The corresponding ratios for 80- to 100-year-old corneas were higher at 0.885 ± 0.039, 0.968 ± 0.071 and 1.007 ± 0.042. However, the trend of faster conditioning with age was not statistically significant with p = 0.453, 0.591 and 0.829 for the three ratios, respectively.
Figure 6.

Correlation between the conditioning behaviour and specimen age assessed by comparing the final tangent modulus of the first three cycles, E1 to E3, against the average of the final modulus values obtained over cycles 4–10, E4–10 ((a) y = 0.0014x + 0.7695; (b) y = 0.0006x + 0.9187; (c) y = 0.0000x + 1.0055).
4. Discussion
Various age-related changes in the biomechanics and topography of different ocular components have been reported in the literature. Albon et al. (2000) observed a decrease in both the mechanical compliance and resilience of the human lamina cribrosa with age, and similar observations were made by Krag et al. (1997) in the lens capsule. Strong association was found between the age-related alterations in the optic nerve head and its increased susceptibility to glaucomatous damage (Burgoyne & Downs 2008). The asphericity of both the anterior and posterior corneal surfaces was reported to undergo significant changes with age, leading to a more spherical topography (Lam & Douthwaite 2002) and peripheral thinning (Dubbelman et al. 2006). Stiffening and increased tensile strength of the sclera were also found to be strongly associated with age (Avetisov et al. 1983; Schultz et al. 2008). Where an explanation was provided for these changes, it was the age-related increase in the intermolecular and intramolecular collagen cross-linking due to non-enzymatic glycosylation, leading to increased stiffness (i.e. reduced compliance) and increased brittleness (i.e. reduced resilience) of the tissue. The same explanation was provided for increased stiffness of the aorta (Bruel & Oxlund 1996; Bruel et al. 1998), the cartilage (Bank et al. 1998) and other parts of the human body.
This study was intended to quantify the change in the human cornea's stress–strain behaviour with age. The study used inflation testing as a means of subjecting the corneas to posterior pressure in a similar environment to normal working conditions. The technique maintained tissue hydration on both the anterior and posterior surfaces, kept the cornea intact and applied load that closely simulated IOP. However, providing the cornea with a pinned edge in inflation testing had its pros and cons. On the one hand, a pinned edge was not an exact representation of the cornea's connection with the sclera, as it assumed the sclera to be stiff enough to prevent all deformation along the limbus. On the other hand, the use of a pinned edge made possible the mathematical analysis needed to derive the material properties from the test results as there is no answer yet for the mathematical problem of representing the geometry of the whole eye globe especially at the corneo-scleral connection.
The mathematical analysis used to derive the stress–strain behaviour from the pressure-rise test results was therefore an essential component of inflation testing. It turned inflation testing into a quantitative technique suitable for determining the stress–strain relationship, which can then be implemented in numerical simulations. However, the analysis was built on a number of assumptions that require careful assessment. The first assumption of material homogeneity meant that the analysis did not take into account the variation of material stiffness expected between the corneal epithelium, endothelium and stroma (Elsheikh et al. 2008a), the probable effect of increased interweaving in anterior stroma (Radner et al. 1998) and the mechanical anisotropy caused by the collagen fibres' preferential orientation in the vertical and horizontal directions (Meek & Boote 2004). For these reasons, the analysis is expected to produce average behaviour of intact corneas, and should only be considered suitable for numerical simulations involving the cornea as a whole. The analysis also adopted an idealization of the cornea's elliptical topography and non-uniform thickness and assumed instead that it had a uniform, spherical shape. This idealization, which was necessary because of the need to adopt an easily definable topography in the analysis, would be expected to lead to some inaccuracies in the resulting stress–strain relationships.
The stress–strain results show clear stiffening effect associated with increased age. The average increase in material stiffness (as measured by the tangent modulus, E) at a strain of 0.01 ranged between 15 and 20 per cent per decade within the first loading cycle, and between 7 and 11 per cent within the fourth cycle. Increased stiffness could result from age-related changes in corneal microstructure as well as changes in collagen fibril strength. For example, between the ages of 40 and 80, collagen fibril diameters increase (Daxer et al. 1998) and collagen centre-to-centre interfibrillar spacings decrease (Malik et al. 1992) and this leads to an increase in the fibril volume fraction. Both theoretically (Boote et al. 2005) and experimentally (Goh et al. 2008) fibril volume fraction has been shown to be directly proportional to the elastic modulus. Using the data in Daxer et al. (1998) and Malik et al. (1992) and the methodology described in Meek & Leonard (1993) the volume fraction per unit fibril length can be shown to increase from about 0.25 (age 40) to 0.29 (age 80), an increase of 16 per cent. This therefore suggests that up to 16 per cent of the observed stiffness increase over these four decades can be attributed to changes in microstructure. The rest is probably accounted for by an increase in the elastic modulus of the constituent collagen fibrils, probably caused by cross-linking. The rate of increase in stiffness displayed a nonlinear trend, and was greater at the high end of the age range considered. Changes in volume fraction appear to be linear (though the published diameter and interfibrillar spacing data show considerable scatter). There are very few published measurements of the degree of corneal cross-linking as a function of age, though it is known that there are considerable age-related changes in both the type and the amount of cross-linking (Yamauchi et al. 1996).
Comparisons of conditioning behaviour provided another overview of the age-related changes in corneal behaviour. In earlier uniaxial strip tension tests, conditioning was expected to have a two-fold effect: induce a change in collagen fibres' alignment towards the load direction and stabilize the effect of viscoelasticity. In the present inflation testing, as the tissue is loaded similar to in vivo conditions, no change in the fibres' orientation would be expected, and conditioning in this case would only act to stabilize the viscoelasticity effect. The fact that older corneas stabilized their behaviour under fewer conditioning cycles than younger corneas was therefore an indication of the effect of age (and the associated increase in cross-linking) in reducing the significance of the tissue's viscoelasticity. This effect is compatible with the findings of earlier experimental studies in which corneal creep, stress-relaxation and hysteresis—all characteristics of viscoelastic behaviour—were found to decrease with age (Elsheikh et al. 2008b,c).
The loading regime adopted in this study was similar to those followed by Zeng et al. (2001), Danielsen (2004), Schultz et al. (2008) and Girard et al. (2009) in which no recovery time was allowed between the conditioning and loading cycles. However, it is recognized that other studies, including Boyce et al. (2008), introduced a different loading regime incorporating recovery between loading tests, and this change could have an effect on the obtained behaviour. In particular it has been argued that without recovery time the behaviour is probably affected by the strain history of preconditioning cycles (Carew et al. 2000). In appreciation of the potential importance of this effect, further tests will be conducted in which variations in the loading regime will be introduced and their effects on the obtained behaviour assessed.
Finally, a note should be made that the cornea's well-known viscoelasticity would mean that the stress–strain equations presented herein be suitable only for the rate of loading used in the experimental programme. It would therefore be expected that the tissue would exhibit higher or lower stiffness if the rate of loading would, respectively, increase or decrease. Work is now progressing to quantify the effect of changes in loading rate on the stress–strain behaviour, and the results of this work should be considered in the future selection of a stress–strain relationship for a particular modelling application.
References
- Aghaian E., Choe J. E., Lin S., Stamper R. L. 2004. Central corneal thickness of Caucasians, Chinese, Hispanics, Filipinos, African Americans, and Japanese in a glaucoma clinic. Ophthalmology 111, 2211–2219. ( 10.1016/j.ophtha.2004.06.013) [DOI] [PubMed] [Google Scholar]
- Alastrue V., Calvo B., Pena E., Doblare M. 2006. Biomechanical modeling of refractive corneal surgery. J. Biomech. Eng. 128, 150–160. ( 10.1115/1.2132368) [DOI] [PubMed] [Google Scholar]
- Albon J., Purslow P. P., Karwatowski W. S., Easty D. L. 2000. Age related compliance of the lamina cribrosa in human eyes. Br. J. Ophthalmol. 84, 318–323. ( 10.1136/bjo.84.3.318) [DOI] [PMC free article] [PubMed] [Google Scholar]
- Amato D., Oddone F., Nubile M., Colabelli-Gisoldi R. A. M., Villani C. M., Pocobelli A. In press Precut donor tissue for Descemet stripping automated keratoplasty: anterior hinged lamella on versus off. Br. J. Ophthalmol. ( 10.1136/bjo.2009.161158) [DOI] [PubMed] [Google Scholar]
- Anderson K., Elsheikh A., Newson T. 2004. Application of structural analysis to the mechanical behaviour of the cornea. J. R. Soc. Interface 1, 3–15. ( 10.1098/rsif.2004.0002) [DOI] [PMC free article] [PubMed] [Google Scholar]
- Avetisov E. S., Savitskaya N. F., Vinetskaya M. I., Iomdina E. N. 1983. A study of biochemical and biomechanical qualities of normal and myopic eye sclera in humans of different age groups. Metab. Pediatr. Syst. Ophthalmol. 7, 183–188. [PubMed] [Google Scholar]
- Bank R. A., Bayliss M. T., Lafeber F. P., Maroudas A., Tekoppele J. M. 1998. Ageing and zonal variation in post-translational modification of collagen in normal human articular cartilage. The age-related increase in non-enzymatic glycation affects biomechanical properties of cartilage. Biochem. J. 330, 345–351. [DOI] [PMC free article] [PubMed] [Google Scholar]
- Boote C., Dennis S., Huang Y., Quantock A. J., Meek K. M. 2005. Lamellar orientation in human cornea in relation to mechanical properties. J. Struct. Biol. 149, 1–6. ( 10.1016/j.jsb.2004.08.009) [DOI] [PubMed] [Google Scholar]
- Boote C., Hayes S., Young R. D., Kamma-Lorger C. S., Hocking P. M., Elsheikh A., Inglehearn C. F., Ali M., Meek K. M. 2009. Ultrastructural changes in the retinopathy, globe enlarged (rge) chick cornea. J. Struct. Biol. 166, 195–204. ( 10.1016/j.jsb.2009.01.009) [DOI] [PMC free article] [PubMed] [Google Scholar]
- Boyce B. L., Grazier J. M., Jones R. E., Nguyen T. D. 2008. Full-field deformation of bovine cornea under constrained inflation conditions. Biomaterials 29, 3896–3904. ( 10.1016/j.biomaterials.2008.06.011) [DOI] [PubMed] [Google Scholar]
- Bruel A., Oxlund H. 1996. Changes in biomechanical properties, composition of collagen and elastin, and advanced glycation endproducts of the rat aorta in relation to age. Atherosclerosis 127, 155–165. ( 10.1016/S0021-9150(96)05947-3) [DOI] [PubMed] [Google Scholar]
- Bruel A., Ortoft G., Oxlund H. 1998. Inhibition of cross-links in collagen is associated with reduced stiffness of the aorta in young rats. Atherosclerosis 140, 135–145. ( 10.1016/S0021-9150(98)00130-0) [DOI] [PubMed] [Google Scholar]
- Bryant M. R., Mcdonnell P. J. 1996. Constitutive laws for biomechanical modeling of refractive surgery. J. Biomech. Eng. 118, 473–481. ( 10.1115/1.2796033) [DOI] [PubMed] [Google Scholar]
- Burgoyne C. F., Downs J. C. 2008. Premise and prediction—how optic nerve head biomechanics underlies the susceptibility and clinical behavior of the aged optic nerve head. J. Glaucoma 17, 318–328. ( 10.1097/IJG.0b013e31815a343b) [DOI] [PMC free article] [PubMed] [Google Scholar]
- Carew E. O., Barber J. E., Vesely I. 2000. Role of preconditioning and recovery time in repeated testing of aortic valve tissues: validation through quasilinear viscoelastic theory. Ann. Biomed. Eng. 28, 1093–1100. ( 10.1114/1.1310221) [DOI] [PubMed] [Google Scholar]
- Caroline P. J. 2001. Contemporary orthokeratology. Cont. Lens Anterior Eye 24, 41–46. ( 10.1016/S1367-0484(01)80008-4) [DOI] [PubMed] [Google Scholar]
- Coster D. 2001. Cornea. London, UK: BMJ Publishing Group. [Google Scholar]
- Danielsen C. C. 2004. Tensile mechanical and creep properties of Descemet's membrane and lens capsule. Exp. Eye Res. 79, 343–350. ( 10.1016/j.exer.2004.05.014) [DOI] [PubMed] [Google Scholar]
- Daxer A., Misof K., Grabner B., Ettl A., Fratzl P. 1998. Collagen fibrils in the human corneal stroma: structure and aging. Invest. Ophthalmol. Vis. Sci. 39, 644–648. [PubMed] [Google Scholar]
- Dubbelman M., Sicam V. A., van der Heijde G. L. 2006. The shape of the anterior and posterior surface of the aging human cornea. Vis. Res. 46, 993–1001. ( 10.1016/j.visres.2005.09.021) [DOI] [PubMed] [Google Scholar]
- Elsheikh A., Wang D., Brown M., Rama P., Campanelli M., Pye D. 2007a. Assessment of corneal biomechanical properties and their variation with age. Curr. Eye Res. 32, 11–19. ( 10.1080/02713680601077145) [DOI] [PubMed] [Google Scholar]
- Elsheikh A., Wang D., Pye D. 2007b. Determination of the modulus of elasticity of the human cornea. J. Refract. Surg. 23, 808–818. [DOI] [PubMed] [Google Scholar]
- Elsheikh A., Alhasso D., Rama P. 2008a. Assessment of the epithelium's contribution to corneal biomechanics. Exp. Eye Res. 86, 445–451. ( 10.1016/j.exer.2007.12.002) [DOI] [PubMed] [Google Scholar]
- Elsheikh A., Alhasso D., Rama P. 2008b. Biomechanical properties of human and porcine corneas. Exp. Eye Res. 86, 783–790. ( 10.1016/j.exer.2008.02.006) [DOI] [PubMed] [Google Scholar]
- Elsheikh A., Wang D., Rama P., Campanelli M., Garway-Heath D. 2008c. Experimental assessment of human corneal hysteresis. Curr. Eye Res. 33, 205–213. ( 10.1080/02713680701882519) [DOI] [PubMed] [Google Scholar]
- Fernandez D. C., Niazy A. M., Kurtz R. M., Djotyan G. P., Juhasz T. 2006. A finite element model for ultrafast laser-lamellar keratoplasty. Ann. Biomed. Eng. 34, 169–183. ( 10.1007/s10439-005-9014-3) [DOI] [PubMed] [Google Scholar]
- Friedenwald J. 1937. Contribution to the theory and practice of tonometry. Am. J. Ophthalmol. 20, 985–1024. [Google Scholar]
- Girard M. J., Suh J. K., Bottlang M., Burgoyne C. F., Downs J. C. 2009. Scleral biomechanics in the aging monkey eye. Invest. Ophthalmol. Vis. Sci. 50, 5226–5237. ( 10.1167/iovs.08-3363) [DOI] [PMC free article] [PubMed] [Google Scholar]
- Goh K. L., Holmes D. F., Lu H. Y., Richardson S., Kadler K. E., Purslow P. P., Wess T. J. 2008. Ageing changes in the tensile properties of tendons: influence of collagen fibril volume fraction. J. Biomech. Eng. 130, 021011 ( 10.1115/1.2898732) [DOI] [PubMed] [Google Scholar]
- Kanai A., Kaufman H. E. 1973. Electron microscopic studies of corneal stroma: aging changes of collagen fibers. Ann. Ophthalmol. 5, 285–287. [PubMed] [Google Scholar]
- Klein B. E., Klein R., Linton K. L. 1992. Intraocular pressure in an American community. The Beaver Dam eye study. Invest. Ophthalmol. Vis. Sci. 33, 2224–2228. [PubMed] [Google Scholar]
- Kokott W. 1938. Über mechanisch-funktionelle Strukturen des Auges. Albrecht versus Grafes. Arch. Ophthalmol. 118, 424–485. [Google Scholar]
- Komai Y., Ushiki T. 1991. The three-dimensional organization of collagen fibrils in the human cornea and sclera. Invest. Ophthalmol. Vis. Sci. 32, 2244–2258. [PubMed] [Google Scholar]
- Kotecha A., White E. T., Shewry J. M., Garway-Heath D. F. 2005. The relative effects of corneal thickness and age on Goldmann applanation tonometry and dynamic contour tonometry. Br. J. Ophthalmol. 89, 1572–1575. ( 10.1136/bjo.2005.075580) [DOI] [PMC free article] [PubMed] [Google Scholar]
- Kothe A. C. 1994. The effect of posture on intraocular pressure and pulsatile ocular blood flow in normal and glaucomatous eyes. Surv. Ophthalmol. 38, S191–S197. ( 10.1016/0039-6257(94)90066-3) [DOI] [PubMed] [Google Scholar]
- Krag S., Olsen T., Andreassen T. T. 1997. Biomechanical characteristics of the human anterior lens capsule in relation to age. Invest. Ophthalmol. Vis. Sci. 38, 357–363. [PubMed] [Google Scholar]
- Lam A., Douthwaite W. A. 2002. The ageing effect on the central posterior corneal radius. Ophthal. Physiol. Opt. 20, 63–69. ( 10.1046/j.1475-1313.2000.00469.x) [DOI] [PubMed] [Google Scholar]
- Leske M. C., Connell A. M., Wu S. Y., Hyman L., Schachat A. P. 1997. Distribution of intraocular pressure. The Barbados Eye Study. Arch. Ophthalmol. 115, 1051–1057. [DOI] [PubMed] [Google Scholar]
- Liu J., Roberts C. J. 2005. Influence of corneal biomechanical properties on intraocular pressure measurement: quantitative analysis. J. Cataract Refract. Surg. 31, 146–155. ( 10.1016/j.jcrs.2004.09.031) [DOI] [PubMed] [Google Scholar]
- Malik N. S., Moss S. J., Ahmed N., Furth A. J., Wall R. S., Meek K. M. 1992. Ageing of the human corneal stroma: structural and biochemical changes. Biochim. Biophys. Acta 1138, 222–228. [DOI] [PubMed] [Google Scholar]
- McMonnies C. W. 2007. Abnormal rubbing and keratectasia. Eye Contact Lens 33, 265–271. ( 10.1097/ICL.0b013e31814fb64b) [DOI] [PubMed] [Google Scholar]
- McMonnies C. W. 2008. Management of chronic habits of abnormal eye rubbing. Cont. Lens Anterior Eye 31, 95–102. ( 10.1016/j.clae.2007.07.008) [DOI] [PubMed] [Google Scholar]
- Meek K. M., Boote C. 2004. The organization of collagen in the corneal stroma. Exp. Eye Res. 78, 503–512. ( 10.1016/j.exer.2003.07.003) [DOI] [PubMed] [Google Scholar]
- Meek K. M., Leonard D. W. 1993. Ultrastructure of the corneal stroma: a comparative study. Biophys. J. 64, 273–280. ( 10.1016/S0006-3495(93)81364-X) [DOI] [PMC free article] [PubMed] [Google Scholar]
- Muller L. J., Pels E., Schurmans L. R., Vrensen G. F. 2004. A new three-dimensional model of the organization of proteoglycans and collagen fibrils in the human corneal stroma. Exp. Eye Res. 78, 493–501. ( 10.1016/S0014-4835(03)00206-9) [DOI] [PubMed] [Google Scholar]
- Orssengo G. J., Pye D. C. 1999. Determination of the true intraocular pressure and modulus of elasticity of the human cornea in vivo. Bull. Math. Biol. 61, 551–572. ( 10.1006/bulm.1999.0102) [DOI] [PubMed] [Google Scholar]
- Parry D. A., Craig A. S. 1979. Electron microscope evidence for an 80 A unit in collagen fibrils. Nature 282, 213–215. ( 10.1038/282213a0) [DOI] [PubMed] [Google Scholar]
- Pocobelli A., Amato D., Ducoli P. In press A new storage medium for pre-cut donor tissue for DSAEK in eye bank. Acta Ophthalmol. 87 ( 10.1111/j.1755-3768.2009.2273.x) [DOI] [Google Scholar]
- Radner W., Zehetmayer M., Aufreiter R., Mallinger R. 1998. Interlacing and cross-angle distribution of collagen lamellae in the human cornea. Cornea 17, 537–543. [DOI] [PubMed] [Google Scholar]
- Rochtchina E., Mitchell P., Wang J. J. 2002. Relationship between age and intraocular pressure: the Blue Mountains eye study. Clin. Exp. Ophthalmol. 30, 173–175. ( 10.1046/j.1442-9071.2002.00519.x) [DOI] [PubMed] [Google Scholar]
- Schultz D. S., Lotz J. C., Lee S. M., Trinidad M. L., Stewart J. M. 2008. Structural factors that mediate scleral stiffness. Invest. Ophthalmol. Vis. Sci. 49, 4232–4236. ( 10.1167/iovs.08-1970) [DOI] [PubMed] [Google Scholar]
- Swarbrick H. A. 2006. Orthokeratology review and update. Clin. Exp. Optom. 89, 124–143. ( 10.1111/j.1444-0938.2006.00044.x) [DOI] [PubMed] [Google Scholar]
- Tonnu P. A., Ho T., Newson T., El Sheikh A., Sharma K., White E., Bunce C., Garway-Heath D. 2005. The influence of central corneal thickness and age on intraocular pressure measured by pneumotonometry, non-contact tonometry, the Tono-Pen XL, and Goldmann applanation tonometry. Br. J. Ophthalmol. 89, 851–854. ( 10.1136/bjo.2004.056622) [DOI] [PMC free article] [PubMed] [Google Scholar]
- Uchio E., Ohno S., Kudoh J., Aoki K., Kisielewicz L. T. 1999. Simulation model of an eyeball based on finite element analysis on a supercomputer. Br. J. Ophthalmol. 83, 1106–1111. ( 10.1136/bjo.83.10.1106) [DOI] [PMC free article] [PubMed] [Google Scholar]
- Yamauchi M., Chandler G. S., Tanzawa H., Katz E. P. 1996. Cross-linking and the molecular packing of corneal collagen. Biochem. Biophys. Res. Commun. 219, 311–315. ( 10.1006/bbrc.1996.0229) [DOI] [PubMed] [Google Scholar]
- Zeng Y., Yang J., Huang K., Lee Z., Lee X. 2001. A comparison of biomechanical properties between human and porcine cornea. J. Biomech. 34, 533–537. ( 10.1016/S0021-9290(00)00219-0) [DOI] [PubMed] [Google Scholar]