Abstract
Background
Post-stenting ischemic events occur despite dual antiplatelet therapy suggesting that a “one size fits all” antithrombotic strategy has significant limitations. Ex vivo platelet function measurements may facilitate risk stratification and personalized antiplatelet therapy.
Methods
We investigated the prognostic utility of the strength of ADP-induced (MAADP) and thrombin-induced (MATHROMBIN) platelet-fibrin clots measured by thrombelastography and ADP-induced light transmittance aggregation (LTAADP) in 225 serial patients following elective stenting treated with aspirin and clopidogrel. Ischemic and bleeding events were assessed over three-years.
Results
Overall, 59 (26 %) first ischemic events occurred. Patients with ischemic events had higher MAADP, MATHROMBIN, and LTAADP (p<0.0001 for all comparisons). By receiver operating characteristic curve analysis, MAADP > 47mm had the best predictive value of long-term ischemic events compared to other measurements (p<0.0001) with an area under the curve = 0.84 [95% CI 0.78 – 0.89, p < 0.0001]. The univariate Cox proportional hazards model identified MAADP >47mm, MATHROMBIN >69mm, and LTA ADP >34% as significant independent predictors of first ischemic events at the three-year time point, with hazard ratios of 10.3 (p<0.0001), 3.8 (p<0.0001), and 4.8 (p<0.0001) respectively. Fifteen bleeding events occurred. Receiver operator characteristic curve and quartile analysis suggest MAADP ≤ 31 as a predictive value for bleeding.
Conclusion
This study is the first demonstration of the prognostic utility of MAADP in predicting long term event occurrence following stenting. The quantitative assessment of ADP-stimulated platelet-fibrin clot strength measured by thrombelastography can serve as a future tool in investigations of personalized antiplatelet treatment designed to reduce ischemic events and bleeding.
INTRODUCTION
Ischemic events following percutaneous coronary intervention (PCI) are influenced by platelet activation and thrombin generation.1,2 Antiplatelet therapy with clopidogrel and aspirin is the current standard of care for patients undergoing PCI. Despite the proven benefits of adding clopidogrel to aspirin therapy, a significant percentage of patients will experience both short and long term post-stenting ischemic events suggesting that the current “one size fits all” dosing strategy has significant limitations.3
The existing treatment paradigm of dual antiplatelet therapy is based on the results of prospective, randomized large scale clinical trials that did not include concomitant assessments of platelet function.3 Currently, a uniform dosing and duration of antiplatelet treatment is recommended irrespective of the individual patient's response to antiplatelet therapy. The later approach is based on the inherent assumption that all post-stenting patients have the same level of antiplatelet response and hemostasis. The limitations of the latter approach have been revealed by demonstration of wide variability in clopidogrel responsiveness in multiple pharmacodynamic studies.4 At one end of the spectrum, selected patients with excessively low on-treatment platelet reactivity may have unnecessary bleeding, whereas patients with high platelet reactivity may experience ischemic events. Subsequently, an increasing body of translational research data has demonstrated a strong relation of high on-treatment platelet reactivity primarily measured by conventional light transmittance aggregometry after stimulation by adenosine diphosphate (LTAADP) to post-stenting ischemic event occurrence.4
A previous report demonstrated that high thrombin-induced platelet-fibrin clot strength (MATHROMBIN) measured by thrombelastography (TEG) and high LTAADP were risk factors for 6-month post- PCI ischemic events. In that study MATHROMBIN was a better risk discriminator.5 Herein we report the results of a new long-term follow-up study where we measured ADP-induced platelet-fibrin clot strength (MAADP) by the TEG Platelet Mapping assay in addition to MATHROMBIN and LTAADP and compared their association with post-PCI ischemic event occurrence with the aim of future use of these tests to personalize antiplatelet therapy.
METHODS
Patients
The study was approved by the Investigational Review Board of Sinai Hospital, Baltimore, Maryland. Two hundred twenty-five consecutive patients undergoing non-emergent PCI were prospectively enrolled between 2004 and 2005 after providing informed consent. All patients were older than 18 years of age. Inclusion and exclusion criteria were described previously.5 Aspirin (325 mg) was administered to all patients on the day of the procedure and daily thereafter (81-325 mg). Sixty-six percent of the patients received a 300 mg (n=73) or 600 mg (n=75 ) clopidogrel loading dose immediately following successful PCI, with a 75 mg/day maintenance dose thereafter. Patients on a maintenance dose of clopidogrel (75 mg/day) at the time of admission (n=77) did not receive a loading dose. Eptifibatide was administered to 123 patients. Unfractionated heparin was administered to all patients during the procedure to achieve a clotting time of 200-250 sec for patients administered a GPIIb/IIIa inhibitor, and >300 sec for all other patients.
Blood samples were obtained at 18-24 hours post-PCI; an additional sample was collected 5 days post-PCI in patients treated with eptifibatide. In those patients not treated with eptifibatide, measurements from the 18-24 hours sample were correlated with clinical outcomes, whereas in those patients treated with eptifibatide, the measurements from day 5 were used in the analysis. In patients experiencing bleeding, an additional blood sample was obtained at or close to the time of the bleeding event. We collected three 5 mL vacutainer tubes (Beckton-Dickenson, Franklin Lakes, New Jersey), two containing 3.2% trisodium citrate for light transmittance aggregometry and one containing 40 USP lithium heparin for TEG PlateletMapping analysis.
Platelet –Fibrin Clot Strength Measurement
Platelet-fibrin clot strength measurements were carried out using the Thrombelastograph® (TEG® Hemostasis System, Haemoscope Corporation, Niles, IL). The TEG Hemostasis Analyzer with automated analytical software provides quantitative and qualitative measurements of the physical properties of a clot.5
The TEG technology is described elsewhere.5,6 Briefly, a stationary pin is suspended into an oscillating cup that contains the whole blood sample. As the blood clots, it links the pin to the cup. Clot strength is determined by measuring the amplitude of the rotation of the pin, which increases proportionally with clot strength. Maximum amplitude represents maximum clot strength, expressed as the MA parameter.5,6
Light Transmittance Aggregation
Platelets in platelet rich plasma were stimulated with 5μM ADP, and 2mM arachidonic acid (AA) (Chronolog, Havertown, PA). Aggregation was assessed using a Chronolog Lumi-Aggregometer (Model 490-4D) with the Aggrolink software package. Aggregation was expressed as the maximum percent change in light transmittance, using PPP as a reference.5,6
Clinical Endpoints
Patients were followed for the occurrence of adverse events during index hospitalization and for up to 36 months. Patients were contacted either by phone or by office appointment to determine event occurrence and compliance with antiplatelet drug therapy. The primary endpoint was the composite of cardiac death, stent thrombosis, myocardial infarction, ischemic stroke, and unplanned revascularization. First events are reported. Cardiac death was defined as death secondary to any cardiovascular cause. Myocardial infarction was defined as the occurrence of symptoms of myocardial ischemia associated with troponin I values greater than upper limits of normal.7 Stent thrombosis was defined as definite stent thrombosis according to the Academic Research Consortium.8 The secondary endpoint was the composite of major and minor bleeding during the observation period. Bleeding was quantified according to the TIMI criteria.9 Two independent physicians blinded to laboratory data adjudicated events after review of source documents.
Statistical Analysis
Categorical variables are expressed as n (%) and continuous variables as mean ± SD with p<0.05 considered statistically significant. The Fischer Exact test and Mann-Whitney Rank Sum test were used for comparison of categorical variables and Student's t-test was used for comparison of continuous variables between groups. Receiver operator characteristic curve (ROC) analysis (MedCalc software, Mariakerke, Belgium) was performed to identify the best discriminatory level of MATHROMBIN, MAADP, and LTAADP associated with first ischemic events. The predictive values of the three measurements were assessed by ROC comparison analysis. To assess event-free survival, a Kaplan–Meier analysis was performed and the event–time data are reported in two curves according to the cutpoint of each platelet function parameter, determined by ROC analysis. Univariate comparisons between patients with and without ischemic events were performed using the chi-square test, Mann–Whitney U test, or Student t test as appropriate. Demographic and procedural variables with P values below 0.1 in the univariate analysis were entered by stepwise forward selection in a multivariate Cox proportional hazards model (SAS software, Cary, NC).
Sample Size Calculation
A recent study demonstrated that ~20% of patients undergoing PCI will experience death or repeat revascularization within 3 years and it has been demonstrated that patients with high platelet reactivity have greater event frequency with adjusted hazard ratios reported at least 3.0.10-11 We hypothesized an ~ 25% incidence of ischemic events in patients with high platelet reactivity as compared to 10% incidence in patients with normal platelet reactivity. Using the sample size calculation from SigmaStat software (SigmaStat,Systat software, Inc., San Jose, CA), it was estimated that the sample size required for 90% power with the alpha of 0.05, and a 5% drop out was ~ 225 patients.
The authors had full access to and take full responsibility for the integrity of the data. All authors have read and agree to the manuscript as written.
RESULTS
Demographic and Procedural Characteristics
Two hundred twenty-five patients undergoing PCI were enrolled. Fifty-nine patients (26%) sustained an ischemic event within three years after the index PCI. Patient demographics and procedural characteristics are shown in Tables 1 and 2, respectively. Briefly, patients with ischemic events had a higher prevalence of hyperlipidemia, diabetes, prior PTCA, calcium channel blocker usage, and had lower ejection fraction as compared to patients without ischemic event. Patients within the ischemic group had more complex disease, smaller vessel diameter, and more implanted stents.
Table 1.
Patient Characteristics
| Total Group (n=225) |
Ischemic Group (n=59) |
Non- Ischemic Group (n=166) |
p-value | |
|---|---|---|---|---|
| Age (years) | 66 ±12 | 66 ±12 | 64 ± 11 | 0.24 |
| Gender and Ethnicity n, (%) | ||||
| Caucasian male | 121 (54) | 30 (48) | 91 (55) | 0.18 |
| Caucasian female | 44 (20) | 14 (22) | 30 (18) | 0.25 |
| African American male | 30 (13) | 8 (13) | 22 (13) | 1.0 |
| African American female | 30 (13) | 7 (11) | 23 (14) | 0.28 |
| BMI (kg/m2) | 29 ± 7 | 30 ± 6 | 29 ± 7 | 0.30 |
| Systolic BP (mmHg) | 144 ± 25 | 144 ± 21 | 146 ± 24 | 0.57 |
| Diastolic BP (mmHg) | 75 ± 17 | 75 ± 16 | 76 ± 17 | 0.69 |
| Presentation n, (%) | ||||
| Elective | 159 (71) | 44 (75) | 115 (69) | 0.19 |
| Unstable Angina | 50 (22) | 12 (20) | 38 (22) | 0.37 |
| Myocardial Infarction | 16 (7) | 3 (5) | 13 (8) | 0.22 |
|
Risk Factors/Past Medical History n, (%) |
||||
| Smoking | 124 (55) | 31 (52) | 93 (56) | 0.29 |
| Family history of CAD | 106 (48) | 31 (52) | 75 (47) | 0.25 |
| Hypertension | 167 (74) | 47 (79) | 118 (72) | 0.25 |
| Hyperlipidemia | 179 (80) | 52 (89) | 127 (77) | 0.02 |
| Diabetes | 87 (41) | 33 (56) | 60 (36) | 0.004 |
| Peripheral Vascular Disease | 19 (8) | 6 (10) | 13 (8) | 0.32 |
| Prior Myocardial Infarction | 75 (33) | 22 (37) | 53 (32) | 0.24 |
| Prior CABG | 54 (24) | 14 (23) | 40 (24) | 0.44 |
| Prior PTCA | 79 (35) | 27 (47) | 52 (31) | 0.01 |
| Prior CVA | 27 (12) | 5 (9) | 22 (13) | 0.21 |
| Baseline Medications n, (%) | ||||
| Beta blockers | 190 (84) | 49 (83) | 141 (85) | 0.36 |
| ACE inhibitors | 146 (65) | 38 (65) | 108 (65) | 1.0 |
| Calcium channel blockers | 59 (26) | 23 (39) | 36 (22) | 0.005 |
| Lipid lowering agents | 184 (82) | 50 (85) | 134 (81) | 0.45 |
| PPI | 76 (34) | 21 (36) | 55 (33) | 0.34 |
| Laboratory Data | ||||
| WBC (× 1000/mm3) | 7.8 ± 3.0 | 8.6 ± 3.8 | 7.5 ± 2.4 | 0.12 |
| Platelets (× 1000/mm3) | 231 ± 71 | 239 ± 69 | 228 ± 70 | 0.29 |
| Hemoglobin (g/dL) | 13.4 ± 2.0 | 13.0 ± 1.9 | 13.5 ± 2.1 | 0.10 |
| Hematocrit (%) | 39.9 ± 5.2 | 39.4 ± 5.0 | 40.1 ± 5.3 | 0.37 |
| Creatinine (g/dL) | 1.1 ± 0.5 | 1.1 ± 0.5 | 1.1 ± 0.6 | 1.0 |
ACE=angiotensin converting enzyme; BMI=body mass index; CABG=coronary artery bypass graft surgery; CAD=coronary artery disease; CVA=cerebrovascular accident; PTCA=percutaneous transluminal coronary angioplasty; WBC=white blood cells: PPI=proton pump inhibitors.
Table 2.
Procedural Characteristics
| Total Group (n=225) |
Ischemic Group (n=59) |
Non- Ischemic Group (n=166) |
p-value | |
|---|---|---|---|---|
| Length of procedure (min.) | 60 ± 32 | 56 ± 27 | 59 ± 33 | 0.52 |
| Ejection fraction (%) | 53 ± 38 | 49 ± 11 | 55 ± 15 | 0.005 |
| Number of vessels treated | 1.3 ± 0.6 | 1.4 ± 0.6 | 1.3 ± 0.5 | 0.21 |
|
Culprit Lesion Morphology n, (%) |
||||
| De novo | 200 (88) | 50 (85) | 150 (90) | 0.15 |
| Restenotic | 25 (12) | 9 (15) | 16 (10) | 0.15 |
| Bifurcation lesion, Severe Calcification, Evidence of Thrombus, or Total Occlusion |
22 (10) | 10 (17) | 12 (7) | 0.01 |
| ACC/AHA Lesion Score n, (%) |
||||
| Type A | 19 (8) | 4 (7) | 15 (9) | 0.32 |
| Type B1 | 65 (29) | 13 (22) | 52 (31) | 0.10 |
| Type B2 | 51 (23) | 13 (22) | 38 (23) | 0.44 |
| Type C | 90 (40) | 29 (49) | 61 (37) | 0.05 |
|
Culprit Lesion Location n, (%) |
||||
| LAD | 77 (34) | 19 (32) | 58 (35) | 0.34 |
| CX | 56 (25) | 11 (19) | 45 (27) | 0.11 |
| RCA | 80 (36) | 26 (44) | 54 (32) | 0.05 |
| SVG | 12 (5) | 3 (5) | 9 (6) | 0.39 |
| Stent Types n, (%) | ||||
| Drug eluting | 169 (75) | 49 (78) | 120 (72) | 0.19 |
| Bare metal | 51 (23) | 11 (25) | 40 (24) | 0.44 |
| PTCA only | 9 (4) | 3 (5) | 6 (4) | 0.37 |
| Reference vessel diameter (mm) |
3.0 ± 0.5 | 2.9 ± 0.4 | 3.1 ± 0.5 | 0.005 |
| Total lesion length (mm) | 22 ± 14 | 21 ± 9 | 22 ± 16 | 0.64 |
| Pre-Dilation n, (%) | 121 (54) | 30 (51) | 91 (55) | 0.29 |
| Post Dilation n, (%) | 109(48) | 32 (54) | 77 (46) | 0.15 |
| Total Stents per patient, n | 1.5 ± 1.0 | 1.7 ± 1.2 | 1.4 ± 0.8 | 0.03 |
| Procedural Success n, (%) | 219 | 58 (98) | 161 (97) | 0.34 |
Cx=circumflex artery; LAD=left anterior descending artery; PTCA=percutaneous transluminal coronary angioplasty; RCA=right coronary artery; SVG=saphenous vein graft ACC/AHA = American College of Cardiology/American Heart Association.
Ischemic Event Occurrence
Two percent of patients had an ischemic event within one month of PCI and 26 % experienced an ischemic event within the three years after the index PCI (Table 3). Twenty-four percent of patients (14/59) had their event after clopidogrel discontinuation with a mean duration of therapy of 6.4 ± 3 months. Ninety-eight percent of ischemic events occurred during aspirin treatment.
Table 3.
First Ischemic Events
| Total Group (n=225) | |||
|---|---|---|---|
| Month < 1 |
Month 1-36 |
Month 0-36 |
|
| Ischemic Events, n (%) | |||
| Cardiac Death | 1 (0.4) | 0 (0.0) | 1 (0.4) |
| Stent Thrombosis | 4 (1.7) | 2 (0.8) | 6 (2.5) |
| Myocardial Infarction | 0 (0.0) | 17 (7.5) | 17 (7.5) |
| Target Vessel Revascularization | 0 (0.0) | 26 (11.6) | 26 (11.6) |
| Non-Target Vessel Revascularization | 0 (0.0) | 9 (4.0) | 9 (4.0) |
| Total Ischemic Events, n (%) | 5 (2.2) | 54 (24.0) | 59 (26.2) |
Association Between Platelet Function Parameters and Adverse Ischemic Events
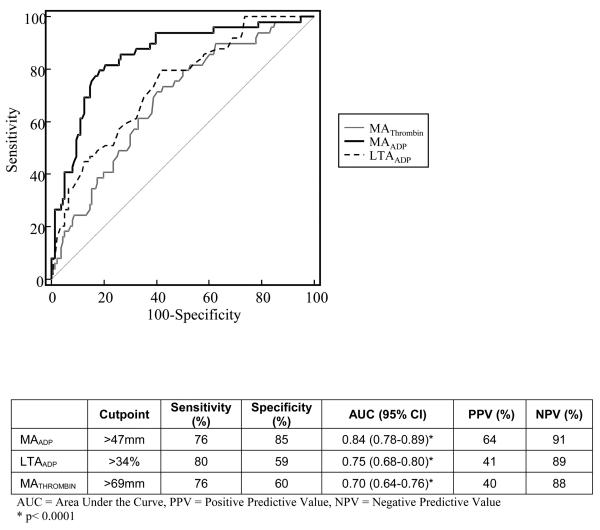
In patients experiencing an ischemic event, measures of thrombin-induced and ADP-induced platelet-fibrin clot strength (MATHROMBIN and MAADP, respectively) were significantly higher than in patients free from ischemic events (Table 4). In contrast, AA-induced platelet-fibrin clot strength (MAAA) was highly inhibited in both groups. The association of platelet function parameters and ischemic events was assessed with receiver operating characteristic (ROC) analysis as shown in Figure 1. In comparison with LTAADP and MATHROMBIN, MAADP had the best predictive value yielding an AUC of 0.84 [95% CI (0.78 – 0.89), p < 0.001 for all comparisons].
Table 4.
Platelet Function Parameters
| Ischemic Group |
Non-Ischemic Group |
p-value | |
|---|---|---|---|
| Thrombelastography (TEG) | |||
| MATHROMBIN (mm) | 72±6 | 67±6 | <0.0001 |
| MAADP (mm) | 51 ± 12 | 35±13 | <0.0001 |
| MAAA (mm) | 18 ± 10 | 15 ± 10 | 0.04 |
| Light Transmittance Aggregation (LTA) | |||
| LTAADP (aggregation, %) | 45 ± 13 | 31±15. | <0.0001 |
ADP = Adenosine diphosphate, AA = Arachidonic acid
Figure 1.
Comparison of receiver operating characteristic curves for MATHROMBIN, MAADP, and LTAADP.
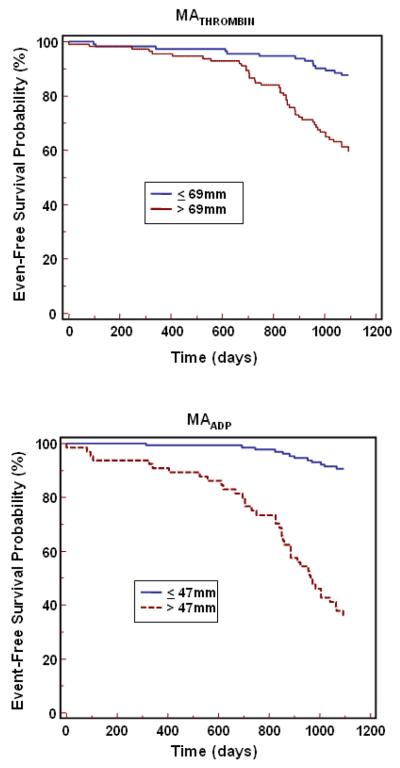
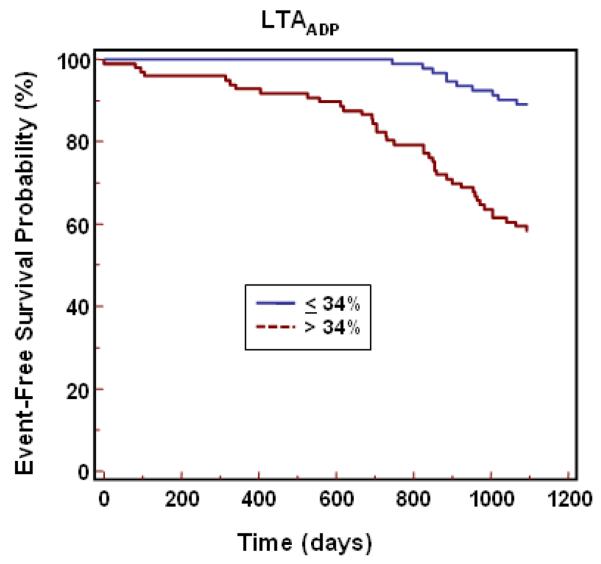
In univariate Cox proportional hazard model analysis using the ROC cut point, MATHROMBIN, LTAADP, and MAADP were associated with a 3.8 (95% CI 2.1-7.0), 4.8 (95% CI 2.4 – 9.6) and 10.3 (95% CI 5.4 – 20.0) -fold relative risk of ischemic event occurrence, respectively (p<0.0001 for each). The occurrence of cardiac events over time is depicted in Kaplan-Meier event-time curves (Figure 2) and demonstrate the association of events to platelet function parameters by cut point (MAADP > 47mm and ≤ 47mm, MATHROMBIN >69mm and ≤ 69mm, and LTAADP >34% and ≤ 34%). The separation of the two curves occurred early, particularly for MAADP. Patients with high platelet function values had a continual increase in ischemic event occurrence over time. In a multivariate Cox proportional hazards model used to identify independent predictors of long term ischemic events, platelet function parameters (MATHROMBIN, LTAADP, and MAADP ) as well as patient and procedural characteristics with a p <0.10 in the univariate analysis were examined (see Tables 1 and 2). When adjusted for patient and procedural covariates, MAADP was independently and significantly associated with adverse ischemic events, with a hazard ratio of 10.9 (95% CI 5.6-21.3) (Table 5). With the exception of MATHROMBIN and calcium channel blockers, all other variables were excluded from the model when MAADP was the platelet function parameter studied.
Figure 2.
Cumulative incidence of first ischemic events (Kaplan Meier) during 3-year follow-up period for platelet function parameters.
Table 5.
Cox-Proportional Hazards Regression
| Covariate | Adjusted HR (95% CI) |
P Value |
|---|---|---|
| MAADP >47mm | 10.9 (5.6 to 21.3) | <0.0001 |
| MATHROMBIN >69 mm | 3.5 (1.9 to 6.4) | <0.0001 |
| Calcium channel blockers | 2.3 (1.2 to 4.1) | 0.008 |
| LTAADP >34% | 5.6 (2.7 to 11.6) | <0.0001 |
| Hx of prior PTCA | 2.1 (1.2 to 3.7) | 0.01 |
| Calcium channel blockers | 2.2 (1.2 to 4.3) | 0.016 |
Each cluster represents analysis of each of the platelet function parameters and covariates (only variables retained by the analysis are shown).
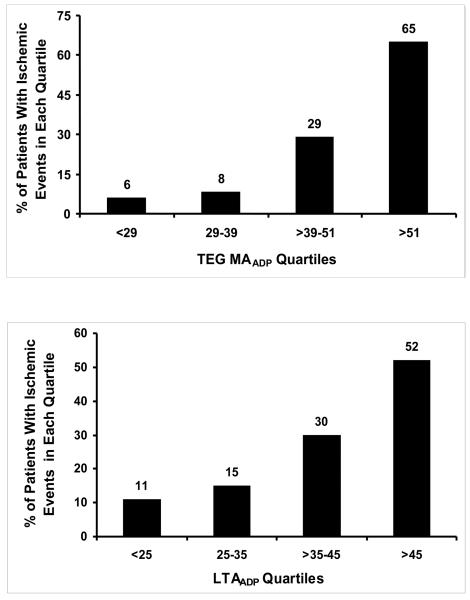
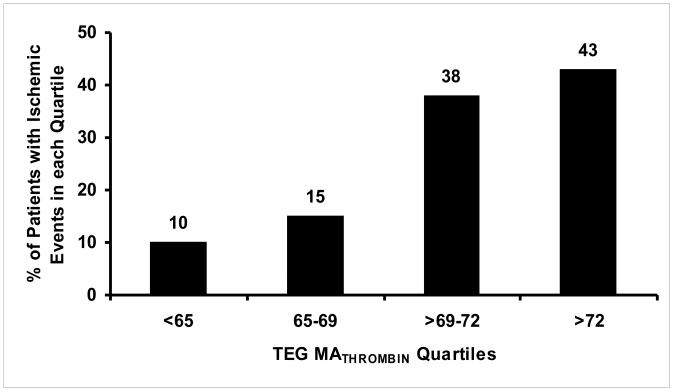
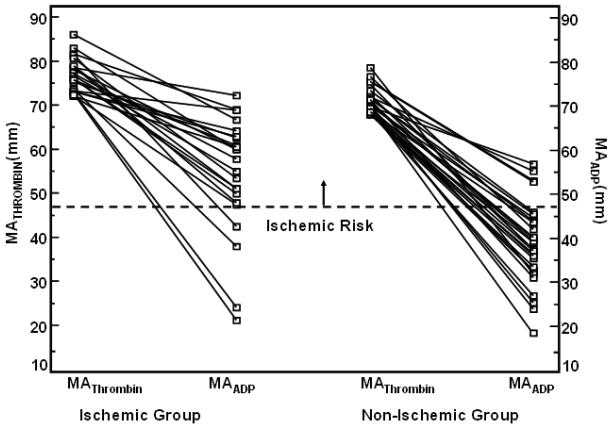
Quartile analysis of the platelet function parameters consistently showed low incidence of ischemic events in the lower quartiles with increasing incidence of ischemic events in higher quartiles of MATHROMBIN MAADP and LTAADP (Figure 5). In the fourth quartile of MATHROMBIN (MATHROMBIN > 72), 43% had ischemic events (Figure 3). Of patients without an ischemic event in the highest MATHROMBIN quartile, 86% had a MAADP equal to or below the cutpoint of 47 mm. In contrast, 81% of patients with an ischemic event had an MAADP above this cutpoint (Figure 4.)
Figure 3.
Quartile distribution of ischemic events for each platelet function parameter.
Figure 4.
Fourth quartile of MATHROMBIN showing MATHROMBIN with corresponding MAADP value for each patient. Left portion displays patients with repeat ischemic events and right portion without ischemic events. Dotted lines indicate cutpoints for ischemic and bleeding risk, and delineate a possible therapeutic range.
Bleeding Events
Fifteen patients experienced a bleeding event; 5 patients had major bleeding and 10 patients had minor bleeding. Eight of the bleeding events occurred during the index hospitalization, and 6 of these patients received a GPIIb/IIIa inhibitor. Four patients had a bleeding event within 30 days after discharge and the remaining 3 patients experienced bleeding between 30 days and 3 years follow-up. In those patients not on GPIIb/IIIa inhibitors there was no difference in any platelet function parameters (data not shown).
Of the six patients treated with a GPIIb/IIIa inhibitor who had a major bleeding event, all had an MAADP value within the first quartile at the time of the bleed. Those patients receiving the same GPIIb/IIIa inhibitor treatment (n=115) who had an MAADP value beyond the first quartile did not bleed. This indicates that the strength of the clot as measured by MAADP, and not the mere presence of a GPIIb/IIIa inhibitor, determines the probability of patient bleeding.
Although the low number of bleeding patients precludes definitive statistical analysis, nevertheless, the data trends warrant consideration. As expected, MAADP measured at or close to the time of the bleed was low, with 83% falling within the first quartile of MAADP. Notably, in the case of major bleeding, all instances fell within the first quartile. In addition, ROC curve analysis for bleeding produced a cutpoint of 31, which approximates the upper limit of the first quartile (Figure 3).
DISCUSSION
Thrombus formation is a dynamic and nonlinear process involving many interacting elements, most notably the vascular wall, blood components, and blood flow. LTA has long been the methodology of choice to determine platelet reactivity. However, our study suggests that the TEG MA parameters, MAADP and MATHROMBIN, provide additional information for post-PCI risk assessment. In vivo, the strength of the clot determines whether it will resist the shear forces of the circulating blood, or impede blood flow and result in an ischemic event. The TEG MA parameters measure the strength of a clot as a direct function of the maximum dynamic properties of fibrin-platelet binding via GPIIb/IIIa and the platelet contractile system (secondary aggregation). Therefore, the TEG MA parameters may better estimate the in vivo situation as compared to LTA, which measures platelet aggregation mediated by fibrinogen (primary aggregation) and ignores the important contribution of platelet-fibrin interactions to both thrombosis and hemorrhage.
The existence of a high level of individual variability in platelet responsiveness to antiplatelet therapy and on-treatment platelet reactivity have been confirmed in the majority of clinical studies examining antiplatelet therapy efficacy in PCI patients.3 Interindividual variability has also been demonstrated in thrombin-generating ability of blood.12 It is widely accepted that ischemic events, particularly post-PCI, are multifactorial processes influenced by clinical, demographic, procedural, and hemostatic components that culminate in a thrombotic expression, i.e., an ischemic event. This study collected information on many of the accepted risk factors, and examined in particular several of the hemostatic components that contribute to and quantify the subjects' prothrombotic state. We were able to identify a set of hemostasis markers by TEG and LTA that were able to risk stratify patients for ischemic events both independently and together. In contrast, we found that few of the standard risk indicators were significantly different between patients with and without ischemic events, and were eliminated in multivariate Cox proportional hazards model analysis in the presence of platelet function measurements. These results indicate that in predicting ischemic events, the incremental contributions of most other variables besides MAADP, MATHROMBIN, and LTAADP are statistically not significant. This was not unexpected, since standard risk factors may predispose a patient for an ischemic event, but it is the patient's hemostasis state that will ultimately determine whether the forming clot can resist the shear forces of the circulating blood and cause the event.
We showed in the PREPARE POST-STENTING study that MATHROMBIN and LTAADP identified patients at high risk for 6 month post-PCI ischemic event occurrence.5 High MATHROMBIN ( >72mm) alone was highly predictive of a recurrent ischemic event. In a study of patients undergoing a variety of non-cardiac surgical procedures, MATHROMBIN was also highly predictive of post-operative ischemic events.13 In our current study of 3-year ischemic event occurrence, MAADP, MATHROMBIN, and LTAADP were all associated with high negative predictive values, with MAADP having the highest specificity (85%, Figure 1).
In the absence of platelet inhibitors, platelets circulating in the vascular system function at maximum potential in any given patient. Maximal platelet reactivity is measured by MATHROMBIN. However, in the presence of platelet inhibitors, circulating platelets are variably inhibited. The MAADP and MAAA indicate the level of platelet reactivity to ADP and COX-1 activity, respectively. The quartile analysis of both MATHROMBIN and MAADP (Figure 3) indicate that patients falling into higher quartiles may require more aggressive antiplatelet therapy to prevent ischemic events, since the incidence of ischemic events increases in each quartile.
Our results indicate that in the presence of platelet ADP inhibition MAADP is a strong predictor of long-term post-PCI ischemic events regardless of how high the level of MATHROMBIN may be (Figure 4), suggesting its potential superiority over LTAADP and MATHROMBIN as a risk assessment tool. The latter also suggests its potential utility to determine individualized therapy. Eighty-seven percent of ischemic events occurred in the third and fourth quartiles of MAADP (Figure 3), which correlates well with the ROC cutpoint. Consequently, we propose the MAADP cutpoint (47mm) as the upper limit of a therapeutic target for this population. A lower limit of MAADP to define a potential therapeutic window will require a much larger study, though the presence of bleeding in the lowest quartile and the absence of bleeding in higher quartiles suggests a lower therapeutic limit of approximately 30mm, which delimits the first quartile of MAADP and corresponds to the ROC cutpoint for the MAADP taken at the time of the bleed (Figure 4). Thus, for the first time, using the bleeding cutpoint of 31 and the ischemic cutpoint of 47, a therapeutic range of 31 to 47 for MAADP can be proposed, providing maximum efficacy and safety. This is in contrast to the results of the prospective POPULAR study which demonstrated that the LTA, VerifyNow P2Y12, and Plateletworks platelet function tests were also able to identify patients at higher risk for ischemic events, but none of the tests were able to identify patients at risk for TIMI major and minor bleeding.14
MATHROMBIN reflects the patient's maximal potential platelet reactivity and MAADP reflects platelet reactivity to ADP and assesses the individual patient's response to antiplatelet therapy. MAADP is partially determined by MATHROMBIN since MATHROMBIN represents the upper boundary of platelet reactivity. Therefore, if MATHROMBIN is low or normal, MAADP must also be low or normal. Thus, when MATHROMBIN is low or normal, the administration of a potent P2Y12 inhibitor may enhance bleeding risk. On the other hand, if MATHROMBIN is high, given the wide response variability to clopidogrel, MAADP may be high, normal, or low. The analysis of patients in the fourth quartile of MATHROMBIN with respect to MAADP suggests the important role of platelet reactivity to ADP in determining ischemic event occurrence in these patients (Figure 4).
With this in mind, when considering the ACC/AHA PCI Guidelines for dosing and duration of post-stenting antiplatelet therapy, two areas of concern arise. First, the notion that a “one size fits all” dosing of antiplatelet drugs is the appropriate treatment for a given PCI patient is flawed. The inter-individual variability in on-treatment platelet reactivity during clopidogrel treatment confirmed by multiple prior studies predominantly utilizing LTA is now confirmed by another measurement, MAADP. Second, the implication of the Guidelines is that hemostasis is “time dependent” and that discontinuing therapy based on a fixed elapsed time after intervention, is inappropriate. Our results demonstrate that a range of maximal platelet-fibrin clot strength exists, and that 50% of patients (two highest quartiles for MATHROMBIN) are at high risk for post-stenting ischemic events. Thus, when P2Y12 blocking therapy is discontinued in this group, a high event rate would also be expected (Figure 3 [MATHROMBIN quartiles]). Therefore, our data suggest that investigations designed to assess the safety of P2Y12 inhibitor therapy cessation should also focus on an individual assessment of hemostasis rather than only a uniform elapsed time interval post-intervention. A measurement of native maximal platelet function such as MATHROMBIN, which is uninfluenced by ongoing antiplatelet therapy, is needed for future studies of risk assessment to determine if and when a patient may be safely taken off antiplatelet therapy following stenting.
Limitations
This was an observational study. A prospective study in which patients are treated according to the TEG results is needed to confirm that personalized management of platelet reactivity with antiplatelet drugs is more effective than conventional therapy in reducing the incidence of ischemic events and bleeding.
Conclusions
Management of patients using universal fixed-dosing dual antiplatelet therapy is associated with an unacceptable rate of recurrent events. This study was able to characterize post-PCI patients according to risk for long-term recurrence of ischemic events based on selected TEG PlateletMapping results, specifically MAADP and MATHROMBIN. This is the first study to compare the prognostic utility of conventional aggregometry with TEG for long-term events, and also the first to examine the role of MAADP as a prognostic tool. TEG measures secondary aggregation, whereas all other point-of-care tests and LTA measure primary aggregation, ignoring the contribution of fibrin and platelet contractility in the method. This may explain the increased ability of the TEG to risk stratify. An assessment of platelet-fibrin interactions by TEG, particularly by measurement of MAADP, may facilitate future investigations of personalized antiplatelet treatment designed to reduce post-stenting ischemic events, manage bleeding risk, and determine appropriate cessation of therapy.
Acknowledgments
Sources of Funding The study was supported by the Sinai Hospital of Baltimore, Baltimore, MD and NIH Grant R44-HL059753.
Paul A. Gurbel has received research funding from Astra Zeneca, Daiichi Sankyo, Lilly, Schering-Plough, Pozen, Portola Pharmaceuticals, Bayer Healthcare, Sanofi-Aventis, Haemonetics, and NIH.
Footnotes
Publisher's Disclaimer: This is a PDF file of an unedited manuscript that has been accepted for publication. As a service to our customers we are providing this early version of the manuscript. The manuscript will undergo copyediting, typesetting, and review of the resulting proof before it is published in its final citable form. Please note that during the production process errors may be discovered which could affect the content, and all legal disclaimers that apply to the journal pertain.
Disclosures
Eli Cohen and Irene Navickas are former employees of Haemoscope Corporation.
All other authors report no conflicts of interest.
REFERENCES
- 1.Furie B, Furie BC. Thrombus formation in vivo. J Clin Invest. 2005;115:3355–62. doi: 10.1172/JCI26987. [DOI] [PMC free article] [PubMed] [Google Scholar]
- 2.Lee KW, Lip GY. Acute coronary syndromes: Virchow's triad revisited. BloodCoagul Fibrinolysis. 2003;14:605–25. doi: 10.1097/01.mbc.0000061355.73802.ea. [DOI] [PubMed] [Google Scholar]
- 3.Gurbel PA, Becker RC, Mann KG, et al. Platelet function monitoring in patients with coronary artery disease. J Am Coll Cardiol. 2007;50:1822–34. doi: 10.1016/j.jacc.2007.07.051. [DOI] [PubMed] [Google Scholar]
- 4.Gurbel PA, Antonino MJ, Tantry US. Antiplatelet treatment of cardiovascular disease: a translational research perspective. Pol Arch Med Wewn. 2008;118:289–97. [PubMed] [Google Scholar]
- 5.Gurbel PA, Bliden KP, Guyer K, et al. Platelet reactivity in patients and recurrent events post-stenting: results of the PREPARE POST-STENTING Study. J Am Coll Cardiol. 2005;46:1820–6. doi: 10.1016/j.jacc.2005.07.041. [DOI] [PubMed] [Google Scholar]
- 6.Bliden KP, DiChiara J, Tantry US, et al. Increased risk in patients with high platelet aggregation receiving chronic clopidogrel therapy undergoing percutaneous coronary intervention: is the current antiplatelet therapy adequate? J Am Coll Cardiol. 2007;49:657–66. doi: 10.1016/j.jacc.2006.10.050. [DOI] [PubMed] [Google Scholar]
- 7.Thygesen K, Alpert JS, White HD. Joint ESC/ACCF/AHA/WHF Task Force for the Redefinition of Myocardial Infarction. Universal definition of myocardial infarction. Eur Heart J. 2007;28:2525–38. doi: 10.1093/eurheartj/ehm355. [DOI] [PubMed] [Google Scholar]
- 8.Mauri L, Hsieh WH, Massaro JM, et al. Stent thrombosis in randomized clinical trials of drug-eluting stents. N Engl J Med. 2007;356:1020–9. doi: 10.1056/NEJMoa067731. [DOI] [PubMed] [Google Scholar]
- 9.Antman EM, Cohen M, Bernink PJ, et al. The TIMI risk score for unstable angina/non-ST elevation MI: A method for prognostication and therapeutic decision making. JAMA. 2000;284:835–42. doi: 10.1001/jama.284.7.835. [DOI] [PubMed] [Google Scholar]
- 10.Gurbel PA, Tantry US. The relationship of platelet reactivity to the occurrence of post-stenting ischemic events: emergence of a new cardiovascular risk factor. Rev Cardiovasc Med. 2006;7(Suppl 4):S20–8. [PubMed] [Google Scholar]
- 11.Gurbel PA, Antonino MJ, Bliden KP, et al. Platelet reactivity to adenosine diphosphate and long-term ischemic event occurrence following percutaneous coronary intervention: a potential antiplatelet therapeutic target. Platelets. 2008;19:595–604. doi: 10.1080/09537100802351065. [DOI] [PubMed] [Google Scholar]
- 12.Gurbel PA, Bliden KP, Guyer K, et al. Delayed thrombin-induced platelet-fibrin clot generation by clopidogrel: a new dose-related effect demonstrated by thrombelastography in patients undergoing coronary artery stenting. Thromb Res. 2007;119:563–70. doi: 10.1016/j.thromres.2006.05.006. [DOI] [PubMed] [Google Scholar]
- 13.McCrath DJ, Cerboni E, Frumento RJ, et al. Thromboelastography maximum amplitude predicts postoperative thrombotic complications including myocardial infarction. Anesth Analg. 2005;100:1576–83. doi: 10.1213/01.ANE.0000155290.86795.12. [DOI] [PubMed] [Google Scholar]
- 14.Breet NJ, van Werkum JW, Bouman HJ, et al. Comparison of platelet function tests in predicting clinical outcome in patients undergoing coronary stent implantation. JAMA. 2010;303:754–62. doi: 10.1001/jama.2010.181. [DOI] [PubMed] [Google Scholar]


