

Abstract
Recent data suggest that prenatal exposure to p,p’-DDE may reduce height and increase body mass index (BMI) in childhood, thus potentially raising the risk of adult health problems. The association between prenatal DDE exposure and growth was evaluated in 788 boys from Chiapas, an area of Mexico where DDT was recently used. The median DDE levels in maternal serum at birth (2002-2003) were 2.7 μg/g lipid. 2,633 measurements of height (cm) and weight (kg) were obtained in 2004-2005. The median age of the children during follow-up was 18 months (quartiles 14 and 22 months). Height and body mass index (kg/m2) were age-standardized and expressed as standard deviation scores (SDS). Multivariate random-effect models for longitudinal data were fitted and predicted height and BMI SDS were estimated from the adjusted models. Overall, associations between prenatal DDE level and height or BMI SDS at any given age were not observed. For example, the predicted values showed that children with the highest exposure (DDE: >9.00 μg/g) compared to those least exposed (DDE: < 3.01 μg/g) grew similarly and they had a BMI SDS similar to the referent group. The results do not support the prior findings of an association of DDE exposure with childhood height or BMI.
Keywords: body height; body mass index; child, preschool; growth and development; infant; longitudinal study; p,p’-DDE
INTRODUCTION
DDT (1,1,1-trichloro-2,2-bis(4-chlorophenyl)ethane) is an organochlorine pesticide used worldwide in the past for agriculture, and use continues in some countries for vector-borne disease control (UNEP, 2009). The cost-benefit of DDT use for public health purposes in developing countries is under debate, and adverse effects of high exposure are not definite (Roberts et al., 2000; Rogan and Chen, 2005; Sadasivaiah et al., 2007; Schapira, 2006). Thus, epidemiologic studies of populations with high exposure may be helpful to those making decisions about vector-borne disease control policy.
DDE (1,1-dichloro-2,2-bis(p-chlorophenyl)ethylene), the major and most persistent degradation product of DDT, is generally found at higher concentrations than DDT in human tissues (Turusov et al., 2002). Previous reports suggest that higher levels of prenatal DDE exposure may be associated with altered postnatal growth. Studies evaluating such an association have reported decreased height at ages 1, 4 and 7 years (Ribas-Fito et al., 2006), and increased body mass index (BMI) at ages 1 and 3 years (Verhulst et al., 2009), and in adult women (Karmaus et al., 2009). Other studies however, have not confirmed associations between prenatal DDE exposure and reduced height or increased BMI during infancy, childhood, or adolescence (Gladen et al., 2004; Gladen et al., 2000; Jusko et al., 2006; Rogan et al., 1987). One study reported an association between postnatal exposure to DDE and decreased height in girls at age 8 years (Karmaus et al., 2002). Lower postnatal growth has been related to higher infant mortality in developing countries (Pelletier et al., 1993) and with increased morbidity and mortality in adults (Adair, 2008; Fisher et al., 2006; Gluckman et al., 2005; Hardy et al., 2004; Skidmore et al., 2007; Wells, 2007); increased BMI with its attendant risks also tracks from childhood to adulthood (Martin et al., 2006; Viner et al., 2008).
The objective of the present study was to evaluate the association of prenatal exposure to DDE and longitudinal measurements of height and body mass index at early ages in boys from Tapachula, Chiapas, an area of Mexico where DDT was recently used. Although this country stopped using DDT for agriculture in 1991 and for malaria control in 1998, the population in the Tapachula area experienced unusually high exposures for almost 40 years.
MATERIALS AND METHODS
Newly-delivered male infants and their mothers (n=872) were recruited during 2002 – 2003 at both of the city hospitals in Tapachula, which also serve the surrounding areas. The participation rate was 95 percent (Longnecker et al., 2007; Romano-Riquer et al., 2007). Due to an initial study hypothesis regarding effects on outcomes mediated by androgen-blocking, only boys were enrolled. Between January 20th, 2004 and June 29th, 2005 we conducted a relatively short follow-up study to evaluate the association of maternal DDE exposure with duration of lactation (Cupul-Uicab et al., 2008) and other outcomes; during follow-up anthropometric measurements of the children were obtained.
According to the eligibility criteria for the original study, we excluded women younger than 15 or older than 35 years, and those with certain medical conditions described previously (Cupul-Uicab et al., 2008; Longnecker et al., 2007). In addition, we excluded children born when less than 36 weeks of gestational age, or under 2,500 g of birthweight (Gluckman et al., 2005; Longnecker et al., 2007; Romano-Riquer et al., 2007). One child who was given up for adoption after being recruited was excluded from the follow-up (Cupul-Uicab et al., 2008). The study was approved by the Institutional Review Boards at the Instituto Nacional de Salud Pública in México and the National Institute of Environmental Health Sciences in the United States. All mothers gave written informed consent.
For the present analysis, one child was excluded because his growth had been greatly affected by severe malnutrition as reported by the mother and confirmed by anthropometric measurements. Of the eligible participants (n=870), 90.7 percent (n=789) had at least one follow-up visit and 9.3 percent (n=81) were lost to follow-up. The main reasons for the loss to follow-up were: recorded address did not exist (n=10), the address was found but the mother was not (n=59), refused participation (n=4), or the mother or child had died (n=8). The mean age of the children when the follow-up began was 13.0 months (range, 3.3 to 25.1 months) and at the end of the follow-up was 30.5 months (range, 20.8 to 42.7 months).
A total of 2,667 observations were available for the 789 subjects with at least one follow-up visit. The median age during the follow-up period was 18.1 months (quartiles 14 and 22 months). The number of follow-up visits varied for logistic reasons and ranged from 1 to 7 (median 3); 5 percent (n=39) had only one visit and 11 percent (n=86) had 6 or more visits. The gap between visits ranged from 0.8 to 12.9 months (median 2.5). For those with only one visit the median interval between the beginning of the follow-up and their visit was 11 months (quartiles 2.8 and 15.5); for those with two or more visits, the median interval between the beginning and first visit was 3.1 months (quartiles 0.7 and 5.2).
Anthropometric measurements
Recumbent length was measured to the nearest millimeter using portable fiberglass measuring boards for children up to 1.3 meters (locally designed). Hereafter we will refer to length as height. Weight was measured using portable electronic pediatric scales (Tanita© Models 1583 or BD-585, Tokyo, Japan) with readable increments of 10 g for children weighing up to 10 kg and 20 g for those weighing > 10 kg. The scales were calibrated before each use. All measurements were performed using standardized methods (Habicht, 1974) during home visits by trained personnel, who also received periodic retraining throughout the study.
To evaluate the quality of the data and the measurement error (Malina et al., 1974; Ulijaszek and Kerr, 1999), measurements of height (n=232) and weight (n=233) were obtained by a second observer. The coefficient of reliability was 0.998 for height and 0.997 for weight.
Body mass index (kg/m2) was used as an indicator of excess weight relative to height to facilitate comparisons of the present study with previous results. Standard deviation scores (SDS) for height, weight and BMI were calculated using internal means and standard deviations (SD) for each month of age by subtracting the mean from a given measurement and dividing by the SD of the corresponding age group. Height and weight were also transformed into age-specific z-scores (length-for-age, 0 to 36.5 months; weight-for-age, 0 to 20 years) using the 2000 CDC growth reference for boys (Kuczmarski et al., 2000) to facilitate comparisons. Weight was transformed into height-specific SDS and z-scores (weight-for-length, 45 to 103.5 cm) for use in sensitivity analyses (Kuczmarski et al., 2000). Biologically implausible values for height (n=31) and weight (n=2) were excluded, leaving a total of 788 subjects with 2,634 observations for the present analysis. After these exclusions, the number of subjects with only one available measurement for anthropometry increased from 39 to 43.
DDE and DDT measurements
DDE and DDT were measured in maternal serum obtained within a day of delivery. DDE and DDT were quantified after solid phase extraction, using gas chromatography with mass spectrometry detection (Saady and Poklis, 1990; Smith, 1991). The limit of detection for both analytes was 0.2 μg/L. The between-assay coefficients of variation were 7 percent for DDE (at 10 μg/L) and 6 percent for DDT (at 2.5 μg/L). The recovery was 97 percent for both analytes. Total serum lipid content was estimated based on levels of free and total serum cholesterol, triglycerides and phospholipids (Patterson et al., 1991), measured using standard enzymatic methods. DDE and DDT concentrations were expressed as micrograms per gram of lipid (μg/g). For the analysis, DDE categories (μg/g) were defined as: ≤3.00, 3.01-6.00, 6.01-9.00, and >9.00, which were chosen before examining the DDE-outcome relationships. As described previously these categories resulted in a large exposure difference between those in the high and low categories while maintaining adequate numbers for analysis (Cupul-Uicab et al., 2008; Longnecker et al., 2007). For DDT (μg/g), we used the following categories: ≤0.25, 0.26-0.75, 0.76-1.99, and ≥2.00 (Cupul-Uicab et al., 2008).
Statistical analysis
Height and BMI as SDS were the main outcomes for the present analysis. SDS were used to facilitate the comparison of effects at different ages (Cole, 2007). The association of prenatal DDE exposure with height and BMI were each evaluated using a multivariate multilevel model for change (linear mixed model), where the longitudinal measurements were nested within children (Singer and Willett, 2003). Subject-specific random intercepts and random slopes for age (months) were included in the models assuming an unstructured covariance matrix for these random effects (Rabe-Hesketh and Skrondal, 2008; Singer and Willett, 2003). Age of the children (months) was also included as a covariate in all the models to account for different timing of measurements for each child. To give a meaningful interpretation of the intercept, age was centered to the median at first measurement (15.7 months). The effect on height or BMI SDS of each variable included as predictor in the models was estimated with two terms, a main effect term (initial status at 15.7 months) and an interaction term with child’s age (monthly rate of change) (Rabe-Hesketh and Skrondal, 2008; Singer and Willett, 2003). For instance, when interpreting the effect of the highest exposure group (DDE >9.00 μg/g) compared to the least exposed (DDE ≤3.00 μg/g), the main effect term corresponds to the population average difference in SDS (of height or BMI) between highest versus lowest exposure groups at the median age of the children at first follow-up and the corresponding interaction term is the average monthly change in this difference. Predicted values for height and BMI SDS were also estimated from the adjusted models; differences across categories of DDE exposure at different ages of the children during follow-up (other than 15.7 months) were also tested using the post-estimation tools for mixed models available in Stata (linear combination of estimators [command lincom]). See the online supplementary data for detailed information about the fitted models. All analyses were done using Stata 10.1 (Stata Corporation, 2009).
Predictors of childhood growth considered a priori as variables to include in the models besides DDE exposure and child’s age at measurement, were mother’s smoking status during pregnancy, hospital of recruitment, rural/urban residence, gestational age at birth (median centered), and maternal education. Maternal height (median centered) was included a priori only for height models and pre-pregnancy BMI only for BMI models. Maternal weight at the first follow-up visit was used to calculate BMI if the pre-pregnancy weight was missing (n=128, 16.2 percent). Other maternal, paternal and child characteristics listed in Table 1 (and table 1a of supplementary data) were considered as potential confounders.
Table 1.
Characteristics of the Participants at Delivery and First Follow-up Visit, Tapachula, Chiapas, Mexico 2002-2005
| Follow-up status |
At least one follow-up visit |
|||||
|---|---|---|---|---|---|---|
| Characteristics | Followed (n=788) % |
Lost to follow-up (n=81) % |
P valuea |
One visit (n=39) % |
2+ visits (n=749) % |
P valuea |
| Maternal | ||||||
| Age at childbirth (y)b | 23.7 (7.1) | 21.5 (6.0) | 0.01 | 23.7 (7.5) | 23.7 (7.0) | 0.45 |
| Education (y) | 0.02 | 0.04 | ||||
| None | 4.2 | 6.2 | 5.1 | 4.1 | ||
| 1 - 6 | 30.7 | 46.9 | 25.6 | 31.0 | ||
| 7 - 9 | 31.0 | 25.9 | 15.4 | 31.8 | ||
| 10 - 12 | 24.0 | 13.6 | 43.6 | 23.0 | ||
| >12 | 10.2 | 7.4 | 10.3 | 10.1 | ||
| Pre-pregnancy BMI (kg/m2)c |
0.90 | 0.99 | ||||
| ≤18.5 | 7.2 | 4.9 | 7.7 | 7.2 | ||
| 18.6 - <25.0 | 57.5 | 46.9 | 56.4 | 57.5 | ||
| 25.0 - <30.0 | 25.3 | 16.0 | 25.6 | 25.2 | ||
| ≥30 | 10.0 | 6.2 | 10.3 | 10.0 | ||
| Smoked during pregnancy |
1.1 | 1.2 | 0.63 | 0.0 | 1.2 | |
| Drank alcohol during pregnancyc |
2.9 | 4.9 | 0.24 | 7.7 | 2.7 | 0.10 |
| First prenatal care visit |
<0.01 | 0.51 | ||||
| None | 36.0 | 55.6 | 43.6 | 35.6 | ||
| First trimester | 42.6 | 24.7 | 41.0 | 42.7 | ||
| After first trimester |
21.3 | 19.8 | 15.4 | 21.6 | ||
| Parityde | 0.28 | 0.07 | ||||
| 1 | 41.4 | 46.9 | 56.4 | 40.6 | ||
| 2 | 34.9 | 37.0 | 33.3 | 35.0 | ||
| 3+ | 23.7 | 16.0 | 10.3 | 24.4 | ||
| Age at menarche (y)bc |
13.0 (2.0) | 13.0 (2.0) | 0.40 | 13.0 (2.0) | 13.0 (2.0) | 0.88 |
| Height (cm)b | 152.5 (7.7) | 151.4 (8.1) | 0.04 | 149.9 (7.5) | 152.6 (7.8) | 0.05 |
| Serum p,p’-DDE (μg/g)bf |
2.7 (4.3) | 1.7 (3.8) | 0.01 | 1.6 (2.4) | 2.7 (4.6) | <0.01 |
| Serum p,p’-DDT (μg/g)bf |
0.3 (0.6) | 0.2 (0.5) | <0.01 | 0.2 (0.2) | 0.3 (0.7) | <0.01 |
| Worked outside homee |
31.5 | 35.8 | 0.43 | 33.3 | 31.4 | 0.80 |
| Hospital of recruitment |
<0.01 | 0.68 | ||||
| Social Security | 49.4 | 28.4 | 46.2 | 49.5 | ||
| Ministry of Health | 50.6 | 71.6 | 53.8 | 50.5 | ||
| Residence areae | 0.81 | 0.29 | ||||
| Urban | 59.4 | 58.0 | 51.3 | 59.8 | ||
| Rural | 40.6 | 42.0 | 48.7 | 40.2 | ||
| Poverty indexceg | 0.07 | 0.86 | ||||
| Poorest | 70.7 | 66.7 | 66.7 | 70.9 | ||
| Less poor | 19.0 | 11.1 | 20.5 | 19.0 | ||
| Not poor | 10.2 | 2.5 | 10.3 | 10.1 | ||
| Home ownerc | 17.9 | 35.9 | 0.18 | |||
| Child | ||||||
| Gestational age (wk)b | 40.0 (1.0) | 39.0 (1.0) | 0.13 | 39.7 (2.0) | 40.0 (1.0) | 0.09 |
| Birth season | 0.51 | 0.38 | ||||
| Winter | 20.1 | 14.8 | 28.2 | 19.6 | ||
| Spring | 28.8 | 35.8 | 33.3 | 28.6 | ||
| Summer | 28.0 | 27.2 | 23.1 | 28.3 | ||
| Autumn | 23.1 | 22.2 | 15.4 | 23.5 | ||
| Age at introduction of formula or cow’s milk (mo)bgh |
6.0 (8.5) | 3.0 (7.5) | 0.06 | |||
| Breastfeed everh | 97.4 | 98.7 | 0.43 | |||
| Ever exclusively breastfeedh |
89.7 | 83.3 | 0.29 | |||
| Duration of any breastfeeding (mo)bh |
10.0 (9.8) | 11.0 (12.9) | 0.08 | |||
| Duration of exclusive breastfeeding (mo)bh |
0.1 (2.0) | 0.1 (1.0) | 0.86 | |||
| Age at introduction of grains and cereal (mo)bh |
7.0 (6.0) | 6.0 (3.0) | 0.02 | |||
| Number of older siblings |
0.22 | <0.01 | ||||
| 0 | 43.0 | 53.1 | 59.0 | 42.2 | ||
| 1 | 36.3 | 30.9 | 38.5 | 36.2 | ||
| 2+ | 20.7 | 16.0 | 2.6 | 21.6 | ||
| Had a younger sibling during follow-uph |
7.7 | 10.0 | 0.11 | |||
Abbreviations: BMI, body mass index; DDE, 1,1-dichloro-2,2-bis(p-chlorophenyl)ethylene; DDT, 1,1,1-trichloro-2,2-bis(4-chlorophenyl)ethane
Comparing subjects by follow-up status (followed vs. lost to follow-up) and those with at least one visit (one vs. 2+ visits) using Pearson’s chi-squared or Fisher’s exact tests for categorical and Kruskal-Wallis equality-of-populations rank test for continuous variables. All tests were two-sided
Median (interquartile range)
Variables with missing data: ≤ 2.5%, except for mother’s pre-pregnancy BMI (25.9%), age at menarche (49.4%), and poverty index (19.8%) in the lost to follow-up group
Parity of one at recruitment reflects the birth of the study child
Time-varying variables, information for those with at least one follow-up visit reflects their status at first visit
Determined from maternal serum samples drawn at delivery of the study child
Defined using Mexican national standards based on monthly per capita income: Urban (Poorest, ≤672 pesos; Less poor, >672 to ≤1,367; Not poor, >1,367) and Rural (Poorest, ≤ 495; Less poor, >495 to ≤946; Not poor, >946) (Cupul-Uicab et al., 2008)
The information was asked only in the follow-up study
The SDS of height and BMI were modeled separately. After adjustment for the variables selected a priori, the P values for the potential confounders were evaluated using models that included one potential confounder at a time; those with a P ≤ 0.20 were given further consideration. For both models (height and BMI SDS) these variables were maternal age at childbirth and work status during follow-up; paternal smoking status during pregnancy and body habitus at childbirth (Osuna-Ramirez et al., 2006; Sorensen et al., 1983); child’s number of older siblings, duration of any breastfeeding, age at introduction of formula or cow’s milk and age at introduction of grains and cereal. Additional variables that met the criteria (P ≤ 0.20) in the height model only were maternal alcohol consumption during pregnancy, poverty index during follow-up and pre-pregnancy BMI; paternal age at childbirth, education and smoking status during follow-up; child’s birth season and ever exclusively breastfed. For the BMI model the additional variables with P ≤ 0.20 were maternal poverty index during pregnancy; father’s presence at home during pregnancy and follow-up; having a younger sibling during the study period. Although parity may be a predictor of growth (Prentice et al., 1987) and met the criteria, it was not included as a potential confounder in the full models because it was highly correlated with number of older siblings (r = 0.95), which showed greater effects in the individual models and has been suggested as an important predictor of early growth (Lawson and Mace, 2008; Lei et al., 1999).
All potential confounders (P ≤ 0.20) were introduced in full models (for height and BMI), and removed in a stepwise manner deleting variables one by one using the change in estimate method for confounding assessment (Greenland, 1989). Initially the interest was to evaluate the effect of high prenatal DDE exposure, therefore to facilitate the selection process we considered only the change in the two coefficients (main effect and its corresponding interaction term with child’s age) that corresponded to the highest exposure category (DDE >9.00 μg/g). The change in estimate criteria used are described in the online supplement. None of the potential confounders met the criteria for either outcome; results from models that included all potential confounders (P ≤ 0.20) gave results that were nearly identical to those presented. Using DDE as a continuous variable for the selection instead of the highest exposure category terms gave the same results.
Thus, the final models of height and BMI (SDS) included only the variables selected a priori. A similar analysis with categories of DDT as the main exposure variable instead of DDE was done using the same explanatory variables as the final DDE models. Effect modification by duration of lactation and maternal smoking (P < 0.20) was evaluated with likelihood-ratio tests. We defined maternal smoking as having ever smoked >100 cigarettes, similar to the analysis by Verhulst et al. (2009). The power to test interactions between DDE and smoking during pregnancy in the present study however, was limited.
Because anthropometric measurements at birth were expected to be correlated with the outcomes, we conducted separate sensitivity analyses with these variables: the final model for height (SDS) was adjusted for child’s birth length (cm) and the final model for BMI (SDS) was adjusted for weight or BMI (kg/m2) at birth. In addition, height and BMI in the original units, age-specific z-scores for height and weight, and height-specific SDS (and z-scores) for weight were modeled separately with the variables selected a priori as predictors (see online supplement for further details).
Other sensitivity analyses were conducted by refitting the final models of height and BMI after: a) excluding subjects with only one follow-up visit, b) stratifying by the number of visits (< 3 and ≥ 3), c) restricting the analysis to the ages where most of the anthropometric measurements were obtained (at ≤ 30 or ≤ 25 months), d) using deciles of DDE exposure (percentiles: 10th, 0.75 μg/g and 90th, 11.27 μg/g), and e) dividing the lowest category of DDE into finer categories (≤ 1.00, 1.01 - ≤ 2.00, 2.01 - ≤ 3.00 μg/g). Finally, because BMI is not a widely used indicator of excess weight in children younger than 24 months (WHO, 1995), an analysis stratified by child’s age (at < 24 and ≥ 24 months) was conducted for the BMI SDS model. Similar stratification was done with weight for height SDS as an outcome.
RESULTS
Compared with those who were followed, the mothers lost to follow-up were younger, less educated, shorter, and poor; more were recruited at the Ministry of Health hospital (Table 1). A higher proportion of mothers lost to follow-up reported having no prenatal care, absence of the child’s father, and fathers who smoked. Finally, their median levels of DDE and DDT were lower compared with the followed mothers. Comparisons between those with one and two or more follow-up visits are presented in Table 1. Those with only one visit had lower median levels of DDE and DDT.
Overall, the mothers in this study had little education, were young, urban-dwelling and poor or very poor, and most had previously had a child; few reported smoking (n=9) or drinking alcohol (n=23) during pregnancy (Table 1). The fathers of the children were older than the mothers and a higher proportion of them had more than 12 years of school (Table 1a of supplementary data). The percentage of breastfed children was high, the duration of any breastfeeding was long, and the duration of exclusive breastfeeding was short (Table 1).
Because of the exclusion criteria for the original study, the children were delivered at term with birth weights in the normal range (Tables 1 and 2). Anthropometry at birth compared with the 2000 CDC growth reference (Kuczmarski et al., 2000) showed that length for age was on average −0.15 SD (quartiles −0.56 and 0.38) below the mean for US boys at birth, and weight for age was on average −0.38 SD (quartiles −0.88 and 0.04) below the mean for US boys at birth (data not shown).
Table 2.
Characteristics of the Boys by Prenatal Exposure to DDE, Tapachula, Chiapas, Mexico 2002-2005
| Maternal serum levels of p,p’-DDE (μg/g lipid)a |
||||||
|---|---|---|---|---|---|---|
| Overall (n=788) | ≤3 (n=426) |
3.01-6.00 (n=174) |
6.01-9.00 (n=70) |
>9.00 (n=118) |
Trend testb | |
|
Mean (SD) of
anthropometry at birth | ||||||
| Length (cm) | 49.6 (1.9) | 49.5 (1.9) | 49.7 (1.8) | 49.4 (2.0) | 49.8 (2.1) | 0.30 |
| Weight (gr) | 3,299.5 (392.7) | 3,280.3 (387.9) | 3,311.6 (411.1) | 3,293.1 (357.1) | 3,354.4 (401.3) | 0.08 |
| BMI (kg/m2) | 13.4 (1.3) | 13.4 (1.3) | 13.4 (1.3) | 13.5 (1.2) | 13.5 (1.4) | 0.17 |
| Head circumference (cm) | 34.2 (1.5) | 34.1 (1.4) | 34.3 (1.4) | 34.3 (1.5) | 34.2 (1.7) | 0.74 |
| Follow-up characteristics c | ||||||
| Total visits | 3.0 ( 3.0) | 3.0 ( 3.0) | 3.0 (3.0) | 3.0 ( 3.0) | 3.0 ( 3.0) | 0.34 |
| Span between visitsd | 2.5 (1.7) | 2.5 (1.6) | 2.5 (1.7) | 2.3 (1.9) | 2.3 (1.7) | 0.02 |
| Age at 1st follow-up | 15.7 (10.1) | 15.5 (10.8) | 15.7 (8.7) | 18.0 (11.3) | 17.7 (11.8) | <0.01 |
| Age at last follow-up | 21.5 ( 7.0) | 21.3 ( 6.6) | 21.6 (6.4) | 22.3 ( 7.4) | 22.5 ( 8.9) | 0.01 |
| Mean (SD) of the SDS e f | ||||||
| Height | 0.021 (0.821) | 0.027 (0.784) | 0.003 (0.856) | −0.040 (0.942) | 0.060 (0.832) | 0.82 |
| BMI | 0.015 (0.790) | 0.012 (0.818) | −0.030 (0.742) | −0.003 (0.721) | 0.105 (0.797) | 0.30 |
| Weight | 0.024 (0.826) | 0.026 (0.819) | −0.020 (0.810) | −0.028 (0.842) | 0.108 (0.868) | 0.43 |
| Weight (for height)g | 0.002 (0.791) | 0.003 (0.819) | −0.034 (0.747) | −0.021 (0.719) | 0.068 (0.797) | 0.48 |
Abbreviations: BMI, body mass index; DDE, 1,1-dichloro-2,2-bis(p-chlorophenyl)ethylene; SD, standard deviation
Determined from maternal serum samples drawn at delivery of the study child
Trend test from linear regression models (for normally distributed variables) or Cuzick nonparametric test [an extension of the Wilcoxon rank-sum test] (for non-normally distributed variables). All tests were two-sided
Median (interquartile range)
Subjects with only one follow-up visit (n=39) were not taken into account when estimating the span between visits
Between-subjects means (overall) of the within-subject averages of their given measurements, from recruitment to the end of follow-up
SDS, standard deviations scores at each age point (rounded to the nearest integer) derived internally as: measurement - population mean/population standard deviation
SDS, standard deviations scores at each height value (rounded to the nearest integer) derived internally as: measurement - population mean/population standard deviation
Across maternal serum levels of DDE, anthropometric measurements of the children at birth were similar as were the total number of follow-up visits and the interval between them. However, an increase in the median of children’s age at first and last follow-up visits with levels of DDE was observed, although the difference in ages were on average less than three months (Table 2).
Higher levels of prenatal DDE exposure showed no crude associations with height or BMI SDS (Table 2). With height in its original units (cm), no pattern was observed across categories of DDE at any age (Figure 1). Although after 24 months of age the figure suggests a small effect with higher DDE, the numbers were sparse at those ages. Similarly, no clear pattern of any effect due to DDE exposure on BMI (kg/m2) was observed; at 5 months of age children in the higher exposure categories of DDE had lower BMI than those in low exposure categories (Figure 2) but again the data were sparse in this age range.
Figure 1.

Mean of height (cm) of the boys during the study period by prenatal exposure to p,p’-DDE (μg/g lipids), Tapachula, Chiapas, Mexico 2002-2005
Abbreviations: DDE, 1,1-dichloro-2,2-bis(p-chlorophenyl)ethylene
Figure 2.

Mean of body mass index (kg/m2) of the boys during the study period by prenatal exposure to p,p’-DDE (μg/g lipids), Tapachula, Mexico 2002-2005
Abbreviations: DDE, 1,1-dichloro-2,2-bis(p-chlorophenyl)ethylene
Unadjusted and adjusted results from the multivariate models of height SDS generally showed no statistically significant associations with higher levels of DDE, except for the interaction term in the second category of exposure (Table 3). The adjusted coefficients for DDE from the model of height can be interpreted as follows. At 15.7 months of age (median age at first follow-up) the main effect term indicates that, compared to the least exposed group (DDE: < 3.01 μg/g), children in the second exposure category (DDE: 3.01-6.00 μg/g) were shorter by 0.121 SDS; the interaction term however, indicates that their rate of growth was slightly increased by 0.019 SDS a month. Thus, the observed difference in height SDS was reduced until age ~22 months when these children had similar height SDS as those from the referent group (Figure 3). At 15.7 months of age, children in the third exposure category (DDE: 6.01-9.00 μg/g) compared to the referent group were shorter by 0.03 SDS and their rate of growth was decreased by −0.005 a month; these children continued to grow at a slower rate and the observed difference in height SDS increased with time (Figure 3). Unexpectedly, at 15.7 months of age, children with the highest exposure (DDE: >9.00 μg/g) compared to the least exposed were taller by 0.069 SDS (equivalent to +0.21 cm) and their rate of growth was slightly increased by 0.01 SDS a month (equivalent to +0.03 cm). Thus, the difference in height SDS increased with time and they grew taller than the referent group (Figure 3). The observed differences in height before and after age 15.7 months were not significant when comparing the least exposed group with the third (DDE: 6.01-9.00 μg/g) and the highest exposure categories (DDE: >9.00 μg/g); however for the second category (DDE: 3.01-6.00 μg/g) the differences were significant up to 10 months of age and at 38 months (Figure 3, table 2b of supplementary data).
Table 3.
Coefficients From the Multilevel Model for Change of Height (SDSa) in Boys From Tapachula, Chiapas, Mexico 2002-2005 (n=788 boys, 2,633 observations)
| Unadjusted β coefficientsb |
Adjusted β coefficientsc |
|||||||
|---|---|---|---|---|---|---|---|---|
| Main effectd | 95% CI | Interactione | 95% CI | Main effectd | 95% CI | Interactione | 95% CI | |
| Interceptfg | −0.031 | −0.100, 0.039 | 0.012 | 0.007, 0.017 | 0.555 | 0.344, 0.766 | 0.014 | −0.003, 0.030 |
|
p,p’-DDE (μg/g)h | ||||||||
| ≤3.00 | Reference | Reference | ||||||
| 3.01-6.00 | −0.124 | −0.298, 0.049 | 0.018 | 0.005, 0.030 | −0.121 | −0.284, 0.042 | 0.019 | 0.006, 0.032 |
| 6.01-9.00 | −0.054 | −0.306, 0.199 | −0.008 | −0.026, 0.010 | −0.030 | −0.267, 0.207 | −0.005 | −0.023, 0.013 |
| >9.00 | −0.027 | −0.235, 0.181 | 0.004 | −0.011, 0.019 | 0.069 | −0.131, 0.268 | 0.010 | −0.006, 0.025 |
| Smoked during pregnancyi |
0.554 | −0.143, 1.250 | −0.003 | −0.055, 0.049 | 0.485 | −0.165, 1.135 | −0.006 | −0.057, 0.045 |
| Hospital of recruitmenti | ||||||||
| Ministry of Health |
−0.462 | −0.597, −0.326 | −0.008 | −0.018, 0.002 | −0.280 | −0.421, −0.139 | −0.004 | −0.014, 0.007 |
| Rural residence at recruitmenti |
−0.198 | −0.341, −0.055 | −0.012 | −0.023, −0.002 | −0.052 | −0.194, 0.090 | −0.012 | −0.023, −0.001 |
| Gestational age (wk)g |
0.059 | −0.010, 0.129 | 0.004 | −0.001, 0.009 | 0.041 | −0.024, 0.105 | 0.003 | −0.002, 0.008 |
| Maternal education (years) | ||||||||
| None | −1.018 | −1.407, −0.630 | −0.029 | −0.057, −0.002 | −0.507 | −0.899, −0.115 | −0.015 | −0.044, 0.014 |
| 1 - 6 | −0.801 | −1.041, −0.562 | −0.008 | −0.026, 0.010 | −0.461 | −0.708, −0.215 | 0.001 | −0.018, 0.020 |
| 7 - 9 | −0.683 | −0.921, −0.444 | 0.001 | −0.017, 0.019 | −0.471 | −0.706, −0.236 | 0.006 | −0.012, 0.024 |
| 10 - 12 | −0.404 | −0.653, −0.155 | −0.002 | −0.021, 0.016 | −0.330 | −0.568, −0.093 | 0.000 | −0.018, 0.018 |
| > 12 | Reference | Reference | ||||||
| Maternal heightg |
0.051 | 0.040, 0.063 | 0.001 | 0.000, 0.002 | 0.040 | 0.029, 0.052 | 0.001 | 0.000, 0.002 |
Abbreviations: CI, confidence interval; DDE, 1,1-dichloro-2,2-bis(p-chlorophenyl)ethylene; SDS, standard deviation scores
SDS, standard deviation scores internally derived at each age point as: measurement - population mean/population standard deviation. Height was missing for one observation
Unadjusted coefficients were obtained from models that also included a term for child’s age at measurements and subject-specific random intercepts and random slopes for age
Adjusted for all variables listed in the table (variables selected a priori)
Main effect term or initial status, represents the average difference in height SDS at 15.7 months of age (median age at first measurement) in a given category or value of a covariate
Interaction with child’s age at measurement (months), represents the average monthly rate of change (growth) in height SDS in a given category or value of a covariate
The intercept for the main effect term in the adjusted model represents the average height SDS at the median age at the first measurement (15.7 months) for children in the lowest exposure group (DDE, ≤3.00 μg/g lipids) with reference values for the other covariates included in the model; and the interaction term for the intercept represents the average monthly rate of change in height SDS in the lowest exposure group (DDE, ≤3.00 μg/g lipids) with reference values for the other covariates included in the model
Variables were median-centered as follow: age at measurements, 15.7 months; gestational age, 40 wk; maternal height, 152.5 cm
Determined from maternal serum samples drawn at delivery of the study child
Reference groups were: smoked during pregnancy, No; hospital of recruitment, Social Security; residence at recruitment, Urban
Figure 3.
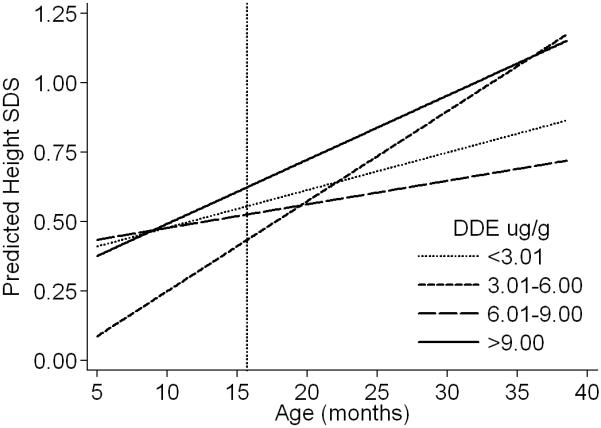
Estimated height (SDS)a of the boys at different ages by prenatal exposure to p,p’-DDE (μg/g lipids), Tapachula, Mexico 2002-2005
Abbreviations: DDE, 1,1-dichloro-2,2-bis(p-chlorophenyl)ethylene
Footnotes:
a Height SDS was estimated from the adjusted model presented in Table 3 for the age range of the children during follow-up by categories of DDE. The predictions were done for boys with referent values in the variables included in the model (i.e. boys of non-smoking mothers, with >12 years of education, with median height (152.5 cm), recruited at the Social Security hospital, from the urban area, and with median gestational age at birth (40 wk)). Predicted values and corresponding standard errors at selected ages during follow-up are presented in Table 2a of the supplementary material. Reference line at 15.7 months reflects the differences estimated with the main effect terms from the adjusted model in Table 3.
After adjustment, predictors of height SDS at 15.7 months of age were child’s age at measurement (taller), hospital of recruitment (shorter at Ministry of Health), and maternal education (taller) and height (taller). Rural residence was the only predictor (decreased growth) of the monthly rate of growth in the height SDS model (Table 3).
For BMI SDS (Table 4), no statistically significant associations with DDE emerged in the unadjusted and adjusted models. The adjusted coefficients for DDE from the model of BMI are interpreted similarly as those for height. At 15.7 months of age the main effect term indicates that, compared with children in the lowest exposure category, those with the highest exposure had a BMI higher by 0.073 SDS (equivalent to +0.10 kg/m2); the interaction term indicates that they had a slower rate of weight gain by −0.002 a month (equivalent to −0.003 kg/m2). Therefore, the difference in BMI SDS decreased with time and they had similar BMI as those from the referent group by age 38 months (Figure 4). The observed differences in BMI before and after age 15.7 months were not significant when comparing the least exposed group with any of the higher exposure categories (Figure 4, table 3b of supplementary data).
Table 4.
Coefficients From the Multilevel Model for Change of Body Mass Index (SDSa) in Boys From Tapachula, Chiapas, Mexico 2002-2005 (n=787 boys, 2,632 observations)
| Unadjusted β coefficientsb |
Adjusted β coefficientsc |
|||||||
|---|---|---|---|---|---|---|---|---|
| Main effectd | 95% CI | Interactione | 95% CI | Main effectd | 95% CI | Interactione | 95% CI | |
| Interceptfg | 0.046 | −0.027, 0.119 | −0.003 | −0.010, 0.004 | −0.017 | −0.254, 0.219 | 0.021 | 0.000, 0.043 |
|
p,p’-DDE (μg/g)h | ||||||||
| ≤3.00 | Reference | Reference | ||||||
| 3.01-6.00 | −0.059 | −0.241, 0.123 | −0.001 | −0.017, 0.016 | −0.112 | −0.293, 0.070 | −0.001 | −0.017, 0.016 |
| 6.01-9.00 | −0.168 | −0.435, 0.099 | 0.023 | −0.001, 0.047 | −0.183 | −0.447, 0.081 | 0.023 | −0.001, 0.046 |
| >9.00 | 0.116 | −0.105, 0.338 | −0.003 | −0.023, 0.017 | 0.073 | −0.152, 0.297 | −0.002 | −0.022, 0.018 |
| Smoked during pregnancyi |
0.811 | 0.055, 1.567 | −0.074 | −0.143, −0.006 | 0.750 | 0.006, 1.493 | −0.066 | −0.133, 0.002 |
| Hospital of recruitmenti | ||||||||
| Ministry of Health |
−0.100 | −0.246, 0.045 | −0.002 | −0.015, 0.012 | −0.042 | −0.198, 0.115 | 0.003 | −0.012, 0.017 |
| Rural residence at recruitmenti |
0.017 | −0.134, 0.169 | 0.002 | −0.012, 0.016 | 0.075 | −0.084, 0.234 | 0.002 | −0.013, 0.016 |
| Gestational age (wk)g |
0.016 | −0.057, 0.089 | −0.002 | −0.009, 0.004 | −0.007 | −0.079, 0.066 | −0.001 | −0.007, 0.006 |
| Maternal education (years) | ||||||||
| None | −0.434 | −0.851, −0.017 | −0.003 | −0.039, 0.034 | −0.458 | −0.885, −0.031 | −0.007 | −0.045, 0.031 |
| 1 - 6 | −0.062 | −0.318, 0.193 | −0.032 | −0.056, −0.009 | −0.092 | −0.358, 0.174 | −0.036 | −0.060, −0.011 |
| 7 - 9 | −0.020 | −0.274, 0.234 | −0.027 | −0.050, −0.004 | −0.047 | −0.304, 0.211 | −0.028 | −0.052, −0.005 |
| 10 - 12 | 0.251 | −0.015, 0.516 | −0.033 | −0.057, −0.009 | 0.241 | −0.021, 0.503 | −0.035 | −0.059, −0.011 |
| > 12 | Reference | Reference | ||||||
| Pre-pregnancy BMI (kg/m2) | ||||||||
| ≤18.5 | −0.122 | −0.396, 0.153 | 0.007 | −0.019, 0.032 | −0.075 | −0.347, 0.198 | 0.004 | −0.021, 0.030 |
| 18.6 - <25.0 | Reference | Reference | ||||||
| 25.0 − <30.0 | 0.127 | −0.046, 0.300 | 0.000 | −0.016, 0.016 | 0.157 | −0.015, 0.328 | 0.000 | −0.016, 0.016 |
| ≥30 | 0.465 | 0.221, 0.710 | −0.003 | −0.025, 0.019 | 0.487 | 0.245, 0.729 | −0.001 | −0.023, 0.020 |
Abbreviations: BMI, body mass index; CI, confidence interval; DDE, 1,1-dichloro-2,2-bis(p-chlorophenyl)ethylene; SDS, standard deviation scores
SDS, standard deviation scores internally derived at each age point as: measurement - population mean/population standard deviation. Height was missing for one observation and weight was missing for one subject
Unadjusted coefficients were obtained from models that also included a term for child’s age at measurements and subject-specific random intercepts and random slopes for age
Adjusted for all variables listed in the table (variables selected a priori)
Main effect term or initial status, represents the average difference in BMI SDS at 15.7 months of age (median age at first measurement) in a given category or value of a covariate
Interaction with child’s age at measurement (months), represents the average monthly rate of change in BMI SDS in a given category or value of a covariate
The intercept for the main effect term in the adjusted model represents the average BMI SDS at the median age at the first measurement (15.7 months) for children in the lowest exposure group (DDE, ≤3.00 μg/g lipids) with reference values for the other covariates included in the model; and the interaction term for the intercept represents the average monthly rate of change in height SDS in the lowest exposure group (DDE, ≤3.00 μg/g lipids) with reference values for the other covariates included in the model
Variables were median-centered as follow: age at measurements, 15.7 mo; gestational age, 40 wk
Determined from maternal serum samples drawn at delivery of the study child
Reference groups were: smoked during pregnancy, No; hospital of recruitment, Social Security; residence at recruitment, Urban
Figure 4.

Estimated body mass index (SDS)a of the boys at different ages by prenatal exposure to p,p’-DDE (μg/g lipids), Tapachula, Mexico 2002-2005
Abbreviations: DDE, 1,1-dichloro-2,2-bis(p-chlorophenyl)ethylene
Footnotes:
aBMI SDS was estimated from the adjusted model presented in Table 4 for the age range of the children during follow-up by categories of DDE. The predictions were done for boys with referent values in the variables included in the model (i.e. boys of non-smoking mothers, with >12 years of education, with pre-pregnancy BMI of 18.6 - <25.0, recruited at the Social Security hospital, from the urban area, and with median gestational age at birth (40 wk)). Predicted values and corresponding standard errors at selected ages during follow-up are presented in Table 3a of the supplementary material. Reference line at 15.7 months reflects the differences estimated with the main effect terms from the adjusted model in Table 4.
Predictors for BMI SDS at 15.7 months of age after adjustment were: having a mother who smoked during pregnancy (higher BMI), who had no education (lower BMI), and obesity before pregnancy (higher BMI). Years of maternal education was the only predictor (higher BMI) of the average rate of growth in the BMI SDS model.
Evidence of effect modification by duration of breastfeeding or maternal smoking (having ever smoked >100 cigarettes) was not observed in models of either height or BMI SDS. Using DDT as the exposure variable in multivariate models did not show any statistically significant associations with height or BMI SDS (data not shown).
Modeling height and BMI in their original units confirmed the results observed in Tables 3 and 4. When the age-specific z-scores of height and weight, and the height-specific SDS (and z-scores) of weight were modeled as outcomes, no associations with DDE were seen (data not shown). Stratifying the BMI and weight for height (SDS) models by child’s age (at < 24 and ≥ 24 months) showed similar results; no associations with DDE were observed in either group (data not shown). The results shown in Tables 3 and 4 were not materially different after a) adjustment for anthropometry at birth, b) excluding those with only one follow-up visit, c) stratifying by number of follow-up visits (<3 and ≥ 3), d) restricting the analysis by age (at ≤ 30 or ≤ 25 months), e) using deciles of DDE exposure, or f) dividing the lowest category of DDE into finer categories. Removing gestational age from the final models showed essentially the same results as in Tables 3 and 4 (data not shown).
DISCUSSION
Higher prenatal exposure to DDE was not associated with a decrease in growth or an increase in BMI in the first years of life in the male children studied. Although children in the second category (DDE: 3.01-6.00 μg/g) were slightly shorter than the referent group up to age 10 months, they recovered and grew taller by age 38 months. DDT was not associated with any of the outcomes studied.
Previous studies on height have given inconsistent results as shown in Table 5. Prenatal DDE exposure was higher in the two previous studies with null results (Gladen et al., 2004; Jusko et al., 2006) than in those with statistically significant associations (Gladen et al., 2000; Ribas-Fito et al., 2006). Similarly, earlier studies on weight or BMI have shown inconsistent results with DDE exposure (Table 5). Again, associations were seen only in studies with lower (Gladen et al., 2000; Karmaus et al., 2009; Verhulst et al., 2009) but not with higher prenatal exposure to DDE (Gladen et al., 2004). While the reasons for the inconsistent results are not clear, it is possible that in studies finding statistically significant effects associated with DDE, levels are acting as markers of some characteristic of the subject other than DDE (Wolff et al., 2007), which is related to height or BMI.
Table 5.
A Summary of Reports on Associations Between Prenatal DDE Exposure and Height or Body Mass Index
| Study | Children born | Sample size | Prenatal DDE (μg/g lipid)a |
Age at evaluation | Main findings on height or BMI |
|---|---|---|---|---|---|
| US Collaborative Perinatal Project (CPP) (Ribas-Fito et al., 2006) |
1959-1966 | 1,289 to 1,540b | 3.08 (24.4 μg/l)c |
1, 4 and 7 years | High DDE (≥60 μg/l) as compared with low (<15 μg/l) was associated with reduction in height at 1 (−0.72 cm); 4 (−1.14 cm) and 7 (−2.19 cm) years of age. (BMI not reported) |
| CPP Philadelphia center (Gladen et al., 2004) |
1959-1966 (only males) |
304 | 5.7 | 10 to 20 years | No association with height or BMI |
| Child Health and Development Study (Jusko et al., 2006) |
1964-1967 | 399d | 5.88 | 5 years | No association with height. (BMI not reported) |
| NC Infant Feeding Study (Rogan et al., 1987) |
1978-1982 | 858 | ~1.7 (2.43 μg/g milk fat) (Rogan et al., 1986) |
1 year | No association with weight gain. (Height not reported) |
| NC Infant Feeding Study (Gladen et al., 2000) |
1978-1982 | 594 | ~1.6 | 10 to 16 years | Boys with high DDE (4+ μg/g) were 6.3 cm taller and 6.9 kg heavier at puberty than those with low (0-1 μg/g) exposure. No associations in girls |
| Michigan fish eater’s cohort: 2nd generation (Karmaus et al., 2009) |
1950-1980 (only females) |
129 to 151 | 3.67 to 4.46 μg/lc Extrapolated levels |
20 to 50 years | Compared with low DDE (>1.503 μg/l) women with 1.503- 2.9 μg/l had 1.65 kg/m2 greater BMI; those with >2.9 μg/l had 2.8 kg/m2 greater BMI. (Height not reported) |
| Flanders, Belgium (Verhulst et al., 2009) |
2002-2004 | 138 | 0.212 (0.243) Mean (SD) in cord plasma |
1 and 3 years | DDE was positively associated with BMI SDS, with effect modification by maternal smoking and child’s age: BMI was higher in children of smokers at age 1 year; at age 3 years the difference was reduced. No associations with height |
| Tapachula, Mexico (Present study) |
2002-2003 (only males) |
787 to 788 | 2.7 | 5 to 38 months | No association with height, BMI, and weight |
Abbreviations: BMI, body mass index; DDE, 1,1-dichloro-2,2-bis(p-chlorophenyl)ethylene; NC, North Carolina; SDS, standard deviation score
Medians are from maternal serum, unless otherwise is specified
A total of 993 subjects were selected based on their outcomes on neurological tests
Non-lipid adjusted
Sample selection was based on neurobehavioral deficits hypothesis
The earlier studies were conducted when levels of polychlorinated biphenyls (PCB) were higher; however their findings were similar after taking PCB exposure into account (Gladen et al., 2004; Gladen et al., 2000; Ribas-Fito et al., 2006). In Mexican children PCBs are not a common exposure (Trejo-Acevedo et al., 2009), therefore confounding by these compounds is unlikely in the present study. Information on pesticides is limited, but recent data showed that children from Chiapas have detectable levels of hexachlorobenzene (Trejo-Acevedo et al., 2009), which has been associated with increased childhood BMI in a previous study (Smink et al., 2008). Residual confounding by this or other pesticide exposures cannot be ruled out.
A compelling mechanism to explain an adverse effect of prenatal DDE exposure on postnatal height or weight has not been reported. Conceivably alterations of normal endocrine function due to DDE’s antiandrogenicity (Kelce et al., 1995) could be involved. Males with less androgen are more likely to have higher BMI (Braga-Basaria et al., 2006). Prenatal DDE exposure has been related to thyroid hormone levels during infancy and childhood (Alvarez-Pedrerol et al., 2008), which are relevant for regulation of growth (Reiter and Rosefeld, 2003).
A limitation of the results is that they were based on only males, because this population was derived from a study limited to males. Previous studies suggested that effects of prenatal exposure to DDE on height or weight are sex-specific (Gladen et al., 2000; Ribas-Fito et al., 2006). In the Collaborative Perinatal Project, the decrease in linear growth with high exposure to DDE at age 7 years was greater (−3.32 cm) in African-American girls than in boys (−0.71 cm) (Ribas-Fito et al., 2006). While in the NC Study, significant associations were seen in boys only (Gladen et al., 2000). However other studies did not report sex-specific associations of prenatal exposure (Jusko et al., 2006; Verhulst et al., 2009). If DDE can effect height or BMI at early ages differentially by gender, exclusion of female children may have limited our ability to detect any association.
If prenatal DDE exposure affects postnatal growth via birth weight or preterm birth, excluding these children from our study may have also limited the power to detect associations. However, in the Collaborative Perinatal Project where no limitation on gestational age or birth weight was imposed, prenatal DDE exposure was negatively associated with height even after adjusting for anthropometry at birth (Ribas-Fito et al., 2006). Furthermore, in that study the finding of reduced height among those most exposed to DDE was essentially the same after exclusion of those who were < 36 weeks of gestation or < 2,500 grams at birth ((Ribas-Fito et al., 2006); unpublished results). In addition, prenatal exposure to DDE was positively associated with BMI in a population of children born at term, and the associations were still observed after adjusting for birth weight (Verhulst et al., 2009). These observations from other studies suggest it was unlikely that exclusions in the present study diminished our ability to detect an effect.
Measurement error for the outcome may have little or no effect on the results given the high coefficients of reliability obtained from the repeated measurements (Ulijaszek and Kerr, 1999). DDE levels were determined from serum drawn at delivery, using methods with a low between-assay coefficient of variation. Additionally, a high correlation (r = 0.85) has been reported between DDE levels from maternal serum at delivery and cord serum (Waliszewski et al., 2000). A previous study has shown that DDE levels correlate well during pregnancy and shortly after birth (Longnecker et al., 1999). The present study was double blind, since neither interviewers nor participants knew the DDT or DDE levels.
In the present study other known determinants of height and BMI were confirmed, which supports the validity of the data. Maternal height was a positive predictor of child’s height SDS; and rural residence and low education level of the mother were negative predictors (Hernandez-Diaz et al., 1999; Hindmarsh et al., 2008; Reyes et al., 2004; Reyes et al., 2003; Rivera-Dommarco et al., 1995). Maternal smoking during pregnancy and mother’s pre-pregnancy BMI ≥ 30 kg/m2 were positive predictors of child’s BMI SDS (Chen et al., 2006; Whitaker, 2004).
In summary, in this population of male children with high prenatal exposure to DDE, we did not see an association with height or BMI in the first years of life. The results were consistent across all analyses. DDT was not associated with any of the outcomes studied.
Supplementary Material
Acknowledgements
We wish to thank the field work team in Tapachula, Chiapas, México, for their valuable support during data collection.
Source of funding
This work was supported in part by a contract from the National Institute of Environmental Health Sciences, National Institutes of Health [N01-ES-15467], in part by the Intramural Research Program of the National Institutes of Health, National Institute of Environmental Health Sciences, Research Triangle Park, NC, USA; and in part by the Instituto Nacional de Salud Pública, Cuernavaca, Morelos, México.
Abbreviations
- BMI
body mass index
- DDE
1,1-dichloro-2,2-bis(p-chlorophenyl)ethylene
- DDT
1,1,1-trichloro-2,2-bis(4-chlorophenyl)ethane
- IQR
interquartile range
- SD
standard deviation
- SDS
standard deviation score.
Footnotes
Publisher's Disclaimer: This is a PDF file of an unedited manuscript that has been accepted for publication. As a service to our customers we are providing this early version of the manuscript. The manuscript will undergo copyediting, typesetting, and review of the resulting proof before it is published in its final citable form. Please note that during the production process errors may be discovered which could affect the content, and all legal disclaimers that apply to the journal pertain.
Conflict of interest:
None declared.
References
- Adair LS. Child and adolescent obesity: epidemiology and developmental perspectives. Physiol Behav. 2008;94:8–16. doi: 10.1016/j.physbeh.2007.11.016. [DOI] [PubMed] [Google Scholar]
- Alvarez-Pedrerol M, et al. Effects of PCBs, p,p’-DDT, p,p’-DDE, HCB and beta-HCH on thyroid function in preschool children. Occup Environ Med. 2008;65:452–7. doi: 10.1136/oem.2007.032763. [DOI] [PubMed] [Google Scholar]
- Braga-Basaria M, et al. Metabolic syndrome in men with prostate cancer undergoing long-term androgen-deprivation therapy. J Clin Oncol. 2006;24:3979–83. doi: 10.1200/JCO.2006.05.9741. [DOI] [PubMed] [Google Scholar]
- Chen A, et al. Maternal smoking during pregnancy in relation to child overweight: follow-up to age 8 years. Int J Epidemiol. 2006;35:121–30. doi: 10.1093/ije/dyi218. [DOI] [PubMed] [Google Scholar]
- Cole TJ. The life course plot in life course analysis. In: Pickles A, et al., editors. Epidemiological methods in life course research. OXFORD University Press; New York, NY: 2007. pp. 137–155. [Google Scholar]
- Cupul-Uicab LA, et al. DDE, a degradation product of DDT, and duration of lactation in a highly exposed area of Mexico. Environ Health Perspect. 2008;116:179–83. doi: 10.1289/ehp.10550. [DOI] [PMC free article] [PubMed] [Google Scholar]
- Fisher D, et al. Are infant size and growth related to burden of disease in adulthood? A systematic review of literature. Int J Epidemiol. 2006;35:1196–210. doi: 10.1093/ije/dyl130. [DOI] [PubMed] [Google Scholar]
- Gladen BC, et al. Prenatal DDT exposure in relation to anthropometric and pubertal measures in adolescent males. Environ Health Perspect. 2004;112:1761–7. doi: 10.1289/ehp.7287. [DOI] [PMC free article] [PubMed] [Google Scholar]
- Gladen BC, et al. Pubertal growth and development and prenatal and lactational exposure to polychlorinated biphenyls and dichlorodiphenyl dichloroethene. J Pediatr. 2000;136:490–6. doi: 10.1016/s0022-3476(00)90012-x. [DOI] [PubMed] [Google Scholar]
- Gluckman PD, et al. The developmental origins of adult disease. Matern Child Nutr. 2005;1:130–41. doi: 10.1111/j.1740-8709.2005.00020.x. [DOI] [PMC free article] [PubMed] [Google Scholar]
- Greenland S. Modeling and variable selection in epidemiologic analysis. Am J Public Health. 1989;79:340–9. doi: 10.2105/ajph.79.3.340. [DOI] [PMC free article] [PubMed] [Google Scholar]
- Habicht JP. Standardization of quantitative epidemiological methods in the field (Spanish) Bol Oficina Sanit Panam. 1974;76:375–84. [PubMed] [Google Scholar]
- Hardy R, et al. Birthweight, childhood growth, and blood pressure at 43 years in a British birth cohort. Int J Epidemiol. 2004;33:121–9. doi: 10.1093/ije/dyh027. [DOI] [PubMed] [Google Scholar]
- Hernandez-Diaz S, et al. Association of maternal short stature with stunting in Mexican children: common genes vs common environment. Eur J Clin Nutr. 1999;53:938–45. doi: 10.1038/sj.ejcn.1600876. [DOI] [PubMed] [Google Scholar]
- Hindmarsh PC, et al. Factors predicting ante- and postnatal growth. Pediatr Res. 2008;63:99–102. doi: 10.1203/PDR.0b013e31815b8e8f. [DOI] [PubMed] [Google Scholar]
- Jusko TA, et al. Maternal DDT exposures in relation to fetal and 5-year growth. Epidemiology. 2006;17:692–700. doi: 10.1097/01.ede.0000232226.06807.90. [DOI] [PMC free article] [PubMed] [Google Scholar]
- Karmaus W, et al. Childhood growth and exposure to dichlorodiphenyl dichloroethene and polychlorinated biphenyls. J Pediatr. 2002;140:33–9. doi: 10.1067/mpd.2002.120764. [DOI] [PubMed] [Google Scholar]
- Karmaus W, et al. Maternal levels of dichlorodiphenyl-dichloroethylene (DDE) may increase weight and body mass index in adult female offspring. Occup Environ Med. 2009;66:143–9. doi: 10.1136/oem.2008.041921. [DOI] [PubMed] [Google Scholar]
- Kelce WR, et al. Persistent DDT metabolite p,p’-DDE is a potent androgen receptor antagonist. Nature. 1995;375:581–5. doi: 10.1038/375581a0. [DOI] [PubMed] [Google Scholar]
- Kuczmarski RJ, et al. CDC growth charts: United States. Adv Data. 2000:1–27. [PubMed] [Google Scholar]
- Lawson DW, Mace R. Sibling configuration and childhood growth in contemporary British families. Int J Epidemiol. 2008;37:1408–21. doi: 10.1093/ije/dyn116. [DOI] [PubMed] [Google Scholar]
- Lei DL, et al. Risk of linear growth retardation during the first two years of life: a new approach. Eur J Clin Nutr. 1999;53:456–60. doi: 10.1038/sj.ejcn.1600776. [DOI] [PubMed] [Google Scholar]
- Longnecker MP, et al. In utero exposure to the antiandrogen 1,1-dichloro-2,2-bis(p-chlorophenyl)ethylene (DDE) in relation to anogenital distance in male newborns from Chiapas, Mexico. Am J Epidemiol. 2007;165:1015–22. doi: 10.1093/aje/kwk109. [DOI] [PMC free article] [PubMed] [Google Scholar]
- Longnecker MP, et al. Serial levels of serum organochlorines during pregnancy and postpartum. Arch Environ Health. 1999;54:110–4. doi: 10.1080/00039899909602244. [DOI] [PubMed] [Google Scholar]
- Malina RM, et al. Vital and Health Statistics, series 11: Data from the National Health Survey. National Center for Health Statistics; Rockville, MD: 1974. Body Dimensions and Proportions, White and Negro Children 6-11 Years, United States, 1963-65; p. 67. [PubMed] [Google Scholar]
- Martin RM, et al. Associations of adiposity from childhood into adulthood with insulin resistance and the insulin-like growth factor system: 65-year follow-up of the Boyd Orr Cohort. J Clin Endocrinol Metab. 2006;91:3287–95. doi: 10.1210/jc.2006-0745. [DOI] [PubMed] [Google Scholar]
- Osuna-Ramirez I, et al. Body mass index and body image perception in a Mexican adult population: the accuracy of self-reporting (Spanish) Salud Publica Mex. 2006;48:94–103. doi: 10.1590/s0036-36342006000200003. [DOI] [PubMed] [Google Scholar]
- Patterson DG, Jr., et al. Determination of specific polychlorinated dibenzo-p-dioxins and dibenzofurans in blood and adipose tissue by isotope dilution-high-resolution mass spectrometry. IARC Sci Publ. 1991:299–342. [PubMed] [Google Scholar]
- Pelletier DL, et al. Epidemiologic evidence for a potentiating effect of malnutrition on child mortality. Am J Public Health. 1993;83:1130–3. doi: 10.2105/ajph.83.8.1130. [DOI] [PMC free article] [PubMed] [Google Scholar]
- Prentice A, et al. Impaired growth in infants born to mothers of very high parity. Hum Nutr Clin Nutr. 1987;41:319–25. [PubMed] [Google Scholar]
- Rabe-Hesketh S, Skrondal A. Multilevel and Longitudinal Modeling Using Stata. Stata Press; College Station, TX: 2008. [Google Scholar]
- Reiter EO, Rosefeld RG. Normal and Aberrant Growth. In: Larsen PR, et al., editors. Williams textbook of endocrinology. Saunders; Philadelphia, PA: 2003. pp. 1003–1114. [Google Scholar]
- Reyes H, et al. The family as a determinant of stunting in children living in conditions of extreme poverty: a case-control study [electronic article] BMC Public Health. 2004;4:10. doi: 10.1186/1471-2458-4-57. [DOI] [PMC free article] [PubMed] [Google Scholar]
- Reyes ME, et al. Urban-rural contrasts in the growth status of school children in Oaxaca, Mexico. Ann Hum Biol. 2003;30:693–713. doi: 10.1080/03014460310001612792. [DOI] [PubMed] [Google Scholar]
- Ribas-Fito N, et al. Prenatal exposure to 1,1-dichloro-2,2-bis (p-chlorophenyl)ethylene (p,p’-DDE) in relation to child growth. Int J Epidemiol. 2006;35:853–8. doi: 10.1093/ije/dyl067. [DOI] [PubMed] [Google Scholar]
- Rivera-Dommarco J, et al. Stunting and emaciation in children under 5 in distinct regions and strata in Mexico (Spanish) Salud Publica Mex. 1995;37:95–107. [PubMed] [Google Scholar]
- Roberts DR, et al. DDT house spraying and re-emerging malaria. Lancet. 2000;356:330–2. doi: 10.1016/s0140-6736(00)02516-2. [DOI] [PubMed] [Google Scholar]
- Rogan WJ, Chen A. Health risks and benefits of bis(4-chlorophenyl)-1,1,1-trichloroethane (DDT) Lancet. 2005;366:763–73. doi: 10.1016/S0140-6736(05)67182-6. [DOI] [PubMed] [Google Scholar]
- Rogan WJ, et al. Polychlorinated biphenyls (PCBs) and dichlorodiphenyl dichloroethene (DDE) in human milk: effects on growth, morbidity, and duration of lactation. Am J Public Health. 1987;77:1294–7. doi: 10.2105/ajph.77.10.1294. [DOI] [PMC free article] [PubMed] [Google Scholar]
- Rogan WJ, Gladen BC, McKinney JD, et al. Polychlorinated biphenyls (PCBs) and dichlorodiphenyl dichloroethene (DDE) in human milk: effects of maternal factors and previous lactation. Am J Public Health. 1986;76:172–7. doi: 10.2105/ajph.76.2.172. [DOI] [PMC free article] [PubMed] [Google Scholar]
- Romano-Riquer SP, et al. Reliability and determinants of anogenital distance and penis dimensions in male newborns from Chiapas, Mexico. Paediatr Perinat Epidemiol. 2007;21:219–28. doi: 10.1111/j.1365-3016.2007.00810.x. [DOI] [PMC free article] [PubMed] [Google Scholar]
- Saady JJ, Poklis A. Determination of chlorinated hydrocarbon pesticides by solid-phase extraction and capillary GC with electron capture detection. J Anal Toxicol. 1990;14:301–4. doi: 10.1093/jat/14.5.301. [DOI] [PubMed] [Google Scholar]
- Sadasivaiah S, et al. Dichlorodiphenyltrichloroethane (DDT) for indoor residual spraying in Africa: how can it be used for malaria control? Am J Trop Med Hyg. 2007;77:249S–63S. [PubMed] [Google Scholar]
- Schapira A. DDT: a polluted debate in malaria control. Lancet. 2006;368:2111–3. doi: 10.1016/S0140-6736(06)69812-7. [DOI] [PubMed] [Google Scholar]
- Singer JD, Willett JB. Modeling Change and Event Occurrence. OXFORD University Press; New York, NY: 2003. Applied Longitudinal Data Analysis. [Google Scholar]
- Skidmore PM, et al. Life course body size and lipid levels at 53 years in a British birth cohort. J Epidemiol Community Health. 2007;61:215–20. doi: 10.1136/jech.2006.047571. [DOI] [PMC free article] [PubMed] [Google Scholar]
- Smink A, et al. Exposure to hexachlorobenzene during pregnancy increases the risk of overweight in children aged 6 years. Acta Paediatr. 2008;97:1465–9. doi: 10.1111/j.1651-2227.2008.00937.x. [DOI] [PubMed] [Google Scholar]
- Smith G. Chlorinated hydrocarbon insecticides. In: Hayes WJJ, Laws ERJ, editors. Handbook of Pesticide Toxicology: Classes of Pesticides. Academic Press; San Diego, CA: 1991. pp. 731–915. [Google Scholar]
- Sorensen TI, et al. The accuracy of reports of weight: children’s recall of their parents’ weights 15 years earlier. Int J Obes. 1983;7:115–22. [PubMed] [Google Scholar]
- Stata Corporation . Stata statistical software, release 10.1. Stata Corporation; College Station, TX: 2009. [Google Scholar]
- Trejo-Acevedo A, et al. Exposure assessment of persistent organic pollutants and metals in Mexican children. Chemosphere. 2009;74:974–80. doi: 10.1016/j.chemosphere.2008.10.030. [DOI] [PubMed] [Google Scholar]
- Turusov V, et al. Dichlorodiphenyltrichloroethane (DDT): ubiquity, persistence, and risks. Environ Health Perspect. 2002;110:125–8. doi: 10.1289/ehp.02110125. [DOI] [PMC free article] [PubMed] [Google Scholar]
- Ulijaszek SJ, Kerr DA. Anthropometric measurement error and the assessment of nutritional status. Br J Nutr. 1999;82:165–77. doi: 10.1017/s0007114599001348. [DOI] [PubMed] [Google Scholar]
- UNEP Stockholm Convention on Persistent Organic Pollutants (POPs). DDT register. 2009 Available: http://chm.pops.int/Programmes/DDT/DDTregister/tabid/456/language/en-US/Default.aspx UN Environment Programme.
- Verhulst SL, et al. Intrauterine exposure to environmental pollutants and body mass index during the first 3 years of life. Environ Health Perspect. 2009;117:122–6. doi: 10.1289/ehp.0800003. [DOI] [PMC free article] [PubMed] [Google Scholar]
- Viner RM, et al. Childhood body mass index (BMI), breastfeeding and risk of Type 1 diabetes: findings from a longitudinal national birth cohort. Diabet Med. 2008;25:1056–61. doi: 10.1111/j.1464-5491.2008.02525.x. [DOI] [PubMed] [Google Scholar]
- Waliszewski SM, et al. Carry-over of persistent organochlorine pesticides through placenta to fetus. Salud Publica Mex. 2000;42:384–90. doi: 10.1590/s0036-36342000000500003. [DOI] [PubMed] [Google Scholar]
- Wells JC. The programming effects of early growth. Early Hum Dev. 2007;83:743–8. doi: 10.1016/j.earlhumdev.2007.09.002. [DOI] [PubMed] [Google Scholar]
- Whitaker RC. Predicting preschooler obesity at birth: the role of maternal obesity in early pregnancy [electronic article] Pediatrics. 2004;114:e29–36. doi: 10.1542/peds.114.1.e29. [DOI] [PubMed] [Google Scholar]
- WHO . Physical Status: The Use and Interpretation of Anthropometry. Technical Report Series: anthropometry, health status indicators, nutrition assessment. World Health Organization, Expert Committe on Physical Status; Geneva, Switzerland: 1995. p. 439. [PubMed] [Google Scholar]
- Wolff MS, et al. Pharmacokinetic variability and modern epidemiology--the example of dichlorodiphenyltrichloroethane, body mass index, and birth cohort. Cancer Epidemiol Biomarkers Prev. 2007;16:1925–30. doi: 10.1158/1055-9965.EPI-07-0394. [DOI] [PubMed] [Google Scholar]
Associated Data
This section collects any data citations, data availability statements, or supplementary materials included in this article.