

Abstract
The photodecomposition of cis,trans,cis-[PtIV(N3)2(OH)2(NH3)2] in phosphate buffered saline (PBS), as well as in the presence of 1-methylimidazole (1-MeIm), induced by UVA light (centered at λ = 365 nm) has been studied by multinuclear NMR spectroscopy. We show that photoreduction, photoisomerisation and trans-labilization pathways are involved. The photodecomposition pathway in PBS which involves azide release, as detected by 14N NMR spectroscopy, appears to differ from that in acidic aqueous conditions, where N2 is a product. A number of trans-{N-PtII-NH3} species were also observed as photoproducts, as well as the release of free ammonia with a corresponding increase in pH. Oxygen was also detected as a product in solution. In the presence of 1-methylimidazole, surprisingly the major photoproduct was the tetra-substituted PtII complex [PtII(1-MeIm-N3)4]2+ (structure confirmed by crystallography), even at a Pt:1-MeIm molar ratio of 1:1, together with cis- and trans-[PtII(NH3)2(1-MeIm-N3)2]2+ as minor products. In these photoinduced 1-MeIm reactions, free ammonia, azide and oxygen were also detected. The results from this study illustrate that photoinduced reactions of platinum complexes can lead to novel reaction pathways, and therefore to new cytotoxic mechanisms in cancer cells.
Introduction
Photoactivation provides an interesting mechanism for reduction of PtIV to PtII. PtIV complexes can be made photolabile by choosing appropriate ligands, for example PtIV-azido complexes are well-known to be photoactive.[1,2] Such platinum complexes can then undergo a variety of photochemical reactions, including isomerization, substitution and reduction. A possible application of such processes is for therapeutic purposes and the development of light-sensitive PtIV pro-drugs that can be photoactivated (e.g. with laser light) to active antitumor agents directly at the site of the tumor.[3,4] Such site-selective activation would be expected to lead to a decrease in side-effects and toxicity, and an increase in the therapeutic index. Hence, the clinical usefulness of platinum antitumor agents might be expanded. Therefore, we have developed a series of complexes of the form [PtIV(N3)2(OH)2(amine)2], such as cis,trans,cis-[PtIV(N3)2(OH)2(NH3)2] (1) which exhibit little or no dark toxicity, but bind to DNA upon photoactivation.[3,4]
Transcription mapping studies with treated plasmid DNA have shown that the platination sites resemble those from reaction with cisplatin (2) in dark conditions.[5] However, these complexes appear to kill cancer cells via a mechanism different from those of the classical platinum-based drugs.[6,7] In the photoreduction of PtIV-diazido precursors to their PtII counter-parts, a possible mechanism involves the release of azido ligands as N3• radicals. Azidyl radicals are very unstable and rapidly decompose in water into molecular nitrogen (N2), thus preventing reoxidation of the platinum center (Scheme 1).[8]
Scheme 1.

Possible mechanism for the photoreduction of PtIV-diazido complexes.
We report here studies of the photodecomposition pathways in phosphate buffered saline (PBS) solution of complex 1 both on its own and in the presence of the nitrogen heterocycle 1-methylimidazole (1-MeIm). Imidazole fragments are an important part of purines, such as guanosine, xanthine, theophylline, 8-methylcaffeine, and histidyl residues in proteins. For example, in the enzyme carbonic anhydrase, the active site involves coordination of ZnII to the imidazole ring nitrogen of histidine,[9] and in the serine proteases, the pH-dependent protonation-deprotonation of the imidazole ring of histidine plays an important role in the mechanism of peptide bond cleavage.[10] In addition to inter- and intrastrand crosslinks with DNA (involving especially binding to N7 of guanine bases), PtII complexes also form DNA-protein crosslinks involving histidine-, cysteine- and methionine-rich proteins.[11-13] Thus, 1-methylimidazole is a useful model for studies of photoinduced reactions of these PtIV-diazido complexes.
In particular, we have used here multinuclear NMR methods, including 14N NMR spectroscopy, to track photoreaction pathways involving the azido ligands. The elucidation of such photochemical pathways aids the understanding of the biological mechanism of action for this group of complexes.
Results
Photochemical behavior of complex 1 in PBS solution
First, we recorded a 1D 14N{1H} NMR spectrum of the unlabelled complex 1 in PBS solution in dark conditions (Figure 1a). Peaks a (353.3 ppm), b (227.4 ppm) and c (160.5 ppm) are assigned to the terminal, central and PtIV-bound nitrogen atoms, respectively, of the coordinated azido ligands. The upfield peak d at −40.8 ppm (1J(195Pt-14N) = 180 Hz) is consistent with an ammine ligand bound to a PtIV metal center trans to a nitrogen donor ligand.[14] Upon irradiation of the sample with UVA light for 10 min (λmax = 365 nm, P = 7.3 mW cm−2 (P = power level), dose = 4.4 J cm−2) at 310 K, new 14N signals appeared (Figure 1b). Peaks a (353.4 ppm), b (227.5 ppm) and c (161.1 ppm) for the azido ligands of 1 were still present but with reduced intensities, and the new peaks a’ (76.9 ppm) and b’ (225.7 ppm) appeared which are assignable to the terminal and central nitrogen atoms of free azide (N3−) in solution, in accordance with literature data.[15] New peaks d’ (−40.9 ppm) and d” (−50.8 ppm) are assignable to ammine groups coordinated to a PtIV center trans to nitrogen and oxygen donor ligands, respectively.[14] Intriguingly, no peaks for either N2 (sharp peak expected at ca. 287 ppm[15]) or for PtII-NH3 species (expected in the range −60 to −90 ppm)[14] were observed. Remarkably, similar results were obtained upon irradiation at 310 K with either UVA light for 2 h at a much lower power (λmax = 365 nm, P = 0.6 mW cm−2, dose = 4.5 J cm−2), or with UV-Visible light (λ = 250-700 nm) for 6 h (P = 30.0 mW cm−2, dose = 648.0 J cm−2) (data not shown).
Figure 1.

1D 14N{1H} NMR spectra of complex 1 (12.6 mm in 90% PBS/10% D2O, Ar-saturated, initial pH 7.4) a) in the dark, b) after 10 min of irradiation (λmax = 365 nm, P = 7.3 mW cm−2, dose = 4.4 J cm−2) at 310 K, c) after 2 h of irradiation (λmax = 365 nm, P = 7.3 mW cm−2, dose = 56.6 J cm−2, final pH 10.1) at 310 K. d) 1D 14N{1H} NMR spectrum of complex 15N2-1 (14.8 mm in 90% H2O/10% D2O, Ar-saturated, initial pH 7.4) after 2 h of irradiation (λmax = 365 nm, P = 7.2 mW cm−2, dose = 52.0 J cm−2, final pH 9.9) at 310 K.
Assignments: a, b, c, coordinated azido ligand (δ = 353.3 (PtIV-NNN), 227.4 (PtIV-NNN), 160.5 ppm (PtIV-NNN)) as labeled in structure; a’, b’, free azide (N3−; δ = 76.9 (NNN), 225.7 ppm (NNN)); d, chemical shift consistent with t-{N-PtIV-NH3} species (δ = −40.8 ppm); d’, d”, chemical shifts consistent with t-{N/O-PtIV-NH3} species (δ = −40.9 ppm, −50.8 ppm); e’, free ammonia (NH3; δ = −20.9 ppm); f’, chemical shift consistent with t-{N/O-PtII-NH3} species (δ = −69.6 ppm).
When UVA irradiation was prolonged for 2 h, the final pH of the solution increased to 10.1 (despite the initial attempt to buffer the solution with 10 mm phosphate), and no 14N peaks assignable to either coordinated azides or N2 were detected. The two new sharp signals at 77.0 ppm (a’) and 225.6 ppm (b’) (Figure 1c) are due to the terminal and central nitrogen atoms, respectively, of free N3− in solution, whereas the chemical shift of peak f’ (−69.6 ppm) is consistent with an NH3-PtII fragment trans to N- and/or O-donor ligands (broad, perhaps due to overlapping peaks).[14] Finally, new peak e’ (−20.9 ppm) is due to the presence of free ammonia in solution, consistent with the increase of pH upon irradiation. Some precipitate formed during the photoreaction and is likely to arise from polymeric hydroxo-/oxo-bridged Pt species, which arise partly as a result of ammonia release, hydrolysis and deprotonation of aqua/hydroxo ligands.[16]
A similar experiment was carried out using the 15NH3-labelled analogue of complex 1 (15N2-1). The 1D 14N{1H} NMR spectrum of 15N2-1 (14.8 mm in 90% PBS/10% D2O, Ar-saturated, initial pH 7.4) obtained after 2 h of irradiation (λmax = 365 nm, P = 7.2 mW cm−2, dose = 52.0 J cm−2) at 310 K is shown in Figure 1d. Again, the pH increased (to 9.9), insoluble precipitate formed during the photoreaction, and the two new peaks (a’ and b’) due to free azide in solution were detected. As expected, no 14N NMR signals assignable to Pt-NH3 moieties were detected, as the coordinated ammine groups were 15N-labelled. After performing 14N NMR experiments, the pH of the solution was re-adjusted to 3.1 with dilute HClO4 to ensure slow exchange of NH protons, and 1D 1H and 2D [1H,15N] HSQC NMR experiments were carried out. Only one major PtII-ammine species was detected at δ(1H/15N) = 4.05/−68.7 ppm (1J(15N-H) = 72 Hz, 1J(195Pt-15N) = 282 Hz, 2J(195Pt-H) = 56 Hz), which is consistent with a trans-{PtII(NH3)2} fragment.[17,18] This suggests that photoisomerization can accompany the main photoreduction process, and no other PtII or PtIV species were observed. In addition, a new peak at δ(1H/15N) = 7.12/−1.90 ppm was detected, assignable to free 15NH4+ in solution, which is consistent with the release of some 15N-labelled ammine ligands upon irradiation. The possible formation of Pt-phosphate adducts was ruled out by performing 1D 31P{1H} NMR experiments, in which only one 31P signal was observed at 1.2 ppm due to the free buffer itself. Remarkably, very similar results were obtained when the photoreactions were carried out in phosphate buffer in the absence of Cl− ions, thus ruling out the formation of Pt-chlorido derivatives and the possible role of chlorides in the photoredox process (data not shown).
Evolution of oxygen upon UVA irradiation of complex 1
In order to explore other potential photoreduction pathways, we investigated the possible evolution of gaseous dioxygen after irradiation by means of a Po2 electrode. A 10.56 mm solution of complex 1 in PBS solution (initial pH 7.4) was Ar-saturated for 30 min and irradiated for 2 h (λmax = 365 nm, P = 6.3 mW cm−2, dose = 45.6 J cm−2) at 310 K. After irradiation, the pH increased to 10.0 and a Po2 value of 64 mmHg was recorded.
Photochemical behavior of complex 1 in PBS solution in presence of 1-methylimidazole
First we studied the pH dependence of the 14N NMR shifts of 1-methylimidazole (1-MeIm). The imidazole ring is a particularly important constituent of biological systems (e.g. a histidyl side chain in proteins) primarily because of its acid-base equilibrium with a unique pKa value (7.1) near to neutrality in aqueous solution.[19] This gives the imidazole ring the capability, in many biological fluids, of acting as a proton donor or acceptor and, perhaps most importantly, as a ligand which can coordinate to metal ions.
14N NMR shifts for N1 and N3 of 1-methylimidazole in aqueous solution as a function of pH are plotted in Figure 2a. As expected, protonation of 1-methylimidazole at N3 produces a large shift of the N3 resonance (ca. 71 ppm upfield) and a comparatively small shift of N1 resonance (ca. 7 ppm downfield) relative to the deprotonated species. The pKa of 7.15 ± 0.06 is in good agreement with the reported value of 7.2.[19] At low pH, 14N1 and 14N3 resonances essentially superimpose, as well as the 1H NMR peaks of H4 and H5 protons (Figure 2b), in agreement with reported data.[19]
Figure 2.
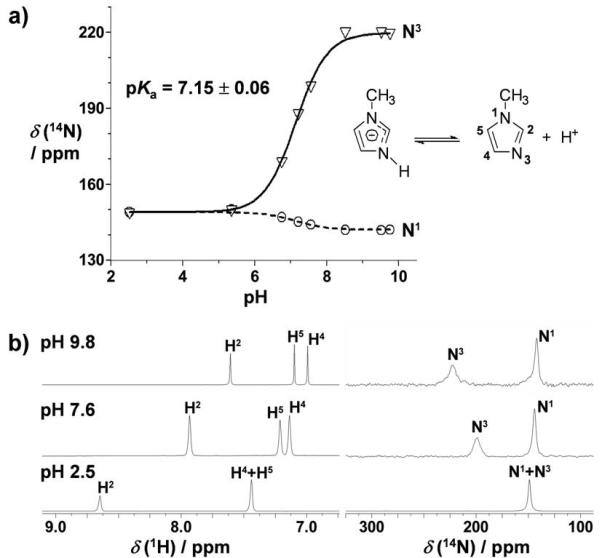
a) pH dependence of 14N NMR shifts of N1 and N3 of 1-methylimidazole. The pKa value was determined as described in the Experimental Section. b) Representative 1D 1H and 14N{1H} NMR spectra of 1-methylimidazole (62.7 mm in 90% H2O/10% D2O) at pH 2.5, 7.6 and 9.8.
The interaction between the 15N-labelled analogue of complex 1 (15N2-1) and 1-methylimidazole in PBS solution was investigated. A 8.6 mm solution of 15N2-1 in 90% PBS/10% D2O was prepared and 1-methylimidazole added (molar ratio = 1:1.02) at a starting pH of 8.7 (no adjustment). After degassing the solution with Ar for 30 min, the sample was irradiated for 2 h (λmax = 365 nm, P = 6.4 mW cm−2, dose = 46.1 J cm−2) at 310 K, and the photoproducts were characterized by NMR spectroscopy. The solution, initially pale yellow, turned colorless after irradiation, and no precipitate formed. As already observed after irradiating complex 15N2-1 on its own, the pH increased to 10.2. In the 1D 14N{1H} NMR spectrum, several signals were detected. The two new sharp signals at 77.0 ppm (a’) and 225.7 ppm (b’) (Figure 3) are due to the terminal and central nitrogen atoms of free N3− in solution, respectively, whereas new peaks g (221.1 ppm) and h (141.9) are assigned to the N3 and N1 atoms of free 1-methylimidazole. The new broad signal i in the range 150-123 ppm is assignable to the N3 and N1 atoms of Pt-coordinated 1-methylimidazole. As previously observed, no peaks assignable to either coordinated azides or N2 were detected. On the contrary, evolution of gaseous dioxygen was again detected potentiometrically soon after irradiation, giving a Po2 value of 50 mmHg.
Figure 3.

1D 14N{1H} NMR spectrum of complex 15N2-1 (8.6 mm) in presence of 1-methylimidazole (molar ratio 1:1.02) in 90% PBS/10% D2O (Ar-saturated, initial pH 8.7) after 2 h of irradiation (λmax = 365 nm, P = 6.4 mW cm−2, dose = 46.1 J cm−2, final pH 10.2) at 310 K.
Assignments: a’, b’, free azide (N3−) in solution (δ = 77.0 (NNN,), 225.7 ppm (NNN,)); g (N3), h (N1), free 1-methylimidazole in solution (δ = 221.1, 141.9 ppm); i, broad signal indicating N3 and N1 atoms of Pt-coordinated 1-methylimidazole (δ = 150-123 ppm).
Six different 1-methylimidazole-containing species were detected with the aid of 1D 1H (Figure 4), 2D [1H,1H] NOESY (Figure 5), [1H,13C] HSQC, and [1H,15N] HMBC (Figure 6) NMR spectroscopy. Their chemical shifts are summarized in Table 1. The major species (γ) can be identified as [PtII(1-MeIm-N3)4]2+, supported by the X-ray structure of crystals obtained under similar experimental conditions (see Supporting Information). The crystal structure of this complex has been reported previously by Clement and co-workers (CCDC ref. code: HIGVUO01).[20] The presence of ClO4− as the counter-ion arises from the use of perchloric acid for pH adjustment. This square-planar complex contains PtII coordinated to four 1-methylimidazole ligands via N3. The crystallographic data (Space group P −1, a = 8.07470(10) Å, b = 9.12370(10) Å, c = 9.3090(2) Å, α = 71.9540(10)°, β = 65.9410(10)°, γ = 83.3230(10)°) are in close agreement with the published data. Species α and β can be assigned to trans- and cis-[PtII(NH3)2(1-MeIm-N3)2]2+, respectively,[21-23] whereas the minor species δ and ε have not been identified. For comparison purposes, each of the three identified PtII species (α, β and γ) were synthesized individually, according to literature procedures,[24] and their NMR spectra (Figures S1-S4) compared to the peaks in the spectrum of the irradiated solution. The presence of all three species was confirmed via this method (see Table 1 for chemical shift assignments). Surprisingly, unreacted 1-methylimidazole (ζ) was detected as a major component of the investigated solution, even though the reactants were mixed in a 1:1 molar ratio. The large upfield shift of the 15N3 resonance (ca. 90 ppm, compared to δ(15N3) of free 1-methylimidazole at 221.08 ppm) observed for all the new 1-methylimidazole species is consistent with coordination of 1-methylimidazole to platinum taking place via the N3 atom.[25] The possible coordination of phosphates from the buffer was also ruled out, as in the 1D 31P{1H} NMR spectrum only one peak was detected at 3.84 ppm, arising from the PBS solution itself.
Figure 4.

1D 1H NMR spectrum of complex 15N2-1 (8.6 mm) in presence of 1-methylimidazole (molar ratio 1:1.02) in 90% PBS/10% D2O (Ar-saturated, initial pH 8.7) after 2 h of irradiation (λmax = 365 nm, P = 6.4 mW cm−2, dose = 46.1 J cm−2, final pH 10.2) at 310 K. See Table 1 for species assignment.
Figure 5.

Part of the 2D [1H,1H] NOESY NMR spectrum of complex 15N2-1 (8.6 mm) in presence of 1-methylimidazole (molar ratio 1:1.02) in 90% PBS/10% D2O (Ar-saturated, initial pH 8.7) after 2 h of irradiation (λmax = 365 nm, P = 6.4 mW cm−2, dose = 46.1 J cm−2, final pH 10.2) at 310 K. See Table 1 for species assignment.
Figure 6.

2D [1H,15N] HMBC NMR spectrum of complex 15N2-1 (8.6 mm) in presence of 1-methylimidazole (molar ratio 1:1.02) in 90% PBS/10% D2O (Ar-saturated, initial pH 8.7) after 2 h of irradiation (λmax = 365 nm, P = 6.4 mW cm−2, dose = 46.1 J cm−2, final pH 10.2) at 310 K. See Table 1 for species assignment.
Table 1.
1H, 13C and 15N chemical shifts of the peaks produced after 2 h of irradiation (λmax = 365 nm, P = 6.4 mW cm−2, dose = 46.1 J cm−2, 310 K) of complex 15N2-1 (8.6 mm) in presence of 1-methylimidazole (molar ratio 1:1.02) in 90% PBS/10% D2O (Ar-saturated, pH 8.7 (initial)/10.2 (final)), and of the individually synthesized PtII-(1-MeIm) complexes (see Figures 4, 5, 6 and Supporting Information)
| Detected Species | Chemical shift [ppm] |
|||||
|---|---|---|---|---|---|---|
| δ(CH3/CH3) | δ(C2H/C2H) | δ(C4H/C4H) | δ(C5H/C5H) | δ(N1) | δ(N3) | |
| α(t-[PtII(NH3)2(1-MeIm-N3)2]2+) | 3.78/35.02 | 7.99/140.01 | 7.14/128.94 | 7.23/123.47 | 146.42 | 127.48 |
| β(c-[PtII(NH3)2(1-MeIm-N3)2]2+) | 3.76/34.96 | 7.83/139.53 | 7.02/127.57 | 7.16/122.04 | 144.86 | n.d. |
| γ([Pt(1-MeIm-N3)4]2+) | 3.73/35.04 | 7.76/140.08 | 6.85/128.87 | 7.15/123.13 | 146.03 | 131.09 |
| δ | 3.68/34.89 | 7.71/140.02 | 6.87/129.56 | 7.08/122.92 | n.d. | n.d. |
| ε | 3.67/34.99 | 7.64/139.23 | 6.76/128.32 | 7.07/122.98 | 145.35 | 133.82 |
| ζ(1-MeIm) | 3.72/33.73 | 7.63/139.40 | 7.01/128.26 | 7.12/122.10 | 141.74 | 221.08 |
|
| ||||||
| Synthesized Complexes* | ||||||
|
| ||||||
| t-[PtII(NH3)2(1-MeIm-N3)2]2+ | 3.82/35.03 | 8.05/139.94 | 7.19/129.00 | 7.26/123.51 | - | - |
| c-[PtII(NH3)2(1-MeIm-N3)2]2+ | 3.73/34.96 | 7.78/139.55 | 7.04/128.55 | 7.16/123.19 | - | - |
| [Pt(1-MeIm-N3)4]2+ | 3.73/35.04 | 7.77/139.93 | 6.86/128.81 | 7.16/123.05 | - | - |
In D2O.
Once the pH of the investigated sample was re-adjusted to 2.6, 1D 1H and 2D [1H,15N] HSQC NMR experiments were carried out. Based on chemical shifts (Table 2),[14] five peaks assignable to PtII species were detected, all consistent with coordinated NH3 groups trans to N-donor ligands. In agreement with results obtained by irradiating complex 15N2-1 on its own under the same experimental conditions, there was no evidence of PtIV-ammine species, and free 15NH4+ in solution was detected (δ(1H/15N) = 7.12/−1.90 ppm), due to the release of ammine ligands upon irradiation.
Table 2.
1H and 15N chemical shifts and assignments of the Pt-NH3 peaks produced after 2 h of irradiation (λmax = 365 nm, P = 6.4 mW cm−2, dose = 46.1 J cm−2, 310 K) of complex 15N2-1 (8.6 mm) in presence of 1-methylimidazole (molar ratio 1:1.02) in 90% PBS/10% D2O (Ar-saturated, pH 8.7 (initial)/10.2 (final; re-adjusted to 2.6)). Data obtained from a 2D [1H,15N] HSQC NMR experiment.
| Chemical shifts [ppm] |
Assignment | |
|---|---|---|
| δ(1H) | δ(15N) | |
| 4.23 | −67.00 | t-{N-PtII-15NH3} |
| 4.05 | −65.05 | t-{N-PtII-15NH3} |
| 4.04 | −65.12 | t-{N-PtII-15NH3} |
| 4.25 | −63.45 | t-{N-PtII-15NH3} |
| 4.04 | −61.46 | t-{N-PtII-15NH3} |
|
| ||
| 7.12 | −1.90 | 15NH4+ |
Discussion
The NMR spectroscopic data obtained during photoactivation of complex 1 allow reaction pathways to be proposed (Scheme 2). According to the literature, in addition to photoredox processes, azido complexes can undergo photosubstitution reactions in which the azido ligand is substituted, e.g. by a solvent molecule.[8] This is in agreement with the 14N spectrum of 1 in PBS recorded after only 10 min of irradiation with UVA light (Figure 1b), in which the detected 14N NMR signals are consistent with the presence of PtIV species of the type cis,trans,cis-[PtIV(N3)(H2O/OH)(OH)2(NH3)2] and free N3−. Thus, the first step of such photoreactions under these conditions appears to be the release of at least one azido ligand, followed by its replacement with a water molecule which deprotonates on coordination due to the increase in pH of the solution. However, we cannot rule out the simultaneous and/or subsequent release of, at least, one ammine ligand before reduction of PtIV to PtII takes place. A reported study of [M(N3)(NH3)5]2+, where M = Cr or Co,[26-28] found that the first photochemical step is the formation of trans-[M(N3)(H2O)(NH3)4]2+ caused by the photolabilization of the ammine ligand trans to N3− due to a strong trans-effect of the azido ligand. Thus, depending on the experimental conditions, the generated aqua complexes may undergo subsequent redox (M = Co) or substitution (M = Cr) reactions. Also, it has been reported recently that the photoreduction of some PtIV-dichlorotetrammine complexes is accompanied by the release of ammonia.[29] In our case, the loss of ammine ligands has been widely confirmed by NMR spectroscopy, thus explaining the formation of insoluble hydroxo-/oxo-bridged polymerized species and the increase of basicity. It is surprising that although photoreduction of the starting PtIV-diazido complexes in PBS solution occurs, the azido ligands are not oxidized to N2. This behavior differs from that observed previously in which irradiation of complex 1 in acidic aqueous solution led to several PtII species together with the evolution of gaseous dinitrogen via the formation of nitrene intermediates.[30] This emphasizes that the observed photoreaction pathways are highly dependent on the solution conditions.
Scheme 2.
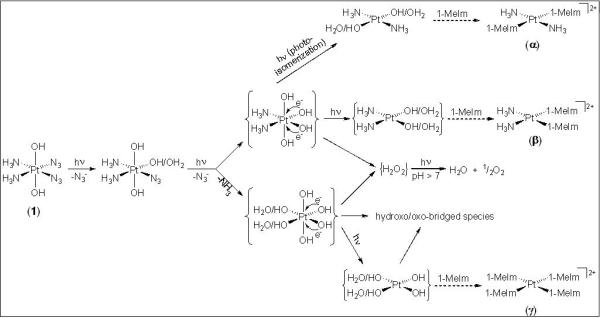
Possible pathways for photoreactions of complex 1 in PBS. Dashed arrows refer to reactions in presence of 1-methylimidazole, and curly brackets are used to denote transient intermediates. The photodecomposition pathways of 1 in acidic aqueous solution have been reported previously;[30] they involve not only photoreduction to PtII and O2 evolution, but N2 release via the formation of nitrene intermediates, in contrast to N3− release as detected in the present work.
After replacement of both azido ligands, photoreduction may occur by one-electron transfers from each of two hydroxo groups coordinated to the PtIV center leading to the corresponding PtII species together with the formation of hydroxyl radicals. When generated at high local concentrations, hydroxyl radicals readily dimerize to H2O2.[31] On irradiation with UV light, hydrogen peroxide is known to decompose by disproportionation to water and gaseous dioxygen (O2), with a maximum rate at pH = 11.6.[32] After each irradiation experiment, the solution was checked for hydrogen peroxide content by means of peroxide test sticks, but no H2O2 was detected. However, since in our system pH increases to ca. 10.1 on irradiation, the decomposition of hydrogen peroxide is expected to be favored. Although the evolution of O2 was only measured qualitatively, the experimental evidence does support the hypothesis of the involvement of reactive oxygen-containing species (as shown in Scheme 2), which are subsequently oxidized to O2 while PtIV complexes are reduced to the corresponding PtII photoproducts. The detection of O2 as a photoproduct suggests that a variety of photodecomposition pathways in additions to that shown in Scheme 1 can occur, depending on the actual experimental conditions.
Finally, it is worth noting that on irradiation of complex 1 and its 15N-labelled analogue 15N2-1, the only detected PtII photoproduct has NMR parameters consistent with a trans-diammine species. This could result from photoisomerization processes which lead to the formation of the more thermodynamically stable trans isomer. On absorption of a photon, some complexes may undergo rearrangement of their structure. Photoisomerization of PtIV-am(m)ine compounds has been previously observed;[29,33,34] in addition, a number of photoisomerizations of PtII complexes, including cis-[PtII(N3)2(PPh3)2] and cis-[PtCl2(N-amp)2] (amp = diethyl aminomethylphosphonate), are known to occur from an excited state by a twisting mechanism, i.e. without bond-breaking and bond-forming.[35,36] Our experimental evidence does not show whether cis to trans conversion occurs before or after reduction takes place.
It is intriguing that when irradiation studies of complex 1 were carried out in the presence of 1 molar equivalent of 1-methylimidazole, unreacted 1-methylimidazole was still present in the final solution. If the first step of the investigated photoreaction involves the replacement of the azido ligands with water molecules, then the subsequent photoreduction process would lead to the formation of PtII-aqua species. Given that in our system the pH increases to 10.2 on irradiation, coordinated H2O molecules are expected to be readily deprotonated, thus leading to PtII species in which replacement of hydroxo ligands by free imidazole is unlikely to occur.[18,37] In fact, some of the peaks detected in the 2D [1H,15N] HSQC NMR spectrum might be assignable to PtII-hydroxo species containing trans-{PtII(NH3)2} fragments, thus accounting for the lack of coordination by the free 1-methylimidazole. The fact that a major photoproduct is [PtII(1-MeIm-N3)4]2+, confirms the high affinity of complex 1 toward imidazole rings upon irradiation, and suggests that coordination by 1-methylimidazole and consequent replacement of the NH3 ligands is favored as long as the pH of the solution is low enough to give rise to coordinated aqua ligands which are easily substituted. However, our experimental evidence does not indicate whether coordination of 1-methylimidazole to platinum occurs before or after reduction takes place.
Conclusions
PtIV-diazido complexes show promise as anticancer agents. They are relatively non-toxic in the dark and can be photoactivated by light to produce new species which are cytotoxic to cancer cells by a novel mechanism of action.[6,7] This may involve the formation of unusual platinated lesions on DNA,[5,38] and initial work has shown that the rapid reactions with guanine derivatives can occur often with seemingly simple pathways in which PtII-guanine adducts are accompanied by the release of N2. However, it is also apparent that the reaction pathways which accompany these photoactivated processes are dependent on the solution conditions (e.g. pH, buffer); for example, nitrene intermediates can be trapped in the presence of dimethylsulfide.[30] In the present work, we have shown that photoinduced release of azide from cis,trans,cis-[PtIV(N3)2(OH)2(NH3)2] is facile in phosphate buffered saline solution, and that photoinduced isomerization can occur.
Our investigation of these reaction pathways has benefited from the use of 14N NMR spectroscopy (99.63% natural abundance, receptivity 1.0×10⁻³ relative to 1H). There are relatively few reports of the use of this technique in the study of platinum drugs in the literature.[39] The major drawback is 14N quadrupolar relaxation (14N nuclear spin (I) = 1), which dominates when the environment of 14N has a low symmetry and can lead to very broad lines. More commonly, 15N NMR (I = ½) has been employed in the study of platinum anticancer drugs, despite the low receptivity (3.85×10⁻⁶ relative to 1H), as for most compounds of interest 15N-labelled derivatives can be prepared from readily available starting materials.[14,37] A combination of these two NMR techniques has provided us with new insights into the mechanism of photoactivation and photodecomposition pathways.
Our work on photoinduced reactions of cis,trans,cis-[PtIV(N3)2(OH)2(NH3)2] in the presence of 1-methylimidazole suggests that histidyl side chains in proteins could be a target for attack in cells. Intriguingly, under the conditions of our experiments, ammonia release was readily observed together with O2 production, as well as azide displacement. The formation of the tetrakis adduct even at low Pt:1-methylimidazole ratios (1:1) was surprising and illustrates further that photoactivation can lead to unexpected reaction pathways. This is encouraging for the discovery of anticancer drugs with novel mechanisms of action, drugs which may not be cross-resistant to existing chemical agents.
Experimental Section
Materials
K2[PtIICl4] was purchased from Precious Metals Online; KI, NaN3, KOH, and NaCl from Fisher Scientific; AgNO3, NH4Cl, 15NH4Cl, 1-methylimidazole, phosphate buffered saline tablets (1 tablet in 200 mL of water: 0.01 m phosphate pH 7.4, 0.138 m NaCl, 0.0027 m KCl), 1,4-dioxane, and D2O from Sigma-Aldrich; H2O2 (30%) from Polabo; and HClO4 from Fisons.
Warning! Heavy metal azido complexes are known to be shock-sensitive detonators. We encountered no problems in this study, but these materials should be handled with extreme caution, especially not to put pressure on them in the crystalline form.
Syntheses
Complex cis,trans,cis-[PtIV(N3)2(OH)2(NH3)2] (1) and the corresponding 15N-ammine labeled analogue cis,trans,cis-[PtIV(N3)2(OH)2(15NH3)2] (15N2-1) were synthesized as previously described.[16,38] For 15N2-1 15NH4Cl was used as the source of 15N. Yield: 78-80%. 1H NMR (500.1 MHz, 90% H2O/10% D2O, pH 5.4, TSP): δ = 5.12 ppm (1J(15N-H) = 73 Hz, 2J(195Pt-H) = 46 Hz; PtIV-15NH3); 2D [1H,15N] HSQC NMR (500.1/50.7 MHz, 90% H2O/10% D2O, pH 5.4, 15NH4Cl): δ = −40.8 ppm (1J(195Pt-15N) = 261 Hz; PtIV-15NH3); 14N{1H} NMR (36.1 MHz, 90% PBS/10% D2O, pH 7.4, NH4Cl): δ = 353.3 (PtIV-NNN), 227.4 (PtIV-NNN), 160.5 (PtIV-NNN), −40.8 ppm (1J(195Pt-14N) = 180 Hz; PtIV-NH3).
Complexes cis-[PtII(NH3)2(1-MeIm-N3)2]Cl2, trans-[PtII(NH3)2(1-MeIm-N3)2]Cl2 and [PtII(1-MeIm-N3)4]Cl2 were synthesized according to literature procedures.[24] See Table 1 and Supporting Information for NMR characterization.
NMR spectroscopy
All NMR spectra were acquired in 90% PBS/10% D2O (unless otherwise stated) at 298 K on a Bruker DPX300 spectrometer with a QNP [1H,13C,19F,31P] probe head, a Bruker DPX400 spectrometer using a DUL [1H,13C] probe-head, a Bruker DMX500 spectrometer using a TBI [1H,13C,X] probe-head and a Bruker Avance 600 spectrometer using a TXI [1H,13C,15N] cryoprobe-head, all equipped with z-field gradients. Data processing was carried out using XWIN-NMR version 3.5 (DMX500 and Avance 600) Bruker U.K. Ltd.) and MestReC version 4.9.9.9 (Mestrelab Research S.L.).
Typical acquisition parameters for 1D 1H NMR spectra (1H: 400.12, 500.13 or 599.92 MHz): 16 transients, spectral width 7.5 kHz, using 32k data points and a delay time of 2.0 s. Water suppression was achieved using a 55.0 dB power level presaturation. Spectra were processed using exponential weighting with a resolution of 0.5 Hz and a line broadening threshold of 0.1 Hz.
Typical acquisition parameters for 1D 14N{1H} NMR spectra (14N: 36.13 MHz): 64k transients, spectral width 20 kHz, using 32k data points and a delay time of 0.25 s. Sequences were optimized for 1J(14N-H) = 60 Hz, and 1H decoupling was achieved using WALTZ16 pulse sequence. Spectra were processed using exponential weighting with a resolution of 0.6 Hz and a line broadening threshold of 10 Hz.
Typical acquisition parameters for 1D 13C{1H} PENDANT NMR spectra (13C: 100.60 MHz): 512 transients, spectral width 25 kHz, using 64k data points and a delay time of 2 s. Sequences were optimized for 1J(13C-H) = 145 Hz, and 1H decoupling was achieved using WALTZ16 pulse sequence. Spectra were processed using exponential weighting with a resolution of 2 Hz, and a line broadening threshold of 2.8 Hz.
Typical acquisition parameters for 1D 31P{1H} NMR spectra (31P: 202.46 MHz): 512 transients, spectral width 20 kHz, using 32k data points and a delay time of 1.5 s. 1H decoupling was achieved using WALTZ16 pulse sequence. Spectra were processed using exponential weighting with a resolution of 0.6 Hz and a line broadening threshold of 10 Hz.
Typical acquisition parameters for 2D [1H,1H] NOESY NMR spectra (1H: 500.13 MHz): 1k transients of 32 scans/block, spectral width 5.0/5.0 kHz, using 1k/1k data points and a delay time of 1.5 s. Spectra were processed using sine weighting with a resolution of 4.8/9.8 Hz and a line broadening threshold of 0.8/1.5 Hz.
Typical acquisition parameters for 2D [1H,13C] HSQC NMR spectra (1H: 500.13/13C: 125.77 MHz): 2k transients of 64 scans/block, spectral width 5.4/17.6 kHz, using 2k/2k data points and a delay time of 1.7 s. Sequences were optimized for 1J(13C-H) = 145 Hz, and 1H decoupling was achieved using WALTZ16 pulse sequence. Spectra were processed using cosine-squared weighting with a resolution of 2.7/34.4 Hz and a line broadening threshold of 0.7/2.5 Hz. 1H chemical shifts were referenced to TSP via internal 1,4-dioxane at 3.764 ppm.
Typical acquisition parameters for 2D [1H,15N] HSQC NMR spectra (1H: 500.13/15N: 50.70 MHz): 512 transients of 16 scans/block, spectral width 7.5/4.6 kHz, using 2k/2k data points and a delay time of 1.5 s. Sequences were optimized for 1J(15N-H) = 76 Hz, and 1H decoupling was achieved using WALTZ16 pulse sequence. Spectra were processed using cosine-square weighting with a resolution of 2.2/3.7 Hz and a line broadening threshold of 0.7/1.0 Hz.
Typical acquisition parameters for 2D [1H,15N] HMBC NMR spectra (1H = 599.92/15N: 60.79 MHz): 512 transients of 32 scans/block, spectral width 6.0/6.1 kHz, using 2k/2k data points and a delay time of 1.5 s. Sequences were optimized for 1J(15N-H) = 76 Hz/nJ(15N-H) = 6 Hz, and 1H decoupling was achieved using WALTZ16 pulse sequence. Water suppression was achieved using a 47.0 dB power level presaturation. Spectra were processed using cosine-square weighting with a resolution of 2.9/6.2 Hz and a line broadening threshold of 0.7/1.0 Hz.
1H chemical shifts were referenced to TSP (sodium 3-(trimethylsilyl)-[2,2,3,3-D4]-proprionate) via internal 1,4-dioxane at 3.764 ppm, 13C to TMS (tetramethylsilane) via internal 1,4-dioxane at 67.19 ppm, 14N and 15N to external 15NH4Cl 1.5 m in 1 m HCl at 0.00 ppm and 31P to external H3PO4 85% in D2O at 0.00 ppm.
pH measurement
pH values were measured at ambient temperature directly in the NMR tube with a Corning 145 pH-meter equipped with an Aldrich microcombination electrode, calibrated with standard Aldrich buffer solutions at pH 4, 7 and 10.
pKa determination
The experimental pH titration data were fitted to the following formula derived from the Henderson-Hasselbalch equation:
where Ka is the dissociation constant for species 1-MeImH+, δA, and δB are the limiting chemical shifts of species 1-MeImH+ and 1-MeIm, respectively. The pH titration curves (14N chemical shifts of both N1 and N3 vs. pH) were fitted using the program ORIGIN version 6.0 (Microcal Software Ltd.).
Photoreactions
Samples for the photochemical studies were 8-15 mm solutions of the investigated PtIV complexes (on their own or containing 1-methylimidazole in 1:1 molar ratio) in 0.6 mL 90% PBS/10% D2O. Before irradiation, the samples were transferred into 5 mm screw-cap NMR tubes (Wilmad) provided with a teflon/silicone septum, and Ar-saturated for 30 min. NMR samples were then irradiated for 2 h (unless otherwise stated) at 310 K using a LZC-ICH2 photoreactor (Luzchem Research Inc.) equipped with a temperature controller and 16 LZC-UVA lamps (Hitachi, λmax = 365 nm) or 16 LZC-VIS UV-Visible light lamps (Sylvania cool white, λ = 250-700 nm) with no other sources of light filtration. The spectral outputs for both sources are shown in the Supporting Information (Figure S5). The power levels (P = 6.4-7.2 mW cm−2 (UVA), P = 30.0 mW cm−2 (UV-Visible)) were monitored and assessed using the appropriate probe window, calibrated against an OAI-306 UV power meter from Optical Associates, Inc.; the delivered radiation dose (J cm−2) is defined as irradiance (P, W cm−2) × time (s). NMR spectra were then recorded soon after irradiation.
Po2 measurement
Po2 values were measured with a Corning 240 pH-meter (switched to read millivolts) equipped with a Lazar DO-166-NP dissolved oxygen needle probe. Calibration was carried out at 295 K and a barometric pressure of 761 mmHg using a 0.1 g L−1 NaCl solution in double-distilled water (made freshly) giving at equilibrium with atmospheric dioxygen a Po2 value of 161 mmHg (theoretical: 163 mmHg). The electrode was then set up to read Po2 directly in mm of Hg partial pressure.
Supplementary Material
Figure S1. a) 1D 1H and b) 1D 13C{1H} PENDANT NMR spectra of trans-[Pt(NH3)2(1-MeIm)2]Cl2 in D2O. 1H chemical shifts were referenced to TSP (sodium 3-(trimethylsilyl)-[2,2,3,3-D4]-proprionate) via internal 1,4-dioxane (*) at 3.764 ppm, and 13C chemical shifts to TMS (tetramethylsilane) via internal 1,4-dioxane (*) at 67.19 ppm.
Assignments: δ(1H/13C) =3.82/35.03 (CH3), 7.19/129.00 (CH4), 7.26/123.51 (CH5), 8.05/139.94 ppm (CH2).
Figure S2. a) 1D 1H and b) 1D 13C{1H} PENDANT NMR spectra of cis-[Pt(NH3)2(1-MeIm)2]Cl2 in D2O. 1H chemical shifts were referenced to TSP (sodium 3-(trimethylsilyl)-[2,2,3,3-D4]-proprionate) via internal 1,4-dioxane (*) at 3.764 ppm, and 13C chemical shifts to TMS (tetramethylsilane) via internal 1,4-dioxane (*) at 67.19 ppm.
Assignments: δ(1H/13C) =3.73/34.96 (CH3), 7.04/128.55 (CH4), 7.16/123.19 (CH5), 7.78/139.55 ppm (CH2).
Figure S3. a) 1D 1H and b) 1D 13C{1H} PENDANT NMR spectra of [Pt(1-MeIm)4]Cl2 in D2O. 1H chemical shifts were referenced to TSP (sodium 3-(trimethylsilyl)-[2,2,3,3-D4]-proprionate) via internal 1,4-dioxane (*) at 3.764 ppm, and 13C chemical shifts to TMS (tetramethylsilane) via internal 1,4-dioxane (*) at 67.19 ppm.
Assignments: δ(1H/13C) =3.73/35.04 (CH3), 6.86/128.81 (CH4), 7.16/123.05 (CH5), 7.77/139.93 ppm (CH2).
Figure S4. Ortep diagram and numbering scheme for [Pt(1-MeIm)4](ClO4)2 (50% probability ellipsoids). The hydrogens have been omitted for clarity. This structure determined by S. Parsons and S. Moggach is the same as that reported previously (O. Clement et al., J. Am. Chem. Soc. 1996, 118, 612–620) and the reported atom labeling scheme is used above.
Figure S5. Spectral outputs of LZC-UVA (Hitachi) and LZC-VIS (Sylvania cool white) lamps. (Data taken from manufacturer’s manual (Luzchem Research Inc.))
Intro Structures.

Acknowledgements
We thank the EPSRC and the University of Warwick (studentship for HIAP), the EC (Marie Curie Fellowship for LR) and Scottish Enterprise for financial support, Prof. Simon Parsons and Dr. Stephen Moggach for determination of the crystal structure of [Pt(1-MeIm)4](ClO4)2, Mr. Juraj Bella for assistance with NMR experiments, and members of EC COST D39 for stimulating discussions.
Footnotes
Supporting information for this article is available on the WWW under http://www.chemeurj.org/ or from the author.
References
- [1].Vogler A, Kern A, Fusseder BZ. Naturforsch. B. 1978;33:1352–1356. [Google Scholar]
- [2].Vogler A, Hlavatsch J. Angew. Chem. 1983;95:153–153. [Google Scholar]; Angew. Chem. Int. Ed. Engl. 1983;22:154–155. [Google Scholar]
- [3].Bednarski PJ, Mackay FS, Sadler PJ. Anti-Cancer Agents Med. Chem. 2007;7:75–93. doi: 10.2174/187152007779314053. [DOI] [PubMed] [Google Scholar]
- [4].Ronconi L, Sadler PJ. Coord. Chem. Rev. 2007;251:1633–1648. doi: 10.1016/j.ccr.2008.01.016. [DOI] [PMC free article] [PubMed] [Google Scholar]
- [5].Kašpárková J, Mackay FS, Brabec V, Sadler PJ. J. Biol. Inorg. Chem. 2003;8:741–745. doi: 10.1007/s00775-003-0474-3. [DOI] [PubMed] [Google Scholar]
- [6].Bednarski PJ, Grünert R, Zielzki M, Wellner A, Mackay FS, Sadler PJ. Chem. Biol. 2006;13:61–67. doi: 10.1016/j.chembiol.2005.10.011. [DOI] [PubMed] [Google Scholar]
- [7].Mackay FS, Woods JA, Heringová P, Kašpárková J, Pizarro AM, Moggach SA, Parsons S, Brabec V, Sadler PJ. Proc. Nat. Acad. Sci. U.S.A. 2007;104:20743–20748. doi: 10.1073/pnas.0707742105. [DOI] [PMC free article] [PubMed] [Google Scholar]
- [8].Šima J. Coord. Chem. Rev. 2006;250:2325–2334. [Google Scholar]
- [9].Sundberg RJ, Martin RB. Chem. Rev. 1974;74:471–517. [Google Scholar]
- [10].Bachovchin WW, Roberts JD. J. Am. Chem. Soc. 1978;100:8041–8047. [Google Scholar]
- [11].Martin RB. In: Cisplatin: Chemistry and Biochemistry of a Leading Anticancer Drug. Lippert B, editor. Wiley-VCH; Weinheim: 1999. pp. 183–206. [Google Scholar]
- [12].Eastman A. In: Cisplatin: Chemistry and Biochemistry of a Leading Anticancer Drug. Lippert B, editor. Wiley-VCH; Weinheim: 1999. pp. 111–134. [Google Scholar]
- [13].Zwelling LA, Michaels S, Schwartz H, Dobson PP, Kohn KW. Cancer Res. 1981;41:640–649. [PubMed] [Google Scholar]
- [14].Berners-Price SJ, Ronconi L, Sadler PJ. Prog. Nucl. Magn. Reson. Spectrosc. 2006;49:65–98. [Google Scholar]
- [15].Kent JE, Wagner EL. J. Chem. Phys. 1966;44:3530–3534. [Google Scholar]
- [16].Mackay FS, Woods JA, Moseley H, Ferguson J, Dawson A, Parsons S, Sadler PJ. Chem. Eur. J. 2006;12:3155–3161. doi: 10.1002/chem.200501601. [DOI] [PubMed] [Google Scholar]
- [17].Berners-Price SJ, Frey U, Ranford JD, Sadler PJ. J. Am. Chem. Soc. 1993;115:8649–8659. [Google Scholar]
- [18].Appleton TG, Bailey AJ, Barnham KJ, Hall JR. Inorg. Chem. 1992;31:3077–3082. [Google Scholar]
- [19].Alei M, Jr., Morgan LO, Wageman WE, Whaley TW. J. Am. Chem. Soc. 1980;102:2881–2887. [Google Scholar]
- [20].Clement O, Roszak AW, Buncel E. J. Am. Chem. Soc. 1996;118:612–620. [Google Scholar]
- [21].Fazakerley GV, Koch KR. Inorg. Chim. Acta. 1979;36:13–25. [Google Scholar]
- [22].Muir MM, Cadiz ME, Baez A. Inorg. Chim. Acta. 1988;151:209–213. [Google Scholar]
- [23].Gibson D, Arvanitis GM, Berman HM. Inorg. Chim. Acta. 1994;218:11–19. [Google Scholar]
- [24].Kralingen C. G. van, Reedijk J. Inorg. Chim. Acta. 1978;30:171–177. [Google Scholar]
- [25].Alei M, Jr., Vergamini PJ, Wageman WE. J. Am. Chem. Soc. 1979;101:5415–5417. [Google Scholar]
- [26].Horvath O, Stevenson KL. Charge Transfer Photochemistry of Coordination Compounds. VCH; New York: 1992. [Google Scholar]
- [27].Balzani V, Carassiti V. Photochemistry of Coordination Compounds. Academic Press; New York: 1970. [Google Scholar]
- [28].Hennig H, Walther D, Thomas P. Z. Chem. 1983;23:446–446. [Google Scholar]
- [29].Nakabayashi Y, Erxleben A, Létinois U, Pratviel G, Meunier B, Holland L, Lippert B. Chem. Eur. J. 2007;13:3980–3988. doi: 10.1002/chem.200601271. [DOI] [PubMed] [Google Scholar]
- [30].Ronconi L, Sadler PJ. Chem. Commun. 2008:235–237. doi: 10.1039/b714216a. [DOI] [PubMed] [Google Scholar]
- [31].Legrini O, Oliveros E, Braun AM. Chem. Rev. 1993;93:671–698. [Google Scholar]
- [32].Azrague K, Bonnefille E, Pradines V, Pimienta V, Oliveros E, Maurette M-T, Benoit-Marquie F. Photochem. Photobiol. Sci. 2005;4:406–408. doi: 10.1039/b500162e. [DOI] [PubMed] [Google Scholar]
- [33].Kuroda R, Neidle S, Ismail IM, Sadler PJ. Inorg. Chem. 1983;22:3620–3624. [Google Scholar]
- [34].Barnard CFJ, Vollano JF, Chaloner PA. Inorg. Chem. 1996;35:3280–3284. doi: 10.1021/ic951548n. [DOI] [PubMed] [Google Scholar]
- [35].Sykora J, Šima J. Coord. Chem. Rev. 1990;107:1–212. [Google Scholar]
- [36].Cornacchia D, Cerasino L, Pacifico C, Natile G. Eur. J. Inorg. Chem. 2008;11:1822–1829. [Google Scholar]
- [37].Vinje J, Sletten E. Anti-Cancer Agents Med. Chem. 2007;7:35–54. doi: 10.2174/187152007779313982. [DOI] [PubMed] [Google Scholar]
- [38].Müller P, Schröder B, Parkinson JA, Kratochwil NA, Coxall RA, Parkin A, Parsons S, Sadler PJ. Angew. Chem. 2003;115:349–353. doi: 10.1002/anie.200390110. [DOI] [PubMed] [Google Scholar]; Angew. Chem. Int. Ed. 2003;42:335–339. [Google Scholar]
- [39].Norman RE, Sadler PJ. Inorg. Chem. 1988;27:3583–3587. [Google Scholar]
Associated Data
This section collects any data citations, data availability statements, or supplementary materials included in this article.
Supplementary Materials
Figure S1. a) 1D 1H and b) 1D 13C{1H} PENDANT NMR spectra of trans-[Pt(NH3)2(1-MeIm)2]Cl2 in D2O. 1H chemical shifts were referenced to TSP (sodium 3-(trimethylsilyl)-[2,2,3,3-D4]-proprionate) via internal 1,4-dioxane (*) at 3.764 ppm, and 13C chemical shifts to TMS (tetramethylsilane) via internal 1,4-dioxane (*) at 67.19 ppm.
Assignments: δ(1H/13C) =3.82/35.03 (CH3), 7.19/129.00 (CH4), 7.26/123.51 (CH5), 8.05/139.94 ppm (CH2).
Figure S2. a) 1D 1H and b) 1D 13C{1H} PENDANT NMR spectra of cis-[Pt(NH3)2(1-MeIm)2]Cl2 in D2O. 1H chemical shifts were referenced to TSP (sodium 3-(trimethylsilyl)-[2,2,3,3-D4]-proprionate) via internal 1,4-dioxane (*) at 3.764 ppm, and 13C chemical shifts to TMS (tetramethylsilane) via internal 1,4-dioxane (*) at 67.19 ppm.
Assignments: δ(1H/13C) =3.73/34.96 (CH3), 7.04/128.55 (CH4), 7.16/123.19 (CH5), 7.78/139.55 ppm (CH2).
Figure S3. a) 1D 1H and b) 1D 13C{1H} PENDANT NMR spectra of [Pt(1-MeIm)4]Cl2 in D2O. 1H chemical shifts were referenced to TSP (sodium 3-(trimethylsilyl)-[2,2,3,3-D4]-proprionate) via internal 1,4-dioxane (*) at 3.764 ppm, and 13C chemical shifts to TMS (tetramethylsilane) via internal 1,4-dioxane (*) at 67.19 ppm.
Assignments: δ(1H/13C) =3.73/35.04 (CH3), 6.86/128.81 (CH4), 7.16/123.05 (CH5), 7.77/139.93 ppm (CH2).
Figure S4. Ortep diagram and numbering scheme for [Pt(1-MeIm)4](ClO4)2 (50% probability ellipsoids). The hydrogens have been omitted for clarity. This structure determined by S. Parsons and S. Moggach is the same as that reported previously (O. Clement et al., J. Am. Chem. Soc. 1996, 118, 612–620) and the reported atom labeling scheme is used above.
Figure S5. Spectral outputs of LZC-UVA (Hitachi) and LZC-VIS (Sylvania cool white) lamps. (Data taken from manufacturer’s manual (Luzchem Research Inc.))