Abstract
Many new drugs have low aqueous solubility and high therapeutic efficacy. Paclitaxel (PTX) is a classic example of this type of compound. Here we show that extremely small (<40 nm) hydrophilic carbon clusters (HCCs) that are PEGylated (PEG-HCCs) are effective drug delivery vehicles when simply mixed with paclitaxel. This formulation of PTX sequestered in PEG-HCCs (PTX/PEG-HCCs) is stable for at least twenty weeks. The PTX/PEG-HCCs formulation was as effective as PTX in a clinical formulation in reducing tumor volumes in an orthotopic murine model of oral squamous cell carcinoma. Preliminary toxicity and biodistribution studies suggest that the PEG-HCCs are not acutely toxic and, like many other nanomaterials, are primarily accumulated in the liver and spleen. This work demonstrates that carbon nanomaterials are effective drug delivery vehicles in vivo when non-covalently loaded with an unmodified drug.
Keywords: Carbon Nanotechnology, Biodistribution, Cancer, Drug Delivery, Toxicity
An increasing number of drug candidates with high therapeutic efficacy have low water solubility, posing a challenge for in vivo delivery.1 We are seeking to develop a safe, modular drug delivery platform that can be loaded with unmodified hydrophobic drugs and thereby enable their delivery. Ideally, in the future, it will be possible to continue to develop this modular platform into a targeted drug delivery vehicle. In this paper, we describe the initial step towards this goal by demonstration of a non-targeted platform that can sequester and deliver a hydrophobic drug.
Paclitaxel (PTX) is a classic example of a water-insoluble drug with high therapeutic efficacy. In the FDA-approved commercial formulation of PTX, (Taxol®, Bristol-Myers-Squibb, Princeton, NJ, USA) the drug is solubilized in ethanol and a polyethoxylated castor oil, Cremophor EL® (Cremophor). The use of Cremophor as the excipient for PTX is well-known to cause significant allergic reactions, including anaphylaxis. Consequently, patients are pre-medicated with antihistamines and corticosteroids in order to prevent potentially life-threatening hypersensitivity reactions.2 One solution to this problem has been the sequestering of PTX in albumin, and the commercial formulation is called Abraxane®.3 Though milder, significant side effects remain, such as sensory neuropathy.3 It is noteworthy that both commercial formulations of PTX involve the non-covalent sequestration of the unmodified drug, likely due to both the ease of preparing this class of formulations and the fact that covalently modifying the PTX can alter its efficacy. Numerous efforts have been made to find alternative excipients for PTX that would show increased drug-loading and be non-toxic.4–5 Many of these strategies incorporate PEG into the excipient either to provide solubility in aqueous solutions, or increase blood circulation time or even control the drug release profile.6–8 Owing to its rich formulation history, widespread use, generic availability, and continued need for a still less toxic formulation, PTX was selected as the initial hydrophobic drug to evaluate for sequestration in our nanoparticles.
Nanovectors, nanoparticles capable of transporting and delivering one or more bioactive molecules, are an emerging class of drug delivery platforms.9–11 Nanovectors have been prepared from a variety of materials and used to deliver a broad range of payloads, including siRNA and both hydrophilic and hydrophobic small molecules. Carbon nanomaterials, particularly those derived from carbon nanotubes, have received a great deal of attention as nanovectors.12–13 In the majority of cases, the carbon nanomaterials are functionalized with PEG to provide solubility in aqueous solutions and increase blood circulation times. The predominant strategy for drug delivery using carbon nanovectors has been to covalently modify the drug with a linker that is then either covalently or non-covalently bound to the nanovector. This approach has been used for a variety of drugs, including carboranes,14 cisplatin,15 and PTX.16–17 In pioneering work using single-walled carbon nanotubes (SWCNTs) to deliver PTX, branched PEG molecules, each with a long alkyl “tail”, were functionalized with PTX molecules. These polymer conjugates were then bound to SWCNTs via the hydrophobic interaction between the alkyl tails and the nanotubes. In vivo this formulation was more effective than Taxol®, and the SWCNTs showed prolonged retention in the liver and spleen. Nonetheless, for all of the approaches mentioned the requirement to covalently modify the drug presents a hurdle to adoption and retards the modularity of this class of formulations.
An alternative approach is to non-covalently load a nanovector with an unmodified drug molecule, such as PTX. This eliminates any concern about altering the drug’s behavior and is a strategy that is easier to implement synthetically and is more modular. Probably the most well established example of this strategy is liposomes;18 where the drug is sequestered inside the particles. In some cases, this can be a limiting factor, as the drug is never or very poorly released from the liposomes.19 There is a continuing interest in a variant of this strategy wherein hydrophobic drug molecules are sequestered on the hydrophobic surfaces of a nanovector. Carbon nanomaterials are a good choice for this approach as they are inherently hydrophobic. Several different carbon materials have been shown to successfully sequester hydrophobic compounds, including PTX.20–27 These drug-loaded carbon nanomaterials have shown effective cell-killing in vitro, but to the best of our knowledge there have been no reports of successful drug delivery in vivo using carbon nanomaterials loaded with unmodified drug molecules. Until this study, it remained an open question as to whether such formulations could prove effective in animal models.
Exploration of the potential toxicity and biodistribution of carbon nanomaterials is ongoing. Carbon is generally deemed non-toxic in simple forms such as activated charcoal, and used for physisorption of organics in filters, water purification and detoxifying formulations. Moreover, it has been observed that the body is able to clear foreign objects whose lengths are comparable to or less than the diameter of phagocytic cells (10 – 20 µm).28 However, carbon nanostructures have attracted a great deal of attention and controversy over their potential toxicity. Recent reviews have highlighted the fact that early work on the toxicology of carbon nanomaterials has reached contradictory conclusions and raised more questions than it has answered.29 A series of publications on the safety of carbon materials wherein each paper was reviewed by a toxicologist along with a carbon materials scientist, came to the conclusion that “carbon nanomaterial samples are typically complex mixtures and…that their toxicity depends on the specific formulation, in particular: (i) hydrophilicity… (ii) metals content and bioavailability, and (iii) state of aggregation …”30 In general, reduced toxicity is associated with structures that are hydrophilic, contain no trace metals and cannot form fibrous aggregates that frustrate the phagocytic cells. Purified SWCNTs appear to have minimal toxicity and accumulate in the liver and spleen, with prolonged retention in those organs.31–32 Even when extremely high doses of carbon nanomaterials are given intraperitoneally or orally, the mice remain healthy over an extended period of time.33 Another recent study that modeled phagolysosomal conditions in vitro suggested that more highly oxidized carbon nanomaterials could be cleared more quickly by the liver than lesser oxidized carbon materials.34
Here we show that extremely small (<40 nm long) hydrophilic carbon clusters (HCCs) that are covalently modified with polyethylene glycol (PEG-HCCs) are effective drug delivery vehicles in vitro and in vivo. Drug loading is accomplished by simply mixing the nanovector PEG-HCCs with a hydrophobic drug; no covalent chemistry is required. No toxicity has been observed for the PEG-HCCs, and the drug-loaded formulation is highly stable.
RESULTS
Preparation and Characterization of HCCs and PEG-HCCs
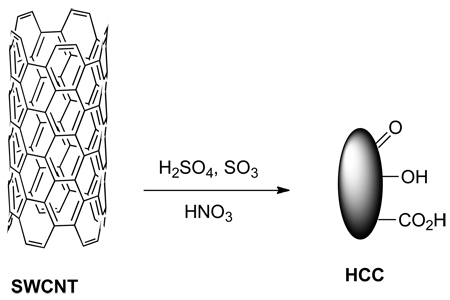
HCCs were prepared from single-walled carbon nanotubes, which are 1 nm wide, by a previously described harsh oxidation procedure employing oleum and nitric acid (Equation 1).35–36 In our previous reports on this procedure, we called the product ultra-short single-walled carbon nanotubes (US-SWCNT). In this previous report, radial breathing modes were observed in the Raman spectroscopy of the produced material, and tubular structures of 40 to 60 nm were observed by transmission electron microscopy (TEM).
 |
(1) |
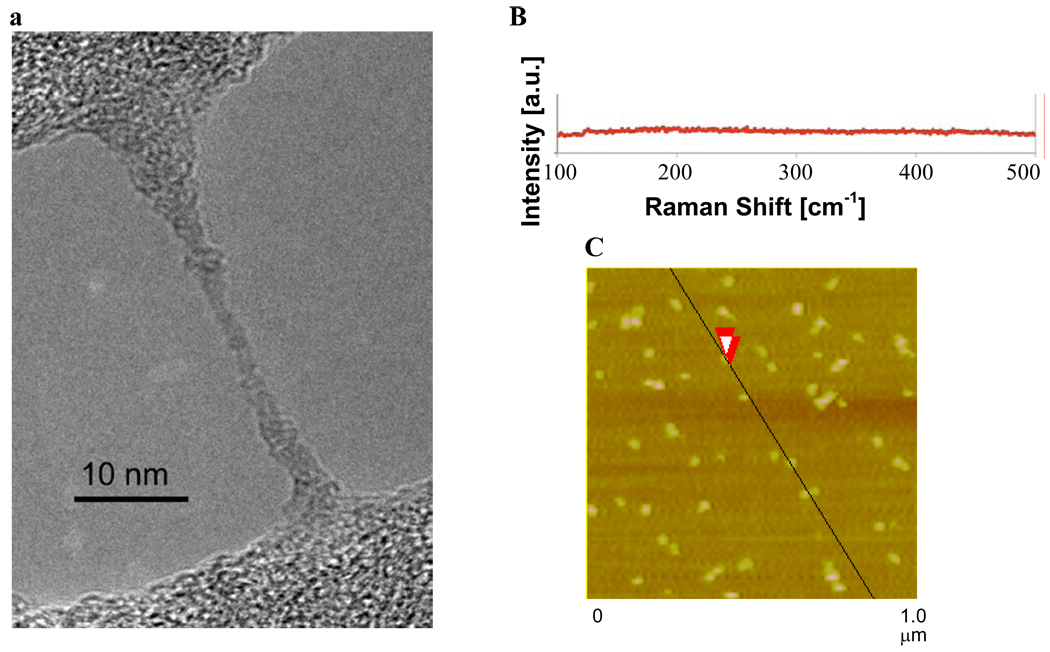
We have chosen to call the material produced for our current work HCCs rather than US-SWCNT because there are very few or no tubular structures observed in the TEM images (Figure 1a) and very few or no radial breathing modes observed by Raman spectroscopy (Figure 1b). The key difference between the previous report and our current work is the solubility of the starting SWCNTs in oleum, which is controlled by the catalyst concentration during their preparation.37 A high catalyst concentration leads to shorter and less aggregated SWCNTs. The current procedure makes use of much more highly soluble SWCNTs (400 ppm) than the previous report (34 ppm). The increased solubility likely leads to better disentanglement and more complete oxidation, resulting in the smaller, less tubular HCCs. It is presumed that due to the harsh oxidation conditions employed, the surface of the HCCs is functionalized with a variety of oxygen containing functionalities, such as alcohols, epoxides, ketones and carboxylic acids. At a neutral pH of 7.0, HCCs have a zeta potential of −29.97 mV. This is consistent with functionalization with carboxylic acids which are deprotonated at neutral pH. Characterization by atomic force microscopy (AFM) indicated that the HCCs were beyond the resolution of the microscope, which has a tip scale of ~40 nm (Figure 1c). When the HCCs were analyzed by light scattering, a pH-dependent phenomenon was observed. Static light scattering indicated that at neutral pH the HCCs were 65 nm while at pH 14 they were 35 nm. Dynamic light scattering measurements were consistent with this trend. This behavior can be explained by aggregation that is controlled by the state of the oxygen functionalities on the HCCs. At neutral pH, some of the oxygen functionalities are protonated and some are deprotonated. Aggregation could be driven both by hydrophobic interactions between the remaining graphitic regions on the HCCs and hydrogen bonding between particles. At pH 14, all of the oxygen functionalities are deprotonated, making the particles highly negatively charged. Charge-based repulsion overwhelms any hydrophobic interaction and the particles are individualized. Based on light scattering and AFM data, HCCs can be best described as <40 nm in length.
Figure 1.
(a) TEM image of HCCs spanning an empty domain on a lacy carbon grid. The HCCs have aggregated during the sample preparation, which consisted of placing an aqueous dispersion of HCCs on the lacy carbon grid and drying the sample at 70 °C for 16 h. (b) Raman spectroscopy indicates that the HCCs have very few or no radial breathing modes. (c) AFM image of aggregated HCCs on mica. The overlapping red arrows indicate where the height the HCCs was measured to be 1.9 nm.
PEG-HCCs were prepared by coupling 5,000 MW methoxy(polyethylene glycol) amine (mPEG-NH2) to the carboxylic acids on the HCCs (Eq 2, only one of each functional group is shown for clarity).38 The PEG-HCCs were purified by sequential dialysis in DMF (2 d) and water (5 d) and then passage through a PD-10 desalting column to remove any coordinated metals or unbound PEG. PEG-HCCs had a zeta potential of −23.04 mV.
 |
(2) |
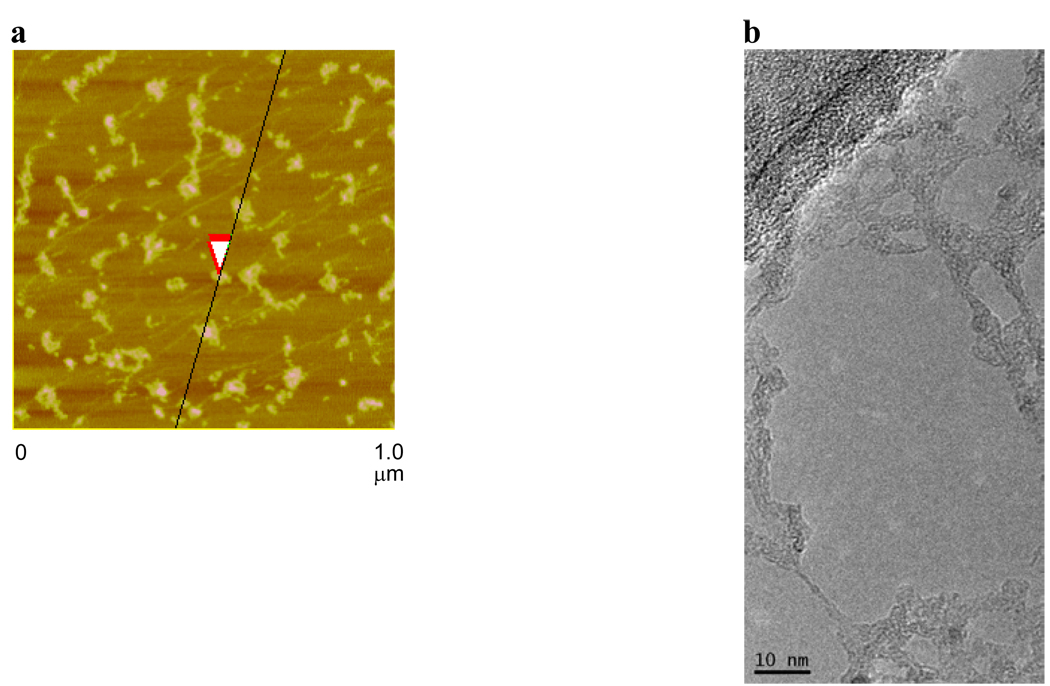
AFM analysis indicated that the PEG-HCCs appear to be more globular than the HCCs, which is likely the result of aggregation during sample preparation (Figure 2a). Indeed, in the TEM analysis, it was apparent that the PEG-HCCs could form extended structures when dried (Figure 2b). On the other hand, DLS indicated that at neutral pH the PEG-HCCs were below the limit of detection and are likely mostly individualized in solution and <50 nm. This individualization could result from the hydrophilic PEG shell preventing hydrophobic and hydrogen bonding interactions between the HCC cores.
Figure 2.
(a) AFM image of aggregated PEG-HCCs on mica. The overlapping red arrows indicate where the height of the PEG-HCCs was measured to be 1.7 nm. (b) TEM image of PEG-HCCs spanning an empty domain on a lacy carbon grid. The PEG-HCCs have aggregated during the sample preparation, which consisted of placing an aqueous solution of PEG-HCCs on the lacy carbon grid and drying the sample at 70 °C for 16 h.
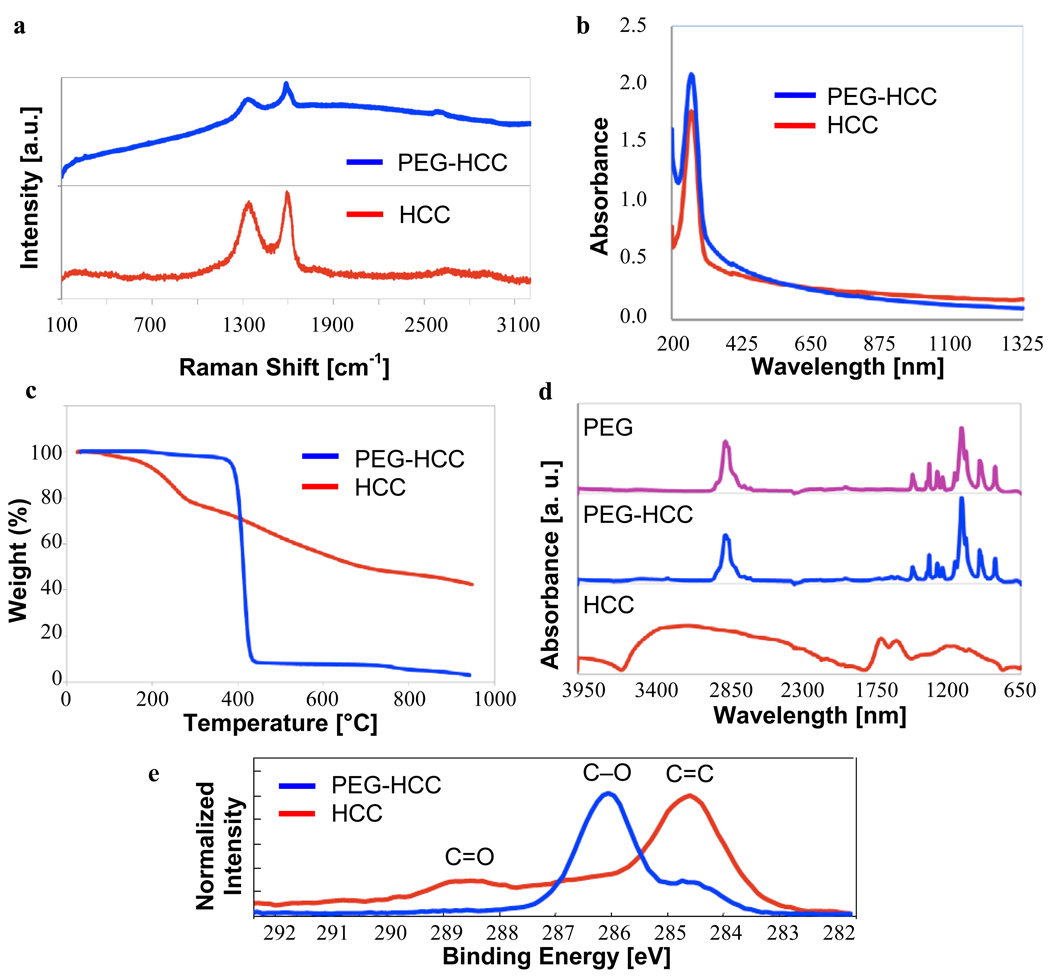
Raman and UV-Vis spectroscopy are very similar for the PEG-HCCs and HCCs, indicating that, as expected, the HCC core remains unchanged by the attachment of the PEG (Figures 3a,b). UV-Vis provides the simplest technique for measuring the concentration of PEG-HCCs in a sample, although what is measured is the absorbance of the carbon core of the nanovector. Throughout this paper, all concentrations are given in terms of the concentration of the carbon core. Thermogravimetric analysis (TGA), fourier transform infrared spectroscopy (FTIR), and x-ray photoelectron spectroscopy (XPS) all support the presence of PEG in the PEG-HCCs (Figures 3c–e). TGA indicates that the PEG-HCCs have a weight loss of 97% while the HCCs have a weight loss of 58%. From this data, it can be calculated that the PEG-HCCs are 94% PEG by weight and that about 1 in 14 HCC carbons bears a PEG chain. The FTIR spectrum for the PEG-HCCs is very similar to the IR trace of PEG alone because the PEG-HCCs contain a large excess of the PEG repeat unit (-CH2CH2O-) relative to the HCC core. Nevertheless, a contribution from the HCCs is evident in the small set of peaks near 1750 nm. The XPS spectra for the PEG-HCCs is also dominated by the signal from the PEG, the C-O signal at 286 eV; while the spectra for the HCCs illustrates that the carbon core has been highly oxidized (peaks from 286–289 eV), but the major bond type is still carbon-carbon (284.5 eV). Because the PEG component of the PEG-HCCs dominates the XPS and FTIR measurements, it is not possible with these techniques to detect the amide bonds that would confirm the covalent attachment of the PEG to the HCCs.
Figure 3.
Characterization of HCCs and PEG-HCCs. (a) Raman spectra are free of radial-breathing modes and have similar peak ratios. Fluorescence of the PEG-HCCs causes the baseline rise for that spectrum. (b) The UV-Vis spectra show similar traces for both compounds, indicative that their carbon cores are identical. (c) TGA indicates a 58% weight loss for the HCCs and a 97% weight loss for the PEG-HCCs (25–950 °C at 10 °C/min under Ar). (d) FTIR of HCCs, PEG-HCCs and PEG alone shows the PEG’s presence in the PEG-HCCs. The HCC absorbances are present but far less intense. (e) The C(1s) portion of the XPS spectrum reflects both the high degree of oxidation for the HCCs (peaks >286 eV for C=O bonds) and the presence of the PEG polymer for the PEG-HCCs (strong peak at 286 eV for C-O bond).
Toxicity of PEG-HCCs
In vivo toxicity studies were conducted with PEG-HCCs. Nude mice (3 mice per group) were administered a single, tail-vein injection of PEG-HCCs (200 µL) at a concentration of either 200 mg/L, 500 mg/L, or 1000 mg/L (concentration is determined for the core of the HCC using UV-Vis). After a single-dose injection, all the mice were observed daily for 5 d, and none of the mice visually exhibited any signs of acute toxicities. After 5 d the mice were euthanized, a terminal blood sample was collected, and the major organs including the heart, lungs, spleen, kidneys, liver, and brain were removed and examined for gross toxicity. At all tested concentrations, no abnormalities were seen in any of the organs, warranting a longer-term toxicity experiment.
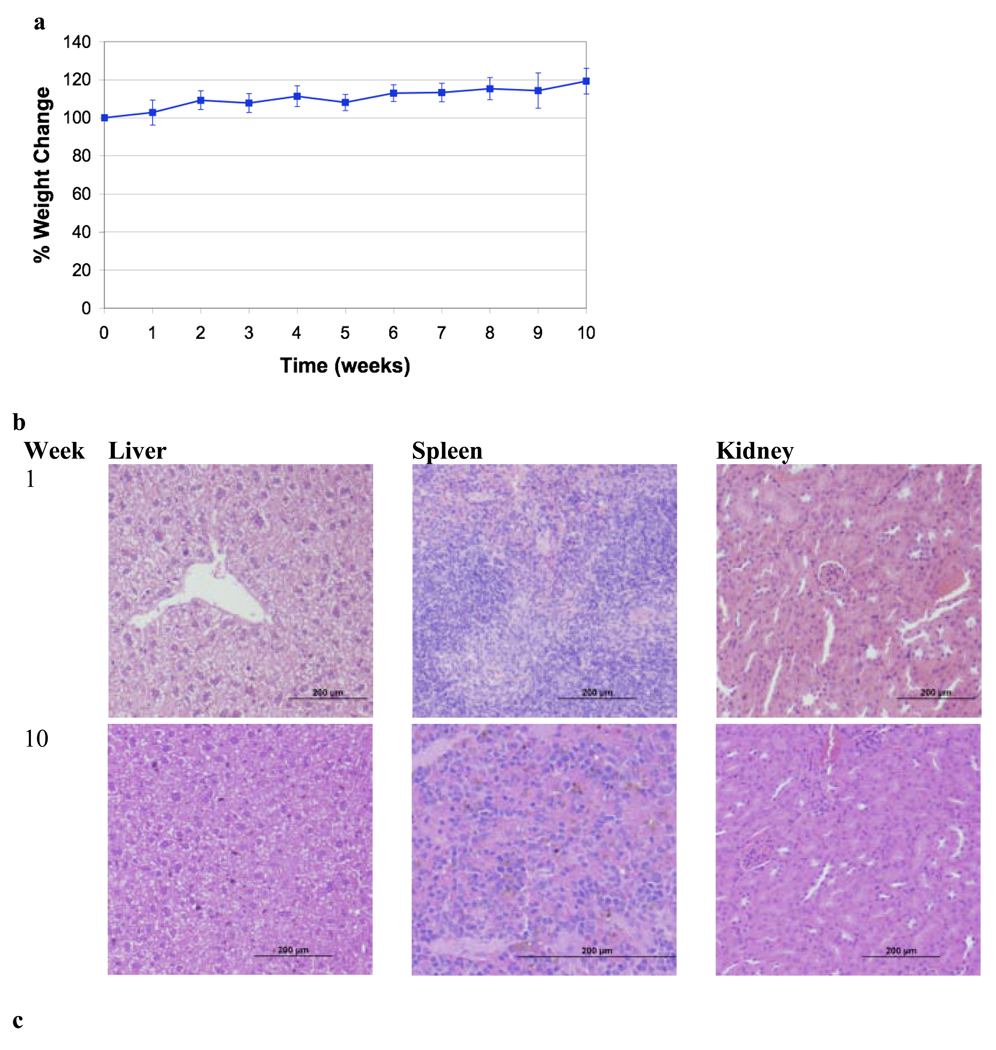
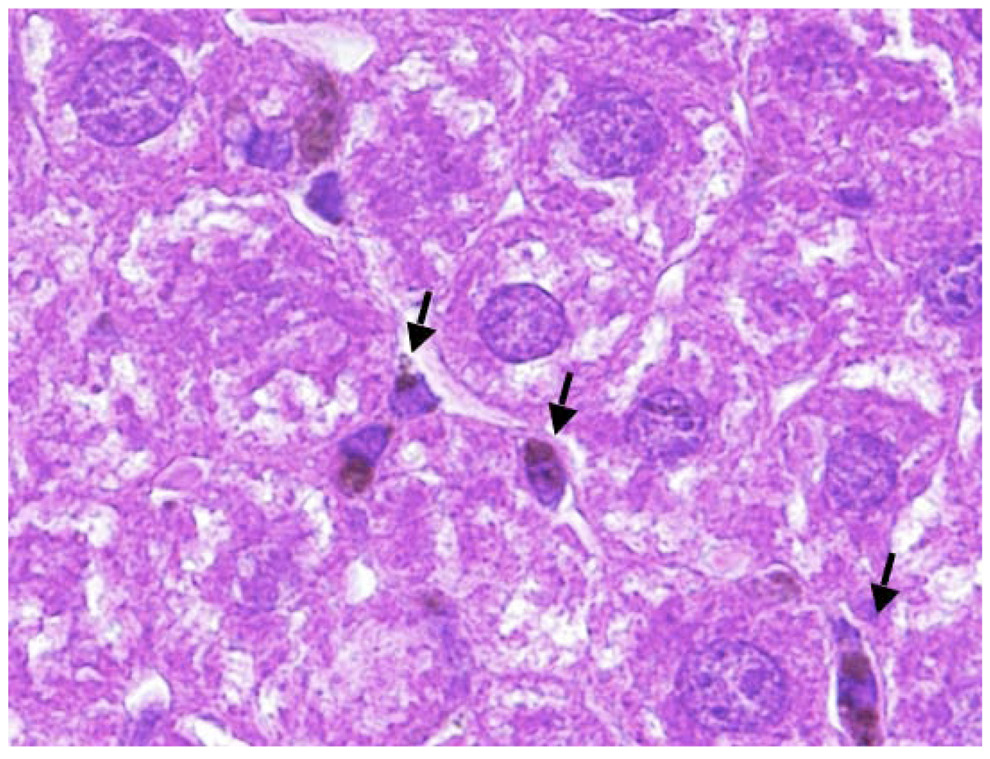
PEG-HCCs at a concentration of 200 mg/L were investigated for longer-term toxicity experiments. Nude mice (5 groups of 5 mice) received a 200 µL by tail vein injection of PEG-HCCs once per week, for up to 10 weeks. Note that for therapeutic drug delivery, PEG-HCCs were administered weekly at half of this dose (100 mg/L) for only 3 weeks. All animals were observed daily; the mice did not show any visual signs of fatigue or discomfort and slowly increased in body weight over the 10 week period (Figure 4a). In addition to daily visual assessment of all animals, major organs and blood analyses were also assessed at necropsy. A group of 5 mice was randomly selected and euthanized after 1, 2, 4, 6, 8, and 10 weeks of weekly treatments. Major organs including the heart, lungs, spleen, kidneys, liver, and brain were removed, formalin-fixed and examined for gross toxicity under light microscopy. For all mice examined, no gross toxicity was apparent in any of the organs analyzed (images of liver, spleen and kidneys from weeks 1 and 10 are presented in Figure 4b). It was difficult to examine the lungs for gross toxicity, due to an error in sample preparation for histology. Dark spots were seen in Kuppfer (macrophage) cells in the liver, but besides the macrophage, the organ appeared normal (Figure 4c). The dark spots are likely carbanaceous aggregates formed from the PEG-HCCs.
Figure 4.
Toxicity study of PEG-HCCs given weekly for 10 weeks. (a) Average percent weight change of mice over the 10 week period. The mice gradually gained weight as is normal for healthy mice. (b) Samples of liver, spleen and kidneys for mice treated for 1 week or 10 weeks. A few darker spots are evident in the liver sample of the mice treated for 10 weeks, but otherwise the tissues appear normal. Scale bars are 200 µm. (c) A higher magnification (100×) image of the liver from a mouse treated for 10 weeks. The edge length of the image is 200 µm. The arrows mark the darker spots that likely indicate the presence of PEG-HCC aggregates.
When each group of mice was euthanized a terminal blood sample was taken from each mouse for standard chemistry by our animal core laboratory. All of the indicators of liver function analyzed were within normal limits (aspartate aminotransferase (AST), alanine aminotransferase (ALT), alkaline phosphatase (ALK PHOS), bilirubin). Blood, urea, nitrogen (BUN) and serum creatinine levels are indicative of kidney function, and were found to be within normal limits (Table 1). Electrolytes potassium, sodium, and chloride were found to be within normal limits, as were glucose as a measure of metabolism and calcium as an indicator of cardiac and bone health (Table 2). Regression analysis found no trends over time for the levels of AST, ALT, creatine, sodium, potassium and glucose. While ALK PHOS, bilirubin, BUN, chloride and calcium remained within normal ranges, correlation with linear changes over time were found (Table S1). White blood cells (WBC), red blood cells (RBC) and platelets were also maintained within normal limits. Hemoglobin, hematocrit, mean corpuscular volume (MCV), mean corpuscular hemoglobin (MCH) and mean corpuscular hemoglobin concentration (MCHC) as secondary measures of RBC health were found to be at normal levels (Table 3). The composition of the WBC population also remained within normal ranges during the 10 weeks. While they remained within normal ranges, a correlation with a linear change over time was found for WBC, platelet count, hemoglobin, hematocrit, MCV, MCH, segs, monos, basos and eos. No trends were found for RBC, MCHC and lymphs (Table S1).
Table 1.
Chemistry of Terminal Blood Samples for Analytes Related to Liver and Kidney Function.
| Time | AST (U/L) |
ALT (U/L) |
ALK PHOS (U/L) |
Bilirubin (mg/dL) |
BUN (mg/dL) |
Serum Creatine |
|---|---|---|---|---|---|---|
| 1 wk (n=5) |
84±16 | 41±7 | 97±12 | 0.16±0.05 | 27.2±4.0 | <0.20 |
| 2 wk (n=5) |
97±36 | 33±6 | 75±9 | 0.18±0.05 | 22.5±3.2 | <0.20 |
| 4 wk (n=5) |
118±52 | 64±35 | 73±7 | 0.20±0.01 | 27.4±2.3 | <0.20 |
| 6 wk (n=5) |
148±81 | 58±29 | 55±12 | 0.16±0.05 | 16.7±2.0 | <0.20 |
| 8 wk (n=5) |
72±15 | 30±6 | 45±11 | 0.10±0.01 | 17.5±1.8 | <0.20 |
| 10 wk (n=5) |
61±5 | 24±3 | 39±11 | 0.10±0.01 | 16.9±1.4 | <0.20 |
Table 2.
Additional Chemistry of Terminal Blood Samples.
| Time | Sodium (mEg/L) |
Potassium (mEg/L) |
Chloride (mEg/L) |
Glucose (mg/dL) |
Calcium (mg/dL) |
|---|---|---|---|---|---|
| 1 wk (n=5) |
152±1 | 8.5±0.9 | 109±1 | 204±77 | 12.0±0.4 |
| 2 wk (n=5) |
153±1 | 8.0±0.7 | 113±2 | 257±35 | 11.5±0.4 |
| 4 wk (n=5) |
152±2 | 8.1±0.5 | 113±1 | 190±18 | 10.7±0.2 |
| 6 wk (n=5) |
153±1 | 8.2±0.9 | 113±1 | 223±15 | 10.8±0.5 |
| 8 wk (n=5) |
149±1 | 7.3±0.4 | 113±2 | 216±40 | 10.5±0.4 |
| 10 wk (n=5) |
153±1 | 8.0±1.0 | 112±1 | 221±47 | 10.4±0.4 |
Table 3.
Hematology Results for Terminal Blood Samples.
| Time | WBC (×103/µL) |
RBC (×106/µL) |
Platelet Count (×103/µL) |
Hemoglobin (g/dL) |
Hematocrit (%) |
MCV (fL) |
MCH (pg) |
MCHC (g/dL) |
|---|---|---|---|---|---|---|---|---|
| 1 wk (n=5) |
6.4±1.4 | 8.9±0.2 | 1543±148 | 15.2±0.5 | 50.5±1.9 | 56.7±1.6 | 17.1±0.4 | 30.1±0.4 |
| 2 wk (n=5) |
5.2±0.4 | 9.1±0.4 | 1290±178 | 14.8±0.4 | 49.2±2.7 | 54.2±1.1 | 16.4±0.4 | 30.2±0.9 |
| 4 wk (n=5) |
4.8±0.5 | 8.7±0.3 | 1329±137 | 14.1±0.4 | 44.8±0.5 | 51.3±2.0 | 16.1±0.7 | 30.2±0.9 |
| 6 wk (n=5) |
6.2±1.6 | 8.6±0.2 | 1415±337 | 13.3±0.2 | 44.5±0.2 | 52.0±1.3 | 15.6±0.3 | 30.0±0.3 |
| 8 wk (n=5) |
6.2±2.2 | 8.3±0.5 | 1609±285 | 12.8±0.8 | 42.1±1.6 | 50.6±1.2 | 15.3±0.2 | 30.3±0.8 |
| 10 wk (n=5) |
9.2±1.4 | 8.9±0.5 | 2149±362 | 13.2±0.8 | 44.6±2.6 | 49.9±0.9 | 14.9±0.2 | 29.6±0.6 |
Drug Loading
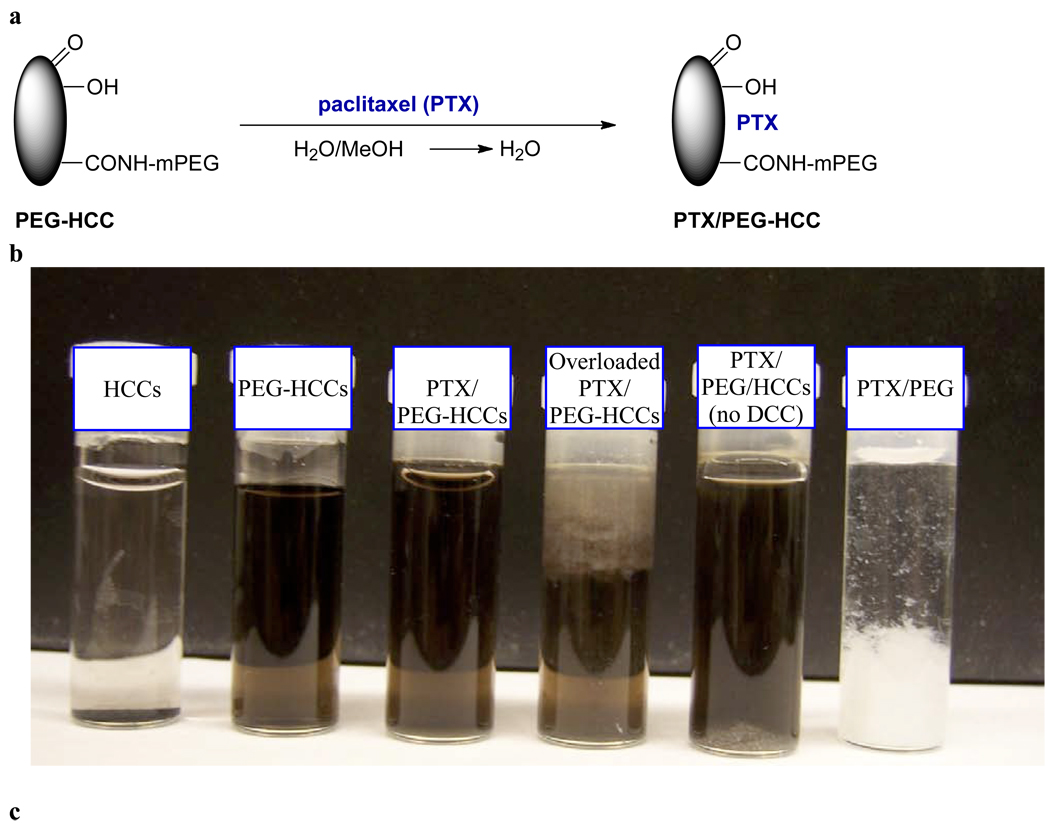
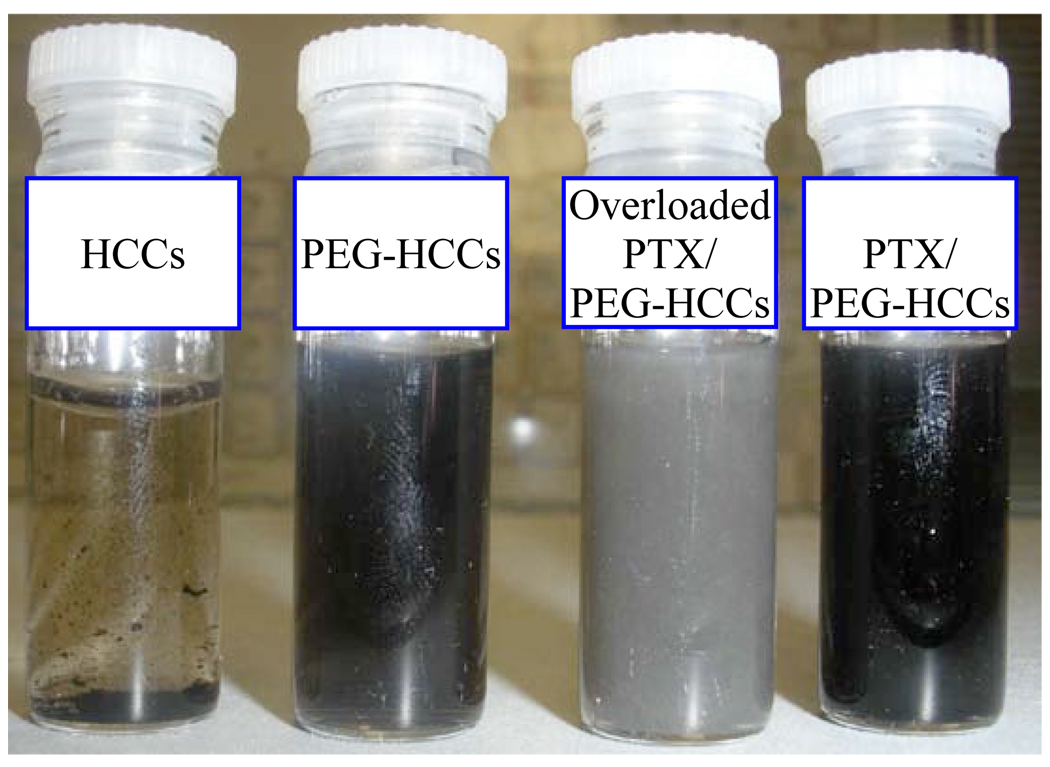
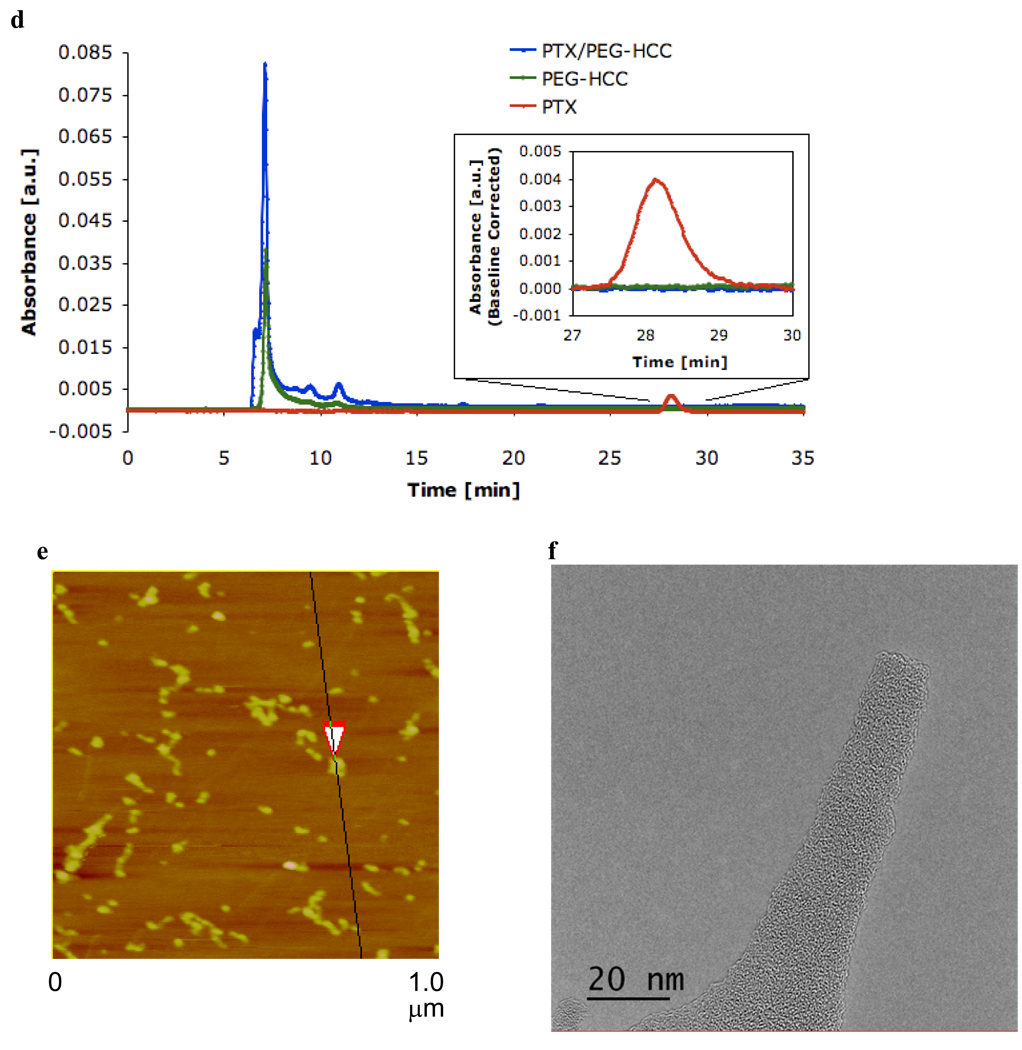
PEG-HCCs were loaded with PTX by dropwise addition of PTX in methanol (5 mg in 1 mL) to a rapidly stirring solution of PEG-HCCs in water (100 mg/L concentration of core HCCs, 5 mL). The solution was bath-sonicated, concentrated to 3 mL by rotary evaporation to remove the methanol and then diluted back to the original volume (5 mL) with water, providing a translucent solution of PTX non-covalently associated with PEG-HCCs (PTX/PEG-HCCs) (Figure 5a). The efficacy of the loading is easy to monitor, as PTX is insoluble in water. If too much PTX is added, a precipitate is observed (Figure 5b,c). Indeed, if no PEG-HCCs are used, the PTX immediately precipitates upon addition to the water. By simple visual inspection, it was determined that it is possible to load the PEG-HCCs with up to 1.6 mg/mL of PTX.39 A loading of 1 mg/mL was used for all studies so that solubility would not be a concern. Using a size exclusion column, high performance liquid chromotography analysis (HPLC) confirmed that at this loading all of the PTX was sequestered by the PEG-HCCs (Figure 5d). Free PTX (1 mg/mL) is observed at 28.1 min in this HPLC analysis, while free PEG-HCCs (100 mg/L) gives a tailing peak with a maximum at 7.2 min. When the two are combined, no peak for the free PTX is observed and the PEG-HCC peak alters shape. The zeta potential of PTX/PEG-HCCs was −37.82 mV, a marked difference from PEG-HCCs that is indicative of an interaction between the HCCs and the PTX. In addition, while the AFM of PTX/PEG-HCCs is visually similar to PEG-HCCs, the height of the particles is increased, again suggesting that the PTX is interacting with them (Figure 5e). TEM images of the PTX/PEG-HCCs were very similar to those obtained for the PEG-HCCs and HCCs (Figure 5f). It is likely that the PTX is being sequestered on the hydrophobic domains of the HCC core of each PEG-HCC. If the loading protocol is followed, but PEG alone is used instead of PEG-HCCs, nearly all of the PTX precipitates (Figure 5b). If the HCCs are simply mixed with mPEG-NH2, the PEG non-covalently wraps the HCCs and is observed by FTIR and XPS following purification. However, the material is unable to sequester PTX at a concentration of 1 mg/mL (Figure 5b), likely because the hydrophobic interaction between the PTX and the HCCs cannot occur without disrupting the non-covalent binding between the PEG and the HCCs.
Figure 5.
Loading of PEG-HCCs with PTX. (a) PTX in methanol was slowly added to the PEG-HCCs and the methanol was removed. (b) Water solutions following centrifugation of, in order from left to right, HCCs (dispersable but insoluble and shown at the bottom of the vial), PEG-HCCs, 1 mg/mL PTX loaded in PEG-HCCs, 3 mg/mL PTX loaded in PEG-HCCs, 1 mg/mL PTX loaded in PEG mixed with HCCs (no covalent attachment of the PEG to the HCCs; note the white PTX precipitate at the bottom of the vial) and 1 mg/mL PTX loaded in PEG. (c) PBS solutions after 5 min of, in order from left to right, HCCs (insoluble), PEG-HCCs, 3 mg/mL PTX loaded in PEG-HCCs and 1 mg/mL PTX loaded in PEG-HCCs. If these samples are allowed to stand for 7 d, a black precipitate settles out of both the PEG-HCCs and PTX/PEG-HCCs. However, shaking the sample completely redisperses the material. (d) Stacked HPLC traces of PTX/PEG-HCCs, PEG-HCCs and free PTX. (e) AFM image of aggregated PTX/PEG-HCCs on mica. The overlapping red arrows indicate where the height of the PEG-HCCs was measured to be 4.7 nm. (f) TEM image of PTX/PEG-HCCs projecting over an empty domain on a lacy carbon grid. The PTX/PEG-HCCs have aggregated during the sample preparation, which consisted of placing an aqueous solution of PTX/PEG-HCCs on the lacy carbon grid and drying the sample at 70 °C for 16 h.
In Vitro Efficacy
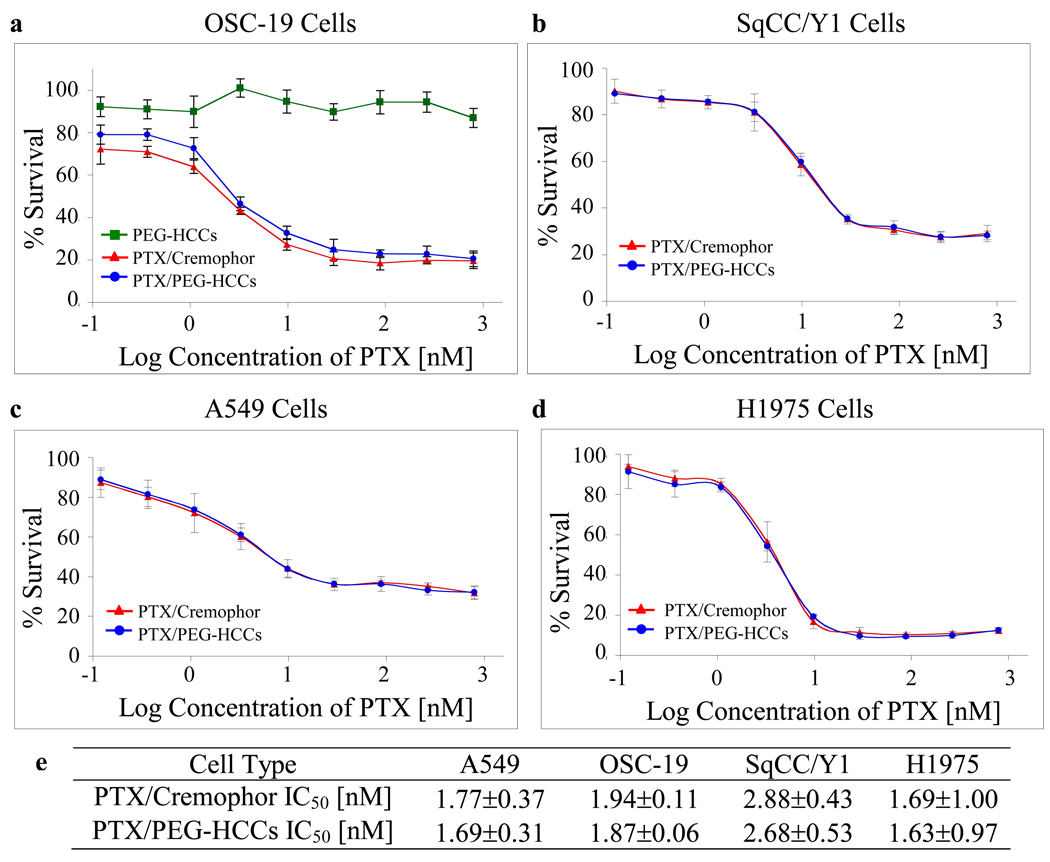
Two head and neck cancer cell lines (OSC-19, SqCC/Y1) and two breast cancer cell lines (A549, H1975) were treated for 3 d with PTX/PEG-HCCs, PEG-HCCs and the commercial formulation Taxol®, which is PTX/Cremophor. Subsequently an MTT assay was performed to assess cell survival for the different concentrations of each compound. The PTX/PEG-HCCs were prepared such that the highest concentration of PTX used in the in vitro assay (500 nM) corresponded to a PEG-HCCs concentration of 3.6 mg/L. Duplicate trials with OSC-19 cells demonstrated that the PEG-HCCs have no toxicity at concentrations of the carbon core less than 4 mg/L (Figure 6a, green line with squares). For all cell lines studied, the assay was performed in triplicate, and the cell-killing efficacy of the PTX/PEG-HCCs treatment and that of the PTX/Cremophor treatment were nearly equivalent (Figure 6a–d). The efficacy of both treatments varied slightly based on the confluency of the cells. Thus, graphs are provided for individual trials. However, in order to capture the range of variation introduced by the confluency, Figure 6e presents the averages of all three runs; note that in each case the IC50 values for treating with PTX/PEG-HCCs or PTX/Cremophor are equivalent within the margins of error. A non-cancerous keratinocyte cell line, HOK16B, was also treated and again the PEG-HCCs had no effect while the PTX/PEG-HCCs and the PTX/Cremophor were equally effective (Figure S1).
Figure 6.
In vitro efficacy of PTX/PEG-HCCs. Treatment of two head and neck cancer cell lines (a,b) and two breast cancer cell lines (c,d) with PTX/PEG-HCCs (blue line with circles) and PTX/Cremophor (red line with triangles). Plot (a) also shows the inability of PEG-HCCs alone to kill cells (green line with squares). Each graph represents an individual trial. Error bars are standard errors. Table (e) presents the IC50 data for an average of three trials and the standard deviations.
The stability of the PTX/PEG-HCCs formulation was evaluated over a 20-week period (Table 5). Samples of PTX/PEG-HCCs and PTX/Cremophor were prepared and stored at 23 °C and 4 °C, respectively. New OSC-19 cells were treated with each solution at each week indicated in the table. There was a small amount of week to week variation in the efficacy of both samples, likely due to the slightly different confluency of the cells week to week. This is supported by the fact that whenever the IC50 rose or fell for one sample, it also did so for the other sample. Indeed, in all cases, the PTX/PEG-HCCs formulation was as effective as the PTX/Cremophor and no decline in the potency of either sample was observed over the 20 weeks.
Table 5.
The Stability of the PTX/PEG-HCCs Evaluated in Comparison to PTX/Cremophor Over Time.
| Treatment | IC50 for OSC19 Cells [nM] | |||||||
|---|---|---|---|---|---|---|---|---|
| Wk 1 | Wk 2 | Wk 3 | Wk 4 | Wk 5 | Wk 6 | Wk 7 | Wk 20 | |
| PTX/PEG-HCCs | 2.04 | 1.94 | 1.62 | 4.08 | 1.57 | 2.09 | 2.98 | 3.00 |
| PTX/Cremophor | 1.95 | 1.84 | 1.34 | 3.94 | 1.45 | 1.97 | 2.72 | 2.95 |
In Vivo Efficacy
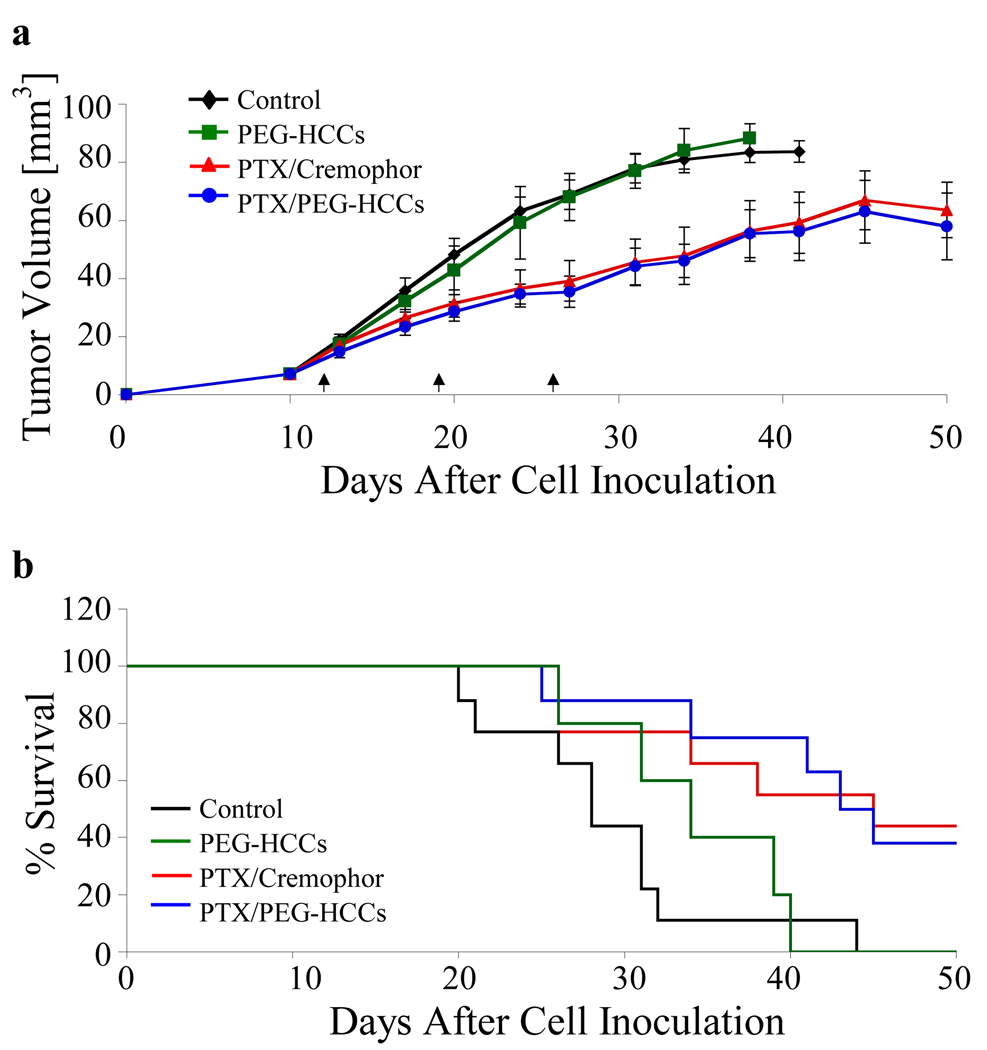
Following the in vitro work, we proceeded to evaluate the effectiveness of PTX/PEG-HCCs treatment on an orthotopic murine model of oral squamous cell carcinoma using the OSC-19 cell line (Figure 7). OSC-19 cells were injected into the tongues of 32 mice as described previously.40 After 12 d, the mice were randomized into four groups and treated weekly with either a saline solution (control, n = 9), PTX/Cremophor (n = 9), PTX/PEG-HCCs (n = 9) or PEG-HCCs (n = 5). For each of the PTX formulations, the dose was 8 mg PTX/kg. The PEG-HCCs were used at a concentration of 100 mg/L. The tumor sizes were measured twice per week using microcalipers. The mice were also weighed twice per week. The mice were euthanized using carbon dioxide asphyxiation if they lost more than 20% of their pre-injection body weight or became moribund. The remaining mice were euthanized at 50 d post-cell inoculation. The PTX/Cremophor and PTX/PEG-HCCs statistically significantly decreased tumor volume and increased survival relative to the control treatment; the two PTX-treatments were statistically indistinguishable from each other. Mice treated with PTX/Cremophor or PTX/PEG-HCCs also had similar body weights (Figure S2).
Figure 7.
Treatment of tumors in an orthotopic murine model of oral squamous cell carcinoma. Mice with orthotopically established oral tongue tumors were injected once weekly (at d 12, 19 and 26) with the treatment (control, PTX/Cremophor, PTX/PEG-HCCs, PEG-HCCs). (a) Tumor volume measured twice weekly. Error bars are standard errors. A paired Student’s t-test was used to compare the differences in tumor volume. The three arrows along the x-axis denote the three d of treatment injections. (b) Animal survival over 50 d. Survival was analyzed by the Kaplan-Mieir method and compared with log-rank tests.
Biodistribution of PEG-HCCs and PTX/PEG-HCCs
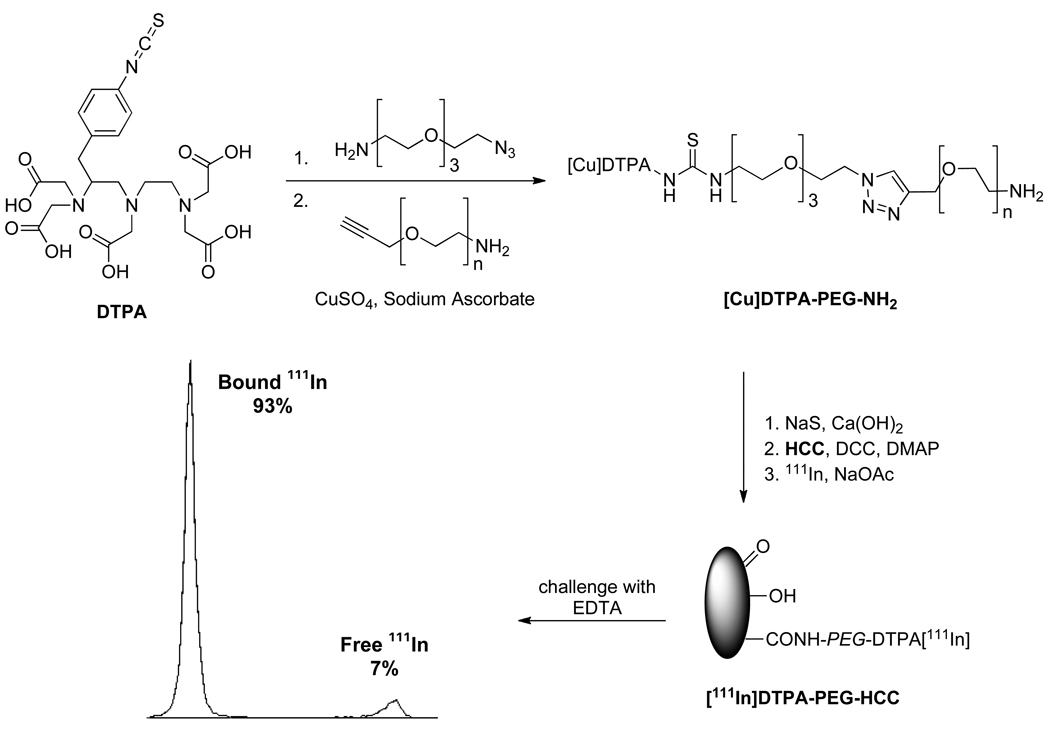
Having demonstrated in vivo efficacy, we sought to determine the biodistribution in both healthy and orthotopically-implanted tumor mice of the PTX/PEG-HCCs and, for comparison, the PEG-HCCs. In order to track the nanovectors, they were labeled with 111In, which has a half-life of 2.8 d.41–42 The 111In was attached to the HCCs via chelation with diethylenetriaminepentaaceticacid (DTPA) groups at the ends of the PEG chains (Figure 8). In order to prepare these functionalized PEG chains, DTPA isothiocyanate was coupled to an amino, azido functionalized PEG oligomer. The resulting product was joined to an amino, alkynyl functionalized 6,000 MW PEG chain using click chemistry.43 Treatment with Na2S and Ca(OH)2 removed any Cu bound to the DTPA.44 The conjoined polymer was then coupled to the HCCs using standard peptide coupling conditions, and small molecule contaminants were removed using a size exclusion column. The purified DTPA-PEG-HCCs were mixed with 111In, and any unbound 111In was removed by a second size exclusion column to yield [111In]DTPA-PEG-HCCs. To demonstrate that the 111In was tightly bound to the DTPA-PEG-HCCs, the binding was challenged with ethylenediaminetetraaceticacid (EDTA). When exposed to an excess of EDTA, 93% of the 111In remained bound to the DTPA-PEG-HCCs. In comparison, when 111In was mixed with PEG-HCCs and challenged with EDTA, only 19% remained bound. This confirmed that the indium was strongly bound by the DTPA chelate. To provide a control for biodistribution studies, DTPA-PEG-NH2 was acylated to yield DTPA-PEG-Ac that was loaded with 111In as described above.
Figure 8.
Synthesis of [111In]DTPA-PEG-HCCs and subsequent challenge with EDTA, which confirmed the strong binding of most of the indium.
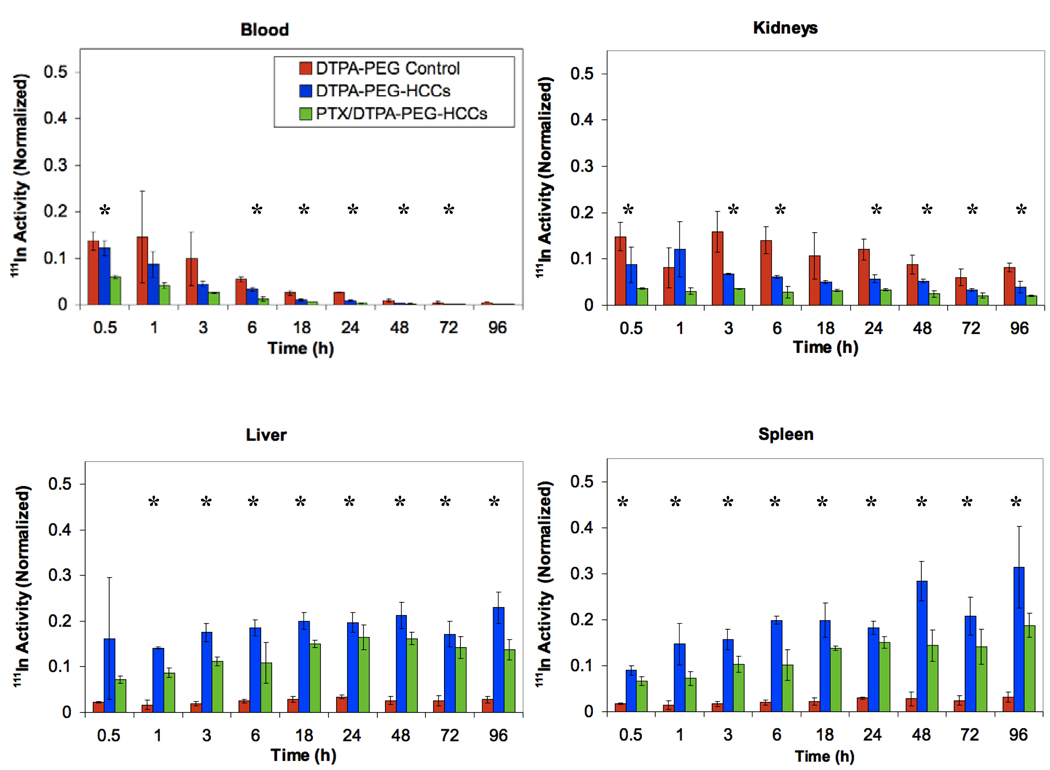
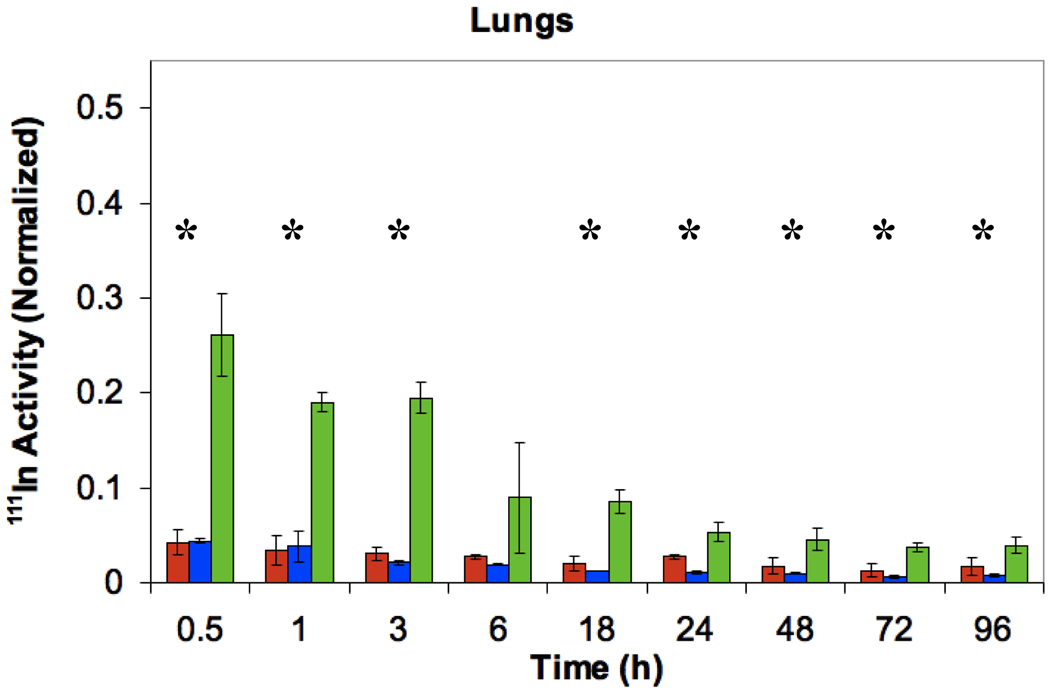
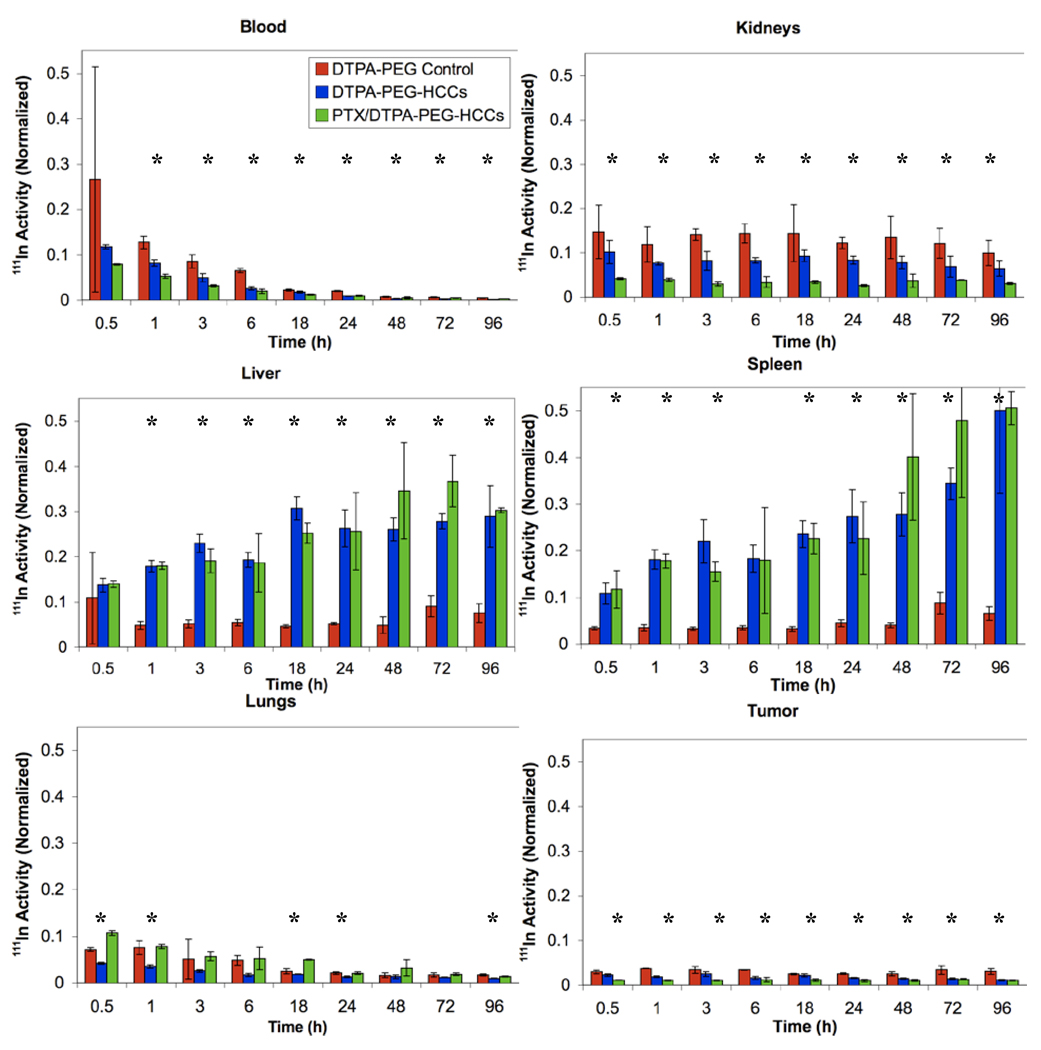
In order to determine the biodistribution, 27 nude mice were administered 200 µL of [111In]DTPA-PEG-HCCs (0.14 µM concentration of PEG, a concentration equivalent to that of the PEG in the other samples), PTX/[111In]DTPA-PEG-HCCs, or [111In]DTPA-PEG-Ac, at a HCC concentration of 200 mg/L via tail vein injections. Three mice were euthanized at each of the following time points: 0 (no treatment control), 0.5, 1, 3, 6, 18, 24, 48, 72, and 96 h, and a terminal blood sample was taken along with the heart, lungs, spleen, kidneys, liver, brain, and tongue, and the radioactivity of each sample was determined using a gamma counter. Data for the blood, kidneys, liver, spleen and lungs is presented in Figure 9. [111In]DTPA-PEG-HCCs accumulate in the spleen, liver, and kidneys in comparison to the [111In]DTPA-PEG control that accumulates in the kidneys. This is very similar to other nanovectors.16,41,42,45 It is interesting to note that the PTX/PEG-HCCs are highly distributed in the lungs relative to the PEG-HCCs. High distribution to the lungs has been seen for Taxol®,46 which suggests that the PTX is interacting with the PEG-HCCs and altering their distribution. Data for the heart, tongue and brain is presented in the supporting information as there was little distribution to these organs (Figure S3). There was no accumulation of any of the samples in the brain. The urine and feces were collected every 24 h; a significant fraction of all three samples were shown to be quickly excreted through the urine and a smaller amount in the feces (Figure S3). This excretion signal could also come from the small fraction of weakly bound indium.
Figure 9.
Distribution of [111In]DTPA-PEG-Ac, [111In]DTPA-PEG-HCCs and PTX/[111In]DTPA-PEG-HCCs in the blood, kidneys, liver, spleen and lungs of healthy nude mice. The Y-axis in all figures was normalized to the total organ radioactivity count divided by the organ’s weight. This value is then divided by the initial radioactivity count injected in each mouse. All plots have the same Y-axis scale to ease comparisons. *ANOVA is statistically significant (p < 0.05).
The same biodistribution study was performed using an orthotopic tongue tumor mouse model. The 30 mice were injected with 3×10⁵ OSC-19 head and neck cancer cells one week prior to injection of [111In]DTPA-PEG-Ac, [111In]DTPA-PEG-HCCs or PTX/[111In]DTPA-PEG-HCCs. Within 7 d a tumor was visible on the tongue of each mouse. The rest of the biodistribution study was performed in the same manner as for healthy mice. The biodistribution of [111In]DTPA-PEG-HCCs and PTX/[111In]DTPA-PEG-HCCs is very similar to that in the healthy mice with accumulation in the liver, spleen, and kidneys (Figure 10). The PTX/[111In]DTPA-PEG-HCC also accumulates in the lungs, as expected from the earlier results. In addition, the [111In]DTPA-PEG-HCCs and PTX/[111In]DTPA-PEG-HCCs reach the tumor on the tongue. As for the healthy mice, there was little distribution to the heart, tongue and brain (Figure S4). There was no accumulation of any of the samples in the brain. The urine and feces were collected every 24 h; a significant fraction of all three samples were shown to be quickly excreted through the urine and a smaller amount in the feces (Figure S4).
Figure 10.
Distribution of [111In]DTPA-PEG-Ac, [111In]DTPA-PEG-HCCs and PTX/[111In]DTPA-PEG-HCCs in the blood, kidneys, liver, spleen, lungs and tumor of tongue tumor burdened nude mice. The Y-axis in all figures was normalized to the total organ radioactivity count divided by the organ’s weight. This value is then divided by the initial radioactivity count injected in each mouse. All plots have the same Y-axis scale to ease comparisons. *ANOVA is statistically significant (p < 0.05).
Conclusion
We have demonstrated that a carbon nanomaterial (PEG-HCCs) can be an effective nanovector drug delivery platform, both in vitro and in vivo, when non-covalently loaded with an unmodified drug (PTX). Preliminary toxicity studies indicated that the PEG-HCCs themselves are not acutely toxic, even when given weekly. The PTX/PEG-HCCs formulation proved to be stable and as effective as Taxol® (PTX/Cremophor) both in vitro and in vivo. Biodistribution studies demonstrated that, similar to other nanoparticles, both PTX/PEG-HCCs and PEG-HCCs reach the tumor but primarily accumulate in the liver and spleen. While preparing a novel nanovector drug delivery platform that is as effective as a commercial formulation is noteworthy, in the future it will be essential to develop a targeted PEG-HCCs formulation that improves upon current clinical formulations.
Methods
Synthesis of HCCs
SWCNTs were purified following a reported protocol.36 Caution! This process uses a highly reactive mixture of acids; strong exothermic reactions are possible. Extreme caution should be used during the procedure. All oxidation reactions should be done in a fume hood and appropriate safety equipment should be worn, including a lab coat, rubber smock, thick rubber gloves, safety glasses, and a full face and neck shield. The purified SWCNTs (250 mg) were dissolved in oleum (125 mL) in a three neck, 1 L round bottomed flask with all joints sealed with Teflon and stirred for 5 d to disentangle them. The solution was then cooled to 0 °C with an ice bath and an ice cold 1:1 mixture of oleum and nitric acid (62.5 mL:62.5 mL) was added in 20 mL portions. During the addition of this mixture, the temperature of the solution was monitored to ensure that it never exceeded 60 °C. When 60 °C was reached the mixture was allowed to cool until the temperature returned to 10 °C before adding the next portion. The addition process took approximately 1 h. The final proportion of oleum:nitric acid was 3:1. When the addition of the acidic mixture was complete, the ice bath was removed and the solution was heated to 65 °C and stirred for 90 min. The solution was then cooled to r.t. and carefully poured onto ice (400 mL) to quench the reaction. The resulting solution was stirred for 16 h, then filtered through a PTFE membrane (0.45 µm pore size). The handling of the material during this filtration is critical to obtain readily dispersible HCCs. During this filtration, the solid is constantly kept moist by the addition of water whenever the solid is nearly exposed. The pH of the liquid coming through the filter is checked until it reaches pH 6. At this point, the addition of water is terminated and all of the liquid is removed by filtration, but the solid still remains moist. Methanol (150 mL) is slowly added to dissolve the solid, then ether (500 mL) is added to precipitate the solid and the liquid is removed by filtration during which it is best to agitate the solid with a Teflon spatula. The final evaporation of the ether was done by placing the moist HCCs in a 50 mL beaker and using a hot plate, slowly allowing the HCCs to heat while continually pulverizing them with a Teflon spatula resulting in a fine, dry powder that was dried in a vacuum dessicator for 12 h to yield 112 mg of HCCs.
Synthesis of PEG-HCCs
HCCs (25 mg, 2.08 mmol of carbon) were added to DMF (25 mL) and the mixture was sonicated using a bath sonicator for 30 min, at which point all of the HCCs were dissolved. DCC (172 mg, 0.835 mmol) was added and the reaction was stirred for 30 min. mPEG-NH2 (208 mg, 0.042 mmol) and DMAP (2 flakes) were added and the reaction was stirred for 24 h. The solution was purified by dialysis in DMF and then water (50,000 MW cut-off dialysis bag, Membrane Filtration Products, Inc. Cat# 1-5050-34), followed by passage through a PD-10 column (GE Healthcare) to furnish 60 mL of PEG-HCCs with a carbon core concentration of 392 mg/L.
Loading PEG-HCCs with PTX
Paclitaxel dissolved in methanol (5 mg in 1mL) was added dropwise into a rapidly stirring solution of PEG-HCCs in deionized water (5 mL, 100 mg/L concentration of core HCC). The mixture was stirred for 30 min and using a bath sonicator for 30 min, at which time, the solution was translucent and brown/black. To remove most of the methanol, the solution was concentrated on a rotovap at 70°C to 3 mL. After concentration, the PTX/PEG-HCCs solution remained translucent. Note that if precipitation is observed, then the sample is ruined and should be discarded. Finally, the solution was diluted back to the original volume (5 mL) with DI water to give a final PTX concentration of 1 mg/mL.
Images of Different Formulations
For the image of the samples in water, samples were placed in a 1/2 dram vial and centrifuged for 1 min at 3,000 rpm. For the image of the samples in PBS, aqueous solutions of HCCs, PEG-HCCs, overloaded PTX/PEG-HCCs and PTX/PEG-HCCs were combined 9:1 with 10× PBS to provide 1× PBS solutions. The samples were allowed to sit for 15 min before the picture was taken.
Characterization
TEM imaging was performed on a JEOL 2100. Samples were prepared from aqueous solutions of the nanomaterials that were then dropped onto 300 mesh holey lacey carbon grids on a copper support (Ted Pella, Inc.) and dried at 70°C for 16 h. The hydrodynamic diameter of each nanomaterial was characterized through dynamic light scattering (Brookhaven, ZetaPALS with BI-9000AT digital autocorrelator, λ = 656 nm). The electrophoretic mobility of these aggregates was measured by phase analysis light scattering (PALS) using the ZetaPALS setup. A dip-in (Uzgiris type) electrode system with 4 mL polystyrene cuvettes was used, and measurements were taken at 20 °C. Static light scattering experiments were carried out using a Wyatt HELEOS II detector operating in batch mode. The system was calibrated with toluene and normalized using a 5 mg/mL solution of polystyrene in toluene. Samples were measured in 20 mL glass scintillation vials, and a baseline was defined by a vial containing pure solvent (either H2O or a pH 14 aqueous solution). Particle sizes were extracted by a Zimm fit of the data. TGA was obtained on Q50 TA Instrument, using argon from room temperature to 950 °C at 10°C/min rate. UV data was collected from a Shidmadzu UV-3101 PC and samples contained in 1 mL quartz cuvettes. Samples were dissolved in deionized water. The carbon core concentration of each sample was determined by the absorbance at 763 nm using the experimentally determined extinction coefficient of 0.0104 L/mg.47 FTIR spectra were recorded using a Nicolet FTIR Infrared Microscope with ATR objective. Raman spectra were obtained on a Renishaw Raman scope using a 633 nm HeNe laser. XPS experiments were performed on a PHI Quantera SXM scanning X-ray microprobe with 26.00 eV passing energy, 45° take-off angle and a 100 µm beam size. AFM was done using a Nanoscope IIIa (Digital Instrtument/Veeco Metrology) under tapping mode, scan rate of 1 Hz and a resolution of 512 × 512 was used to record AFM images. Si tips n-doped with 1–10 • cm phosphorus, Veeco, MPP-11100-140 were also used. Samples were prepared by spin coating aqueous solutions of HCC and PEG-HCC at 3,000 rpm for 10 min on top of mica surface (Ted Pella) and then rinsing with isopropanol. HPLC analysis was performed using a Waters 2695 Separations Module with a Waters 2487 Dual λ Absorbance Detector, the reading obtained at 254 nm was used. A Phenomex BioSep-SEC-S 2000 column was used. A flow of 0.8 mL/min was used for the eluent, which was 100% water from 0–15 min, then linearly ramped to 30% water/70% methanol at 25 min and linearly ramped back to 100% water at 35 min.
Toxicity Studies
Animal Care
BALB/c (nu-/nu-) mice were used under an animal protocol approved by the Institutional Animal Care and Use Committee at The University of Texas MD Anderson Cancer Center, which is accredited by the Association for the Assessment and Accreditation of Laboratory Animal Care, International (AAALAC). The mice were kept in sterile ventilated microisolators with corncob bedding and offered Harlan, Teklad Irradiated Diet # 2919 and reverse osmosis water. The mice were free of the following pathogens based on sentinel testing: Mouse Parvo virus (MPV), Minute Virus of Mice (MVM), Theiler’s Virus (GD7), Epidemic Diarrhea of Infant Mice (EDIM), Pneumonia Virus of Mice (PVM), Reovirus 3 (REO3), Mouse Adenovirus (MAD), K-virus (K), Polyoma Virus (poly), Mycoplasma pulmonis (M. pul), Mouse Hepatitis virus (MHV), Ectromelia Virus, Lymphocytic Choriomeningitis Virus (LCMV), intestinal parasites and ectoparasites. For the portion of the study where urine and feces were collected, the mice were kept in sterile metabolism cages and offered autoclaved reverse osmosis water and irradiated diet.
Optical microscopy of organs
Each organ was excised and fixed with 10% formalin in phosphate buffer saline (pH 7.4) and were processed by embedding in paraffin. For organ histology, sections of each organs was taken and placed on glass slides and stained using hematoxylin and eosin. Evaluation of each sample was done by a certified pathologist using optical microscope (Olympus BX61, Center Valley, PA, USA).
Chemistry and Hematology Analysis
Blood chemistry tests were performed with a Roche COBAS INEGRA 400 plus and Software version 3.4.4.0809 and complete blood counts with a Simerns BayerAdvia 120 Hematology 69 Analyzer.. Both tests were completed by UTMDACC Animal Pathology Core laboratory (CCSG – CA016672)
Short-Term Toxicity of PEG-HCCs in Healthy Mice
15 BALB/c (nu-/nu-) mice were randomized into 3 mice per group for each PEG-HCC concentration (200 mg/L, 500 mg/L, and 1000 mg/L) and one control group which received saline. Each group received a tail-vein injection of 200 µL of PEG-HCCs or saline. The mice were visually monitored for 5 d. After 5 d the mice were euthanized using CO2. A terminal blood sample was collected and sent for pathology work. Various organs were also harvested (including heart, liver, lungs, kidneys, spleen, and brain) and placed in formalin for histology work.
Longer-Term Toxicity of PEG HCCs in Healthy Mice
30 BALB/c (nu-/nu-) mice were randomized into 5 mice per group for each time point (1, 2, 4, 6, 8, 10 wk). Each group received a tail-vein injection of 200 µL of PEG-HCCs 1× per week until euthanization. The mice were weighed daily. The mice were euthanized using CO2. A terminal blood sample was collected and analyzed. Various organs were also harvested (including heart, liver, lungs, kidneys, spleen, and brain) and placed in formalin for histology.
Effect of treatment on the In Vitro Growth of Squamous Cancer Cells
General
The OSC-19 line was obtained from the Laboratory of Dr. Faye Johnson at M. D. Anderson Cancer Center. This cell line was established in Japan from a metastatic tumor to a cervical lymph node of a patient with well-differentiated SCC of the tongue.48 This cell line was grown in vitro in Dulbecco’s modified Eagle’s medium (DMEM) supplemented with 10% fetal bovine serum (FBS), L-glutamine, sodium pyruvate, nonessential amino acids and a 2-fold vitamin solution (Life Technologies, Inc., Grand Island, NY). The SqCC/Y1 human HNSCC line was obtained from the Laboratory of Dr. Vali Papadimitrakopoulou at M.D. Anderson Cancer Center. The H1975 human lung adenocarcinoma cell line was obtained from the Laboratory of Dr. John Heymach at M.D.Anderson Cancer Center. The A549 human non–small cell lung cancer was obtained from American Type Culture Collection (Rockville, MD). H1975 cells and A549 cells were maintained in RPMI 1640 containing penicillin-streptomycin (Flow Laboratories, Rockville, MD), nonessential amino acids, sodium pyruvate, L-glutamine and 10% fetal bovine serum (FBS). The SqCC/Y1 cells were maintained in DMEM/F12 low glucose containing penicillin-streptomycin, L-glutamine and 10% FBS. Adherent monolayer cultures were maintained on plastic and incubated at 37 °C in 5% CO2 and 95% air. The cultures were free of Mycoplasma species and were maintained for no longer than 12 weeks after recovery from frozen stocks.
MTT Assay
Cells were grown for 24 h in a 96-well plate (2000 cells/well in 100 µL of 10% serum containing media) at 37 °C in 5% CO2 and 95% air before treating with drugs. Serial dilutions of known PTX concentrations (500.0, 166.7, 55.6, 18.5, 6.17, 2.06, 0.69, 0.23, 0.08 nM) were prepared in media from each of the initial drug stock solutions (PTX/PEG-HCCs {PTX 1 mg/mL, PEG-HCCs 100 mg/L}, PEG-HCCs {PEG-HCCs 100 mg/L}, and PTX/Cremophor EL {PTX 6 mg/mL}). For each sample, 100 µL of each dilution was added to six wells. The cells were incubated for three d at 37 °C, then MTT solution (25 µL of 2 mg/mL) was added in each well. After incubation for 2 h, the media was removed by careful aspiration to avoid suctioning of the cells. Then, 100 µL of DMSO was added to each well in order to lyse the cells and solubilize the colored crystals. Finally, the plates were analyzed using an ELISA plate reader at a wavelength of 570 nm to measure optical density (OD) of each well, which proportionate to number of viable cells in each well. The percent of viable cells relative to control was obtained by dividing the average OD for the treated wells by the OD for the control wells.
Stability assay
A PTX/PEG-HCCs solution was stored at room temperature while a PTX/Cremophor (Taxol®) solution was stored in the refrigerator at 4 °C. For each week indicated, an MTT assay was performed using new OSC-19 cells and the PTX/PEG-HCCs and PTX/Cremophor solutions.
In Vivo Tumor Treatment
Animals and Maintenance
Male athymic nude mice, age 8 to 12 weeks, were purchased from the animal production area of the National Cancer Institute-Frederick Cancer Research and Development Center (Frederick, MD). The mice were housed and maintained in laminar flow cabinets under specific pathogen-free conditions in facilities approved by the American Association for Accreditation of Laboratory Animal Care in accordance with current regulations and standards of the US Department of Agriculture, the US Department of Health and Human Services, and the National Institute of Health. The mice were used in accordance with the Animal Care and Use Guidelines of the University of Texas M.D. Anderson Cancer Center (Houston, TX) under a protocol approved by the Institutional Animal Care Use Committee. The tumor sizes were measured with microcalipers. Tumor volume (V) was calculated using the formula V = (A)(B2)• /6 (A, the longest dimension of the tumor; and B, the dimension of the tumor perpendicular to A).
In Vivo experiments
36 nude mice were injected in the tongue with 5×10⁴ squamous cell carcinoma OSC-19 cells suspended in serum-free DMEM, as described previously.40 12 d after the injection, tumor size was measured and all of the mice had similar sized tumors. The mice were randomized into four groups. Treatments (PBS as a placebo {n=9}, PTX/PEG-HCCs {PTX 1 mg/mL, PEG-HCCs 100 mg/L, n=9}, PTX/Cremophor EL {PTX 1 mg/mL, n=9}, PEG-HCCs {PEG-HCCs 100 mg/L, n=5}) were administered intravenously on d 12, 19 and 26 following cell injection by injecting 200 µL into the tail veins of the mice. The mice were examined twice a week for tumor size and weight loss. The mice were euthanatized using carbon dioxide asphyxiation if they lost more than 20% of their preinjection body weight or became moribund. The remaining mice were euthanized at 50 d post-cell inoculation.
Synthesis of [111In]DTPA-PEG-HCCs
Synthesis of amino, alkynyl functionalized PEG
A tube that could be sealed was oven dried, fitted with a septa and pump/filled 3 times. THF (10 mL) and potassium bis(trimethylsilyl)amide (2.22 mL, 1.11 mmol) were added and the solution was cooled to −78 °C. In a graduated cylinder fitted with a septa, ethylene oxide (5 mL, 100 mmol) was condensed at −78 °C in the presence of CaH2 (250 mg) and canula transfered to the reaction tube. The septum on the reaction tube was removed and the tube was quickly sealed. The reaction was stirred at 60 °C for 48 h. The reaction was cooled to rt and allyl bromide (278 µL, 25 mmol) was added. The tube was resealed, and the reaction was stirred at 45 °C for 24 h. The solution was cooled to rt and transferred to a sepratory funnel. Water (30 mL) was added and the solution was extracted with CHCl3. The combined CHCl3 extracts were dried with MgSO4, filtered to remove the MgSO4 and concentrated to 10 mL. Et2O was added, precipitating the polymer, which was recrystallized from EtOH and dried to yield 3.6 g of amino, alkynyl functionalized PEG. GPC analysis indicated the polymer had a MW of 5900 and a PDI of 1.32. 1H NMR (400 MHz, CDCl3, ppm) δ 4.21 (d, 2H J = 2.4 Hz), 3.75−3.54 (m), 2.45 (t, 1H, J = 2.4 Hz).
Synthesis of DTPA-PEG-NH2
p-SCN-Bn-DTPA (donated by Macrocyclics, http://www.macrocyclics.com, 0.059 g, 0.099 mmol) was dissolved in 2 mL of anhydrous DMF. To this was added 11-azido-2,6,9-trioxaundecan-1-amine (0.022 g, 0.099 mmol). The solution was allowed to stir under nitrogen for 12 h, followed by removal of DMF under vacuum to yield DTPA-PEG. DTPA-PEG (0.080 g, 0.160 mmol) was dissolved in water (8 mL) and tert-butanol (8 mL). To this was added amino, alkynyl functionalized PEG (6000 MW, 0.628 g, 0.106 mmol). It was slowly heated using a heat gun until the solid dissolved. To this was added copper sulfate (0.027 g, 0.106 mmol) and the solution quickly turned blue in color. This was followed by addition of sodium ascorbate (0.021 g, 0.106 mmol). The blue color persisted after addition of sodium ascrobate suggesting that the DTPA was chelating the copper. The solution was then transferred to a 10000 MWCO dialysis bag and placed in continuous flow DI water for 24 h. The copper was then removed by addition of sodium sulfide (0.025 mL, 0.106 mmol). The solution quickly turned brown in color; this was followed by addition of calcium hydroxide (0.008 g, 0.106 mmol). The mixture was allowed to stir for 1 h and the insoluble copper was removed by filtration. The same procedure (addition of sodium sulfide followed by addition of calcium hydroxide) was repeated a second time and the filtrate was almost colorless suggesting complete removal of copper. The water was removed under vacuum. The light-yellow-colored solid was redissolved in a minimal amount of chloroform (5 mL) and the solution was added dropwise to cold ether (50 mL). The mixture was placed in the freezer for 1 h and then filtered, providing DTPA-PEG-NH2 as a white solid, MALDI-TOF MS using a sinapinic acid matrix m/z calcd for H+C30H46N8O13S 759, found 759.
Synthesis of DTPA-PEG-HCCs
HCCs (18 mg, 1.50 mmol of carbon) were added to DMF (20 mL) and the mixture was sonicated using a bath sonicator for 30 min, at which point all of the HCCs were dissolved. DCC (310 mg, 1.50 mmol) was added and the reaction was stirred for 30 min. DTPA-PEG-NH2 (100 mg, 0.015 mmol) and DMAP (2 flakes) were added and the reaction was stirred for 24 h. The solution was purified by dialysis in DMF for 1 d and then water for 5 d (50,000 MW cut-off dialysis bag, Membrane Filtration Products, Inc. Cat# 1-5050-34), followed by passage through a PD-10 column (GE Healthcare).
Synthesis of 111In-DTPA-PEG-HCCs
DTPA-PEG-HCCs (6 mL, 200 mg/L of HCC core) were placed in a small vial. To this was added 111In (130 µCi) in 200 µL sodium acetate (0.1 M). The solution was vortexed for 1 min and then allowed to stand for 20 min before passage through a PD-10 column. The [111In]DTPA-PEG-HCCs were then diluted with saline to a concentration of 200 mg/L of HCC core.
EDTA Challenge of111 In binding to PEG-HCCs or DTPA-PEG-HCCs
PEG-HCCs or DTPA-PEG-HCCs (100 µL) were placed in a vial. To this was added 111In (160 µCi) in an aqueous solution of sodium acetate (0.1 M). The solution was vortexed and then allowed to stand for 30 min before passage through a PD-10 column. The solutions obtained were analyzed for 111In binding using instant TLC. The instant TLC strips were developed with PBS (pH 7.4) containing 4 mM EDTA and quantified using a Bioscan IAR-2000 TLC Imaging Scanner (Bioscan). Free 111In moved to the solvent front (Rf = 0.9), and the [111In]-DTPA-PEG-HCCs remained at the original spot (Rf = 0.0).
Preparation of PTX/111In-PEG-HCCs
To a vigorously stirring solution of 111In-PEG-HCCs (10 mL, 200 mg/L) in a round bottom flask was added dropwise PTX (10 mg) in methanol (MeOH, 1 mL). The solution was allowed to stir for 10 min and was then bath sonicated for 2 h. The volume was then reduced to 9 mL using a heatgun while the solution was stirring to remove the MeOH. The solution was then reconstituted to 10 mL with 10× PBS resulting in a solution of 1 mg/mL PTX and an HCC concentration of 200 mg/L.
Biodistribution Studies
Biodistribution in Healthy Mice
For each material, 30 BALB/c (nu-/nu-) mice were randomized to be used over the following 10 time points (3 mice per time point): 0.5, 1, 3, 6, 18, 24, 48, 72, 96 and 120 h. Each animal received a single i.v. injection (200 µL) of the material being studied in that group, either [111In]DTPA-PEG-Ac (0.14 µM concentration of PEG, a concentration equivalent to that of the PEG in the other samples), [111In]DTPA-PEG-HCC (200 mg/L concentration of HCC core), or PTX/[111In]DPTA-PEG-HCC (200 mg/L concentration of HCC core) dissolved in 1× PBS. After injection, each animal was placed in a plastic metabolism cage in order to collect the urine and feces. The animals were fed a Teklad, Irradiated diet #2919 and water ad libitum. For each group and time point, 3 animals were euthanized and terminal blood samples were collected and various organs were harvested (heart, liver, lungs, kidneys, spleen, brain, and tongue) and placed into pre-weighed scintillation vials. Each organ and blood sample was weighed and analyzed for 111In activity using a gamma counter. Total voided urine and excreted feces were collected every 24 h and analyzed for 111In activity.
Biodistribution in Orthotopic Squamous Cell Cancer Mouse Model
The same method was used as was used for healthy mice, except that 7 d prior to treatment, each mouse was anesthetized using 45 mg/kg Nembutal and 5×10⁵ OSC-19 cells were injected on the tongue of each animal. After the 7 d the tumor was visible.
Supplementary Material
Table 4.
White Blood Cell Population for Terminal Blood Samples.
| WBC Differential Count | |||||
|---|---|---|---|---|---|
| Time | Segs (%) | Monos (%) |
Basos (%) |
Lymphs (%) |
Eos (%) |
| 1 wk (n=5) |
35.3±3.6 | 6.14±5.0 | 0.68±0.15 | 52.3±5.2 | 3.1±1.4 |
| 2 wk (n=5) |
36.4±10.2 | 3.35±1.8 | 0.50±0.17 | 53.9±11.4 | 4.8±1.5 |
| 4 wk (n=5) |
35.1±6.8 | 2.35±0.64 | 0.48±0.13 | 54.0±6.6 | 6.0±1.5 |
| 6 wk (n=5) |
31.4±4.4 | 5.0±2.9 | 0.45±0.07 | 53.0±6.3 | 9.2±1.5 |
| 8 wk (n=5) |
34.6±6.3 | 4.4±1.2 | 0.83±0.21 | 53.3±5.6 | 5.7±1.9 |
| 10 wk (n=5) |
42.2±15.1 | 10.8±6.9 | 0.70±0.01 | 39.0±6.8 | 7.0±7.3 |
Acknowledgement
We thank Z. Sun for the TEM images, J. Yu for DLS and zeta potential measurements, R. Verduzco for SLS measurements, K. Mohamedali for assistance with HPLC analysis, the Alliance for NanoHealth through a subcontract from the University of Texas Health Science Center, Houston (Department of Defense: W8XWH-07-2-0101); the Traumatic Brain Injury Consortium, funded by the United States Army; the Nanoscale Science and Engineering Initiative of the National Science Foundation under NSF Award EEC-0647452 for funding through the NSF Center for Biological and Environmental Nanotechnology; The University of Texas M. D. Anderson Cancer Center (UTMDACC) PANTHEON Program; NIH Cancer Center Support Grant CA16672; UTMDACC Cancer Center Support Grant (CA016672); The DTPA isothiocyanate was kindly provided by Garry Kiefer at Macrocyclics, Inc.
Footnotes
Supporting Information. AFM and XPS for the PEG-HCCs and HCCs, experimental procedures for each figure and complete cell and animal information are available free of charge via the Internet at http://pubs.acs.org.
References
- 1.O’Driscoll CM, Griffin BT. Biopharmaceutical Challenges Associated With Drugs With Low Aqueous Solubility—The Potential Impact of Lipid-Based Formulations. Adv. Drug Deliv. Rev. 2008;60:617–624. doi: 10.1016/j.addr.2007.10.012. [DOI] [PubMed] [Google Scholar]
- 2.Stinchcombe TE. Nanoparticle Albumin-Bound Paclitaxel: a Novel Cremphor-EL®-Free Formulation of Paclitaxel. Nanomedicine. 2007;2:415–423. doi: 10.2217/17435889.2.4.415. [DOI] [PubMed] [Google Scholar]
- 3.Gradishar WJ, Tjulandin S, Davidson N, Shaw H, Desai N, Bhar P, Hawkins M, O’Shaughnessy J. Phase III Trial Of Nanoparticle Albumin-Bound Paclitaxel Compared With Polyethylated Castor Oil-Based Paclitaxel In Women With Breast Cancer. J. Clin. Oncol. 2005;23:7794–7803. doi: 10.1200/JCO.2005.04.937. [DOI] [PubMed] [Google Scholar]
- 4.See for example: Gursoy N, Garrigue JS, Razafindratsita A, Lambert G, Benita S. Excipient Effects on In Vitro Cytotoxicity of a Novel Paclitaxel Self-Emulsifying Drug Delivery System. J. Pharm. Sci. 2003;92:2411–2418. doi: 10.1002/jps.10501.
- 5.See for example: Chen H, Zhang Z, McNulty C, Olbert C, Yoon HJ, Lee JW, Kim SC, Seo MH, Oh HS, Lemmo AV, et al. A High-Throughput Combinatorial Approach for the Discovery of a Cremophor EL-Free Paclitaxel Formulation. Pharm. Res. 2003;20:1302–1308. doi: 10.1023/a:1025021603288.
- 6.See for example: Crosasso P, Ceruti M, Brusa P, Arpicco S, Dosio F, Cattel L. Preparation, Characterization and Properties of Sterically Stabilized Paclitaxel-Containing Liposomes. J. Control. Release. 2000;63:19–30. doi: 10.1016/s0168-3659(99)00166-2.
- 7.See for example: Shuai XT, Merdan T, Schaper AK, Xi F, Kissel T. Core-Cross-Linked Polymeric Micelles as Paclitaxel Carriers. Bioconjug. Chem. 2004;15:441–448. doi: 10.1021/bc034113u.
- 8.See for example: Ruan G, Feng S-S. Preparation and Characterization of Poly(lactic Acid)–Poly(ethylene Glycol)–Poly(lactic Acid) (PLA–PEG–PLA) Microspheres for Controlled Release of Paclitaxel. Biomaterials. 2003;24:5037–5044. doi: 10.1016/s0142-9612(03)00419-8.
- 9.For a recent review, see: Riehemann K, Schneider SW, Luger TA, Godin B, Ferrari M, Fuchs H. Nanomedicine—Challenge and Perspectives. Ang. Chem. Int. Ed. 2009;48:872–897. doi: 10.1002/anie.200802585.
- 10.Ferrari M. Cancer Nanotechnology: Opportunities and Challenges. Nat. Rev. Cancer. 2005;5:161–171. doi: 10.1038/nrc1566. [DOI] [PubMed] [Google Scholar]
- 11.For a review of dendrimers, see: Lee CC, MacKay JA, Fréchet JMJ, Szoka FC. Designing Dendrimers for Biological Applications. Nat. Biotechnol. 2005;23:1517–1526. doi: 10.1038/nbt1171.
- 12.Kostarelos K, Bianco A, Prato M. Promises, Facts and Challenges for Carbon Nanotubes in Imaging and Therapeutics. Nat. Nanotechnol. 2009;4:627–633. doi: 10.1038/nnano.2009.241. [DOI] [PubMed] [Google Scholar]
- 13.Wu H-C, Chang X, Liu L, Zhao F, Zhao Y. Chemistry of Carbon Nanotubes in Biomedical Applications. J. Mater. Chem. 2010;20:1036–1052. [Google Scholar]
- 14.Yinghuai A, Peng AT, Carpenter K, Maguire JA, Hosmane NS, Takagaki M. Substituted Carborane-Appended Water-Soluble Single-Wall Carbon Nanotubes: New Approach to Boron Neutron Capture Therapy Drug Delivery. J. Am. Chem. Soc. 2005;127:9875–9880. doi: 10.1021/ja0517116. [DOI] [PubMed] [Google Scholar]
- 15.Bhirde AA, Patel V, Gavard J, Zhang G, Sousa AA, Masedunskas A, Leapman RD, Weigert R, Gutkind JS, Rusling JF. Targeted Killing of Cancer Cells in Vivo and in Vitro with EGF-Directed Carbon Nanotube-Based Drug Delivery. ACS Nano. 2009;3:307–316. doi: 10.1021/nn800551s. [DOI] [PMC free article] [PubMed] [Google Scholar]
- 16.Chen J, Chen S, Zhao X, Kuznetsova LV, Wong SS, Ojima I. Functionalized Single-Walled Carbon Nanotubes as Rationally Designed Vehicles for Tumor-Targeted Drug Delivery. J. Am. Chem. Soc. 2008;130:16778–16785. doi: 10.1021/ja805570f. [DOI] [PMC free article] [PubMed] [Google Scholar]
- 17.Liu Z, Chen K, Davis C, Sherlock S, Cao Q, Chen X, Dai H. Drug Delivery with Carbon Nanotubes for In vivo Cancer Treatment. Cancer Res. 2008;68:6652–6660. doi: 10.1158/0008-5472.CAN-08-1468. [DOI] [PMC free article] [PubMed] [Google Scholar]
- 18.For a recent review, see: Jesorka A, Orwar O. Liposomes: Technologies and Analytical Applications. Annu. Rev. Anal. Chem. 2008;1:801–832. doi: 10.1146/annurev.anchem.1.031207.112747.
- 19.Harrington KJ, Lewanski CR, Northcote AD, Whittaker J, Wellbank H, Vile RG, Peters AM, Stewart JSW. Phase I-II Study of Pegylated Liposomal Cisplatin (SPI-077™) in Patients With Inoperable Head and Neck Cancer. Ann. Oncol. 2001;12:493–496. doi: 10.1023/a:1011199028318. [DOI] [PubMed] [Google Scholar]
- 20.Zhang X, Meng L, Lu Q, Fei Z, Dyson PJ. Targeted Delivery and Controlled Release of Doxorubicin to Cancer Cells Using Modified Single Wall Carbon Nanotubes. Biomaterials. 2009;30:6041–6047. doi: 10.1016/j.biomaterials.2009.07.025. [DOI] [PubMed] [Google Scholar]
- 21.Heister E, Neves V, Tilmaciu C, Lipert K, Beltran VS, Coley HM, Silva SRP, McFadden J. Triple Functionalisation of Single-Walled Carbon Nanotubes With Doxorubicin, a Monoclonal Antibody, and a Fluorescent Marker for Targeted Cancer Therapy. Carbon. 2009;47:2152–2160. [Google Scholar]
- 22.Sun X, Liu Z, Welsher K, Robinson JT, Goodwin A, Zaric S, Dai H. Nano-Graphene Oxide for Cellular Imaging and Drug Delivery. Nano Res. 2008;1:203–212. doi: 10.1007/s12274-008-8021-8. [DOI] [PMC free article] [PubMed] [Google Scholar]
- 23.Liu Z, Robinson JT, Sun X, Dai H. PEGylated Nanographene Oxide for Delivery of Water-Insoluble Cancer Drugs. J. Am. Chem. Soc. 2008;130:10876–10877. doi: 10.1021/ja803688x. [DOI] [PMC free article] [PubMed] [Google Scholar]
- 24.Ali-Boucetta H, Al-Jamal KT, McCarthy D, Prato M, Bianco A, Kostarelos K. Multiwalled Carbon Nanotube–Doxorubicin Supramolecular Complexes for Cancer Therapeutics. Chem. Comm. 2008:459–461. doi: 10.1039/b712350g. [DOI] [PubMed] [Google Scholar]
- 25.Liu Z, Sun X, Nakayama-Ratchford N, Dai H. Supramolecular Chemistry on Water-Soluble Carbon Nanotubes for Drug Loading and Delivery. ACS Nano. 2007;1:50–56. doi: 10.1021/nn700040t. [DOI] [PubMed] [Google Scholar]
- 26.Partha R, Mitchell LR, Lyon JL, Joshi PP, Conyers JL. Buckysomes: Fullerene-Based Nanocarriers for Hydrophobic Molecule Delivery. ACS Nano. 2008;2:1950–1958. doi: 10.1021/nn800422k. [DOI] [PubMed] [Google Scholar]
- 27.Lay CL, Liu HQ, Tan HR, Liu Y. Delivery of Paclitaxel by Physically Loading onto Poly(ethylene Glycol) (PEG)-Graft-Carbon Nanotubes for Potent Cancer Therapeutics. Nanotechnology. 2010;21:065101. doi: 10.1088/0957-4484/21/6/065101. [DOI] [PubMed] [Google Scholar]
- 28.Guo L, Liu X, Sanchez V, Vaslet C, Kane AB, Hurt RH. A Window of Opportunity: Designing Carbon Nanomaterials for Environmental Safety and Health. Mater. Sci. Forum. 2007;544–545:511–516. [Google Scholar]
- 29.Drezek RA, Tour JM. Is Nanotechnology Too Broad to Practise? Nat. Nanotechnol. 2010;5:168–169. doi: 10.1038/nnano.2010.37. [DOI] [PubMed] [Google Scholar]
- 30.Hurt R, Monthioux M, Kane A. Toxicology of Carbon Nanomaterials: Status, Trends, and Perspectives on the Special Issue. Carbon. 2006;44:1028–1033. [Google Scholar]
- 31.Liu Z, Davis C, Cai W, He L, Chen X, Dai H. Circulation and Long-Term Fate of Functionalized, Biocompatible Single-Walled Carbon Nanotubes in Mice Probed by Raman Spectroscopy. Proc. Nat. Acad. Sci. 2008;105:1410–1415. doi: 10.1073/pnas.0707654105. [DOI] [PMC free article] [PubMed] [Google Scholar]
- 32.Schipper ML, Nakayama-Ratchford N, Davis CR, Kam NW, Chu PS, Liu Z, Sun XM, Dai HG, Gambhir SS. A Pilot Toxicology Study of Single-Walled Carbon Nanotubes in a Small Sample of Mice. Nat. Nanotechnol. 2008;3:216–221. doi: 10.1038/nnano.2008.68. [DOI] [PubMed] [Google Scholar]
- 33.Kolosnjaj-Tabi J, Hartman KB, Boudjemaa S, Ananta JS, Morgant G, Szwarc H, Wilson LJ, Moussa F. In Vivo Behavior of Large Doses of Ultrashort and Full-Length Single-Walled Carbon Nanotubes after Oral and Intraperitoneal Administration to Swiss Mice. ACS Nano. 2010;4:1481–1492. doi: 10.1021/nn901573w. [DOI] [PubMed] [Google Scholar]
- 34.Liu X, Hurt RH, Kane AB. Biodurability of Single-Walled Carbon Nanotubes Depends on Surface Functionalization. Carbon. 2010;48:1961–1969. doi: 10.1016/j.carbon.2010.02.002. [DOI] [PMC free article] [PubMed] [Google Scholar]
- 35.Chen Z, Kobashi K, Rauwald U, Booker R, Fan H, Hwang W-F, Tour JM. Soluble Ultra-Short Single-Walled Carbon Nanotubes. J. Am. Chem. Soc. 2006;128:10568–10571. doi: 10.1021/ja063283p. [DOI] [PubMed] [Google Scholar]
- 36.Price BK, Lomeda JR, Tour JM. Aggressively Oxidized Ultra-Short Single-Walled Carbon Nanotubes Having Oxidized Sidewalls. Chem. Mater. 2009;21:3917–3923. [Google Scholar]
- 37.Duque JG, Parra-Vasquez ANG, Behabtu N, Green MJ, Higginbotham AL, Price BK, Leonard AD, Schmidt HK, Lounis B, Tour JM, et al. Diameter-Dependent Solubility of Single-Walled Carbon Nanotubes. ACS Nano. 2010;4:3063–3072. doi: 10.1021/nn100170f. [DOI] [PubMed] [Google Scholar]
- 38.Stephenson JJ, Hudson JL, Leonard AD, Price BP, Tour JM. Repetitive Functionalization of Water-Soluble Single-Walled Carbon Nanotubes. Addition of Acid-Sensitive Addends. Chem. Mater. 2007;19:3491–3498. [Google Scholar]
- 39.Recently, we have developed a different preparation that makes use of increased equivalents of PEG and DCC to synthesize the PEG-HCCs that allows up to 12 mg/mL of PTX to be sequestered. This improved synthesis was developed after the initiation of the in vitro and in vivo experiments described, so the higher-loaded nanovectors were not used.
- 40.Myers JN, Holsinger FC, Jasser SA, Bekele BN, Fidler IJ. An Orthotopic Nude Mouse Model of Oral Tongue Squamous Cell Carcinoma. Clin. Cancer Res. 2002;8:293–298. [PubMed] [Google Scholar]
- 41.Liu Z, Cai W, He L, Nakayama N, Chen K, Sun X, Chen X, Dai H. In Vivo Biodistribution and Highly Efficient Tumour Targeting of Carbon Nanotubes in Mice. Nat. Nanotech. 2007;2:47–52. doi: 10.1038/nnano.2006.170. [DOI] [PubMed] [Google Scholar]
- 42.Villa CH, McDevitt MR, Escorcia FE, Rey DA, Bergkvist M, Batt CA, Scheinberg DA. Synthesis and Biodistribution of Oligonucleotide-Functionalized, Tumor-Targetable Carbon Nanotubes. Nano Lett. 2008;8:4221–4228. doi: 10.1021/nl801878d. [DOI] [PMC free article] [PubMed] [Google Scholar]
- 43.van Dijk M, Rijkers DTS, Liskamp RMJ, van Nostrum CF, Hennink WE. Synthesis and Applications of Biomedical and Pharmaceutical Polymers via Click Chemistry Methodologies. Bioconjugate Chem. 2009;20:2001–2016. doi: 10.1021/bc900087a. [DOI] [PubMed] [Google Scholar]
- 44.Hong PKA, Li C, Banerji SK, Wang Y. Feasibility of Metal Recovery From Soil Using DTPA and its Biostability. J. Hazard. Mater. 2002;94:253–272. doi: 10.1016/s0304-3894(02)00067-5. [DOI] [PubMed] [Google Scholar]
- 45.Kang B, Yu D, Dai Y, Chang S, Chen D, Ding Y. Biodistribution and Accumulation of Intravenously Administered Carbon Nanotubes in Mice Probed by Raman Spectroscopy and Fluorescent Labeling. Carbon. 2009;47:1189–1192. [Google Scholar]
- 46.Wang Y, Li Y, Wang Q, Wu J, Fang X. Pharmacokinetics and Biodistribution of Paclitaxel-loaded Pluronic P105/L101 Mixed Polymeric Micelles. J. Pharm. Soc. Japan. 2008;128:941–950. doi: 10.1248/yakushi.128.941. [DOI] [PubMed] [Google Scholar]
- 47.Lucente-Shultz RM, Moore VC, Leonard AD, Price BK, Kosynkin DV, Lu M, Partha R, Conyers JL, Tour JM. Antioxidant Single-Walled Carbon Nanotubes. J. Am. Chem. Soc. 2009;131:3934–3941. doi: 10.1021/ja805721p. [DOI] [PubMed] [Google Scholar]
- 48.Yokoi T, Yamaguchi A, Odajima T, Furukawa K. Establishment and Characterization of a Human Cell Line Derived From a Squamous Cell Carcinoma of the Tongue. Tum. Res. 1988;23:43–57. [Google Scholar]
Associated Data
This section collects any data citations, data availability statements, or supplementary materials included in this article.


