Abstract
Despite the high prevalence of colon cancer in the world and the great interest in targeted anti-cancer therapy, only few tumor-specific gene products have been identified that could serve as targets for the immunological treatment of colorectal cancers. The aim of our study was therefore to identify frequently expressed colon cancer-specific antigens. We performed a large-scale analysis of genes expressed in normal colon and colon cancer tissues isolated from colorectal cancer patients using massively parallel signal sequencing (MPSS). Candidates were additionally subjected to experimental evaluation by semi-quantitative RT-PCR on a cohort of colorectal cancer patients. From a pool of more than 6000 genes identified unambiguously in the analysis, we found 2124 genes that were selectively expressed in colon cancer tissue and 147 genes that were differentially expressed to a significant degree between normal and cancer cells. Differential expression of many genes was confirmed by RT-PCR on a cohort of patients. Despite the fact that deregulated genes were involved in many different cellular pathways, we found that genes expressed in the extracellular space were significantly over-represented in colorectal cancer. Strikingly, we identified a transcript from a chromosome X-linked member of the human endogenous retrovirus (HERV) H family that was frequently and selectively expressed in colon cancer but not in normal tissues. Our data suggest that this sequence should be considered as a target of immunological interventions against colorectal cancer.
Keywords: human, colorectal cancer, gene expression profiling, massively parallel signature sequencing, HERVs
Introduction
According to a recent survey, human colorectal carcinoma (CC) is the third most frequent cancer worldwide, affecting predominantly people above 50 years old. The genetic pathway by which CC appears and develops has been well characterized (1). This process is accompanied by the deregulated expression of a number of genes, of which many have no immediate role in tumorigenesis. Identification of frequently deregulated gene products may nevertheless lead to the definition of a group of markers useful for the molecular characterization and staging of CC. In addition, induced expression of gene products in CC may give rise to tumor-associated antigens and elicit immune responses. Immune responses appear to be therapeutically beneficial as the clinical outcome of patients with CC was recently demonstrated to correlate with the type, density and localization of immune cells (2). Also, antibody-based therapies targeting CC-associated antigens (e.g. cetuximab against EGFR), alone or in combination with chemotherapy, have been shown to induce clinical responses in patients with CC (3). Unlike other types of cancers in which many gene products resulting from deregulated expression have been identified, only few have been found in CC. For example, we and others have previously shown that known tumor-specific gene products, in particular those belonging to the class of cancer/testis antigens, are only rarely expressed in CC (4, 5). These results prompted us to search for gene products whose expression would be frequently deregulated in CC.
The recently developed MPSS (massively parallel signature sequencing) method enables the simultaneous sequencing of over 106 gene tags located in the proximity of the 3' end of transcribed genes (6). This technique offers several advantages over previously described ones: (i) the large number of sequenced tags saturates the screen of the approximately 30'000 different genes predicted to be present in the genome; (ii) MPSS does not require a priori knowledge of the population of genes expressed in a given sample; and (iii) the relative abundance of each transcript in a given sample is more precisely determined because of the large dynamic range of the tag distribution, from zero to many thousands of tags per million (tpm).
Using MPSS, we have identified many genes that appear to be differentially expressed in normal colon (NC) and CC. We tested a subset of these candidates by semi-quantitative RT-PCR and confirmed, for most of them, their differential expression. Our analysis of CC samples obtained from more than 25 patients also uncovered the frequent and specific expression of a sequence derived from an X-linked human endogenous retrovirus. Other genes were also found to be frequently over- or under-expressed in CC samples. Altogether, our analysis identified several candidates that could serve as targets of spontaneous or induced immune responses in CC patients.
Results
MPSS analysis of normal colon and colon cancer tissue
Massively parallel signature sequencing of normal colon (NC) mucosa and primary colon cancer (CC) resulted in the identification of 10832 and 14219 tags, respectively. Of these, 5843 of the NC sample and 7267 of the CC sample mapped to annotated genes. The others mapped to genes encoded by mitochondrial DNA, non-coding reverse DNA strands, genomic and non-genomic sequences and contaminants. Based on the tags mapping to annotated genes, we found 1429 gene clusters that were expressed only in NC, 2818 only in CC and 4205 in both. Among them, several matched to more than one gene or to a single gene found on multiple chromosomes. The former could occur in the case of genes belonging to conserved families while the second is probably due to mis-annotations of the genome. After discarding these tags, a total of 6364 genes remained that were unambiguously identified by MPSS tags (4240 in NC and 5284 in CC). Of these, 1080 were expressed specifically in NC, 2124 were expressed specifically in CC and 3160 were expressed in both NC and CC. A complete list of these genes is provided in Supplementary Table 1.
The tag distribution was markedly skewed towards small counts (Figure 1A) as approximately 50% of the genes in NC and CC had fewer than 10 tpm. Similar results were obtained with other normal and neoplastic pairs of tissues, such as normal breast (NB) and breast cancer (BC) and normal melanocytes (NM) and metastatic melanoma (MM), which have been previously analyzed by MPSS [(7) and unpublished data] (Figure 1B). Interestingly, the average number of tags with counts ranging from 1-999 tpm was significantly higher in the cancer samples than in the normal samples, while the number of genes with >1000 tpm did not significantly differ. Inversely, the number of tags absent in normal tissues was significantly higher than in cancer tissues, suggesting that increased diversity of gene expression might be a hallmark of cancer cells. Since limited gene diversity is characteristic of differentiated tissues, such an increase may also indicate that tumor cells undergo dedifferentiation. Alternatively, the increased diversity of tags detected in the tumor samples might also reflect a cancer-associated differentiation of fibroblasts surrounding the tumor (desmoplastic reaction) (8).
Figure 1.
Quantitative distribution of genes identified by MPSS in colon and other tissues. (A) Genes (i.e. tags) expressed in NC and/or CC were divided into 6 categories based on their tpm values. The range of tpm for each category is indicated. The number of tags present in each category was compared between NC and CC. Note that the majority of genes have only a few tpm and that almost twice as many genes are not expressed in NC as compared to CC. (B) Genes expressed in normal and/or neoplastic colon, breast or melanocyte were divided as in (A). The number of genes (tags) in each category was compared between normal and cancer tissues. Significantly more genes identified by 1-999 tags are found in cancer cells. Inversely, significantly more genes are not expressed in normal cells. The star denotes P value <0.05. (C) Scatter plot distribution of the tpm of commonly expressed genes in NC and CC. The interval between the two diagonal lines that intersect both axes at 20 tpm encompasses 95% of the 580 commonly expressed genes and defines the threshold outside which tpm differences should become significant.
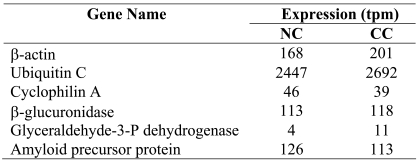
The degree of gene expression variability in the MPSS analysis of NC and CC samples was first assessed by comparing the tpm values of 5 bona fide housekeeping genes defined in (9) (β-actin, ubiquitin C, cyclophilin A, β-glucuronidase and GAPDH) and of the amyloid precursor protein (APP), previously described to be expressed at nearly identical levels in NC and CC (10). As shown in Table 1, the tpm values corresponding to these genes were found to be equivalent in NC and CC. We next extended our analysis to assess the overall degree of tpm variability between pairs of tags derived from NC and CC samples in order to define more accurately the threshold above which a difference in tpm may become significant. To achieve this, we exploited the results of a previous MPSS analysis of 32 normal human tissues (11). We selected the 580 unambiguously identified genes for which tags had been detected in all 32 tissues and defined them as commonly expressed genes. Subsequently, we monitored the tpm variability of those genes in the NC and CC samples. We found that the tpm of approximately 95% of these commonly expressed genes varied by less than a factor 20 between the NC and CC samples (Figure 1C). Only 25 commonly expressed genes (4.31%) showed tpm differences greater than 20 and were similarly distributed along either axis of the scatter plot. Based on these results, we defined our cut-off value at 20. Using this value and excluding genes absent from NC or CC, we found that 61 and 86 genes were significantly overexpressed in NC and CC, respectively (reducing the cut-off value to 10 resulted in 145 and 212 genes potentially overexpressed in NC and CC, respectively). These numbers are surprisingly small considering that approximately 50% of the 6364 genes identified by MPSS appeared to be expressed selectively in NC or CC.
Table 1.
Housekeeping genes expressed in NC and CC.
Identification of gene ontology (GO) terms associated with NC and CC
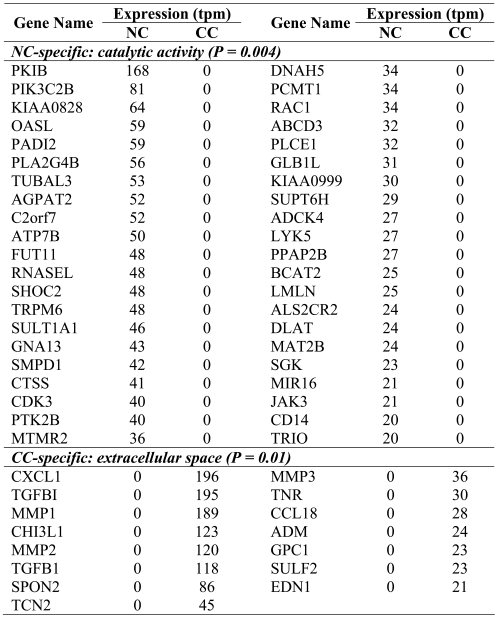
Among the many differentially expressed genes, we sought to identify groups of genes that would allow us to discriminate between NC and CC. To do this, we selected to use the GO-slim vocabulary. Three GO-slim terms were significantly over-represented in NC (P <0.01). They were defined by the terms "catalytic activity", "metabolic process" and "transferase activity" and comprised 42, 28 and 23 genes, respectively (Table 2 and data not shown). Interestingly, 15 of the 23 genes identified by the GO term "transferase activity" were kinases (n = 8) or transferases (n = 7). Two different GO-slim terms were also significantly over-represented in CC: "extracellular space" (P = 0.01) and "nucleus" (P = 0.005). Genes identified by the first GO-slim term regrouped primarily genes involved in matrix remodeling, invasion and motility (Table 2). These included members of the TGF-β family, matrix metalloproteases, tenascin, and chemokines. These results suggest that some biological characteristics of the genes uncovered by MPSS are discriminative between NC and CC.
Table 2.
GO-slim categories over-represented in NC and CC.
Validation of differentially expressed genes
Based on the MPSS databases of normal and neoplastic colon, breast and melanocyte, we performed Boolean searches to identify differentially expressed genes. The results of these queries were then ranked in decreasing order, with the gene displaying maximal tpm differences at the top of the list. Only genes with tpm differences >20-fold between NC and CC were considered. For each of the selected categories, we chose the top 3-6 candidates and validated their expression profile by semi-quantitative RT-PCR.
Genes specifically expressed in CC
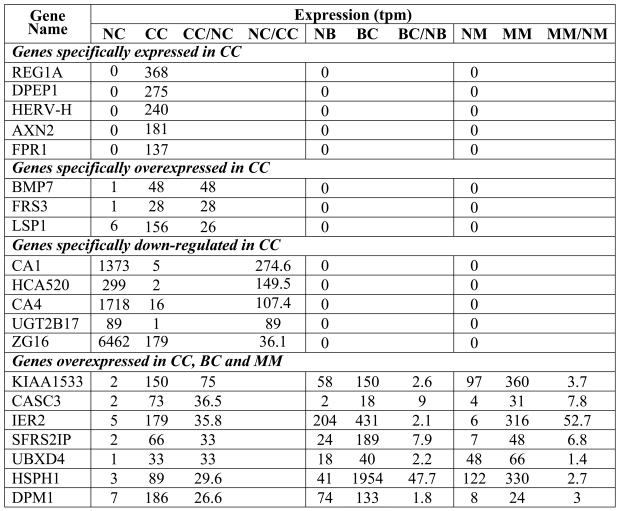
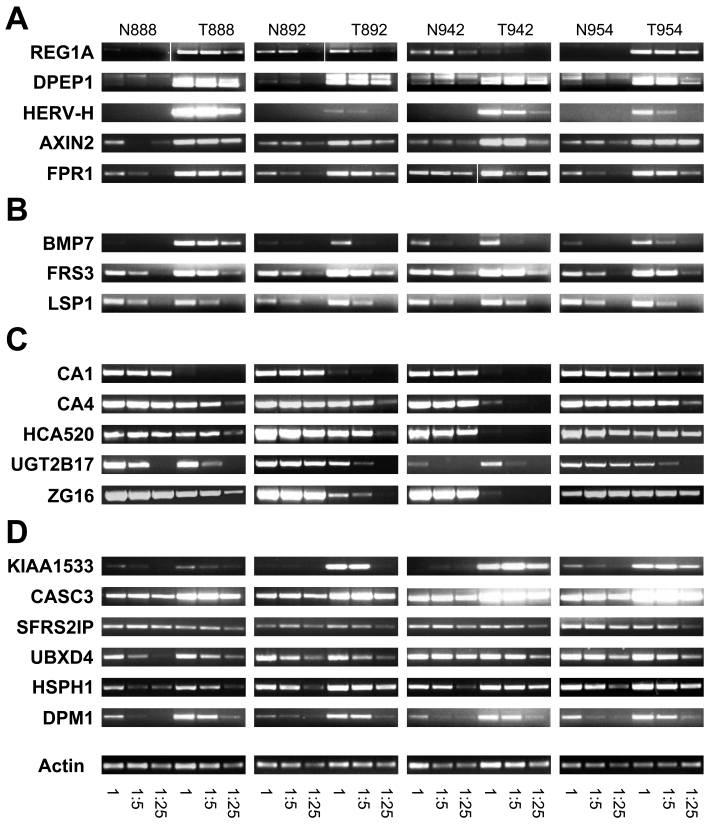
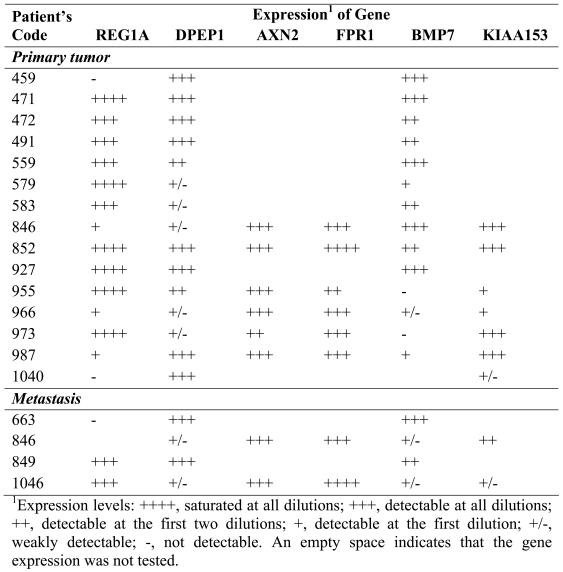
These genes were identified based on the detection of MPSS tags in samples from CC but not in samples from NC, NB and NM. Among the 130 unambiguously identified genes in this category, we performed experimental validation on the 5 candidates showing the highest number of tags in CC (Table 3 and Figure 2A). PCR was first performed on five-fold dilutions of the cDNAs from individual NC and CC samples of the 4 patients included in our MPSS analysis. As shown in Figure 2A, expression of regenerating islet-derived 1α (REG1A) was found to be specifically expressed in CC samples from 2 of the 4 patients; no differential expression was detectable in the remaining 2 patients. Analysis of an additional 15 primary tumors revealed REG1A expression in 13 samples and in 2 of 3 liver metastases (Table 4). REG1A was overexpressed in 5 of 6 tumor samples for which matched NC tissue was available. While these results confirmed a previous report on the overexpression of REG1A in CC (12), the complete absence of tags from the NC samples could not be confirmed experimentally. Expression of renal dipeptide peptidase 1 (DPEP1) was clearly detectable in CC samples but only weakly visible in the NC samples. Similar results were found in primary CC samples of 15 additional patients and 4 metastases (Table 4). Again, this result confirmed previously reported overexpression of DPEP1 in CC (13). Most striking was the expression of the endogenous retroviral element HERV-H located on chromosome Xp22, which was exclusively detected in CC. This retroviral sequence has been reported by others to be specifically expressed in CC lesions (14). No signal was detectable in any of the 4 tumor-matched NC samples. Moreover, we confirmed for each sample that no PCR amplification was detectable in the absence of reverse transcription (data not shown). Further analyses of this transcript are described below. Finally, axin-2 (AXN2) and formyl peptide receptor 1 (FPR1) were clearly overexpressed in the CC samples of all 4 patients. Analyses of additional patients confirmed these findings (Table 4). It is interesting to note that in patient 846 (whose primary and related metastatic lesions were available) the expression levels of all genes were similar in the primary and metastatic lesions. Altogether, the genes belonging to this category were frequently overexpressed in CC but their expression was not restricted solely to CC, with the exception of HERV-H.
Table 3.
Categories of genes with the greatest tpm difference between normal and cancer tissues.
Figure 2.
Confirmation of differentially expressed genes identified by MPSS. Semi-quantitative RT-PCR was performed on individual mRNA samples from the four patients (LAU888, LAU892, LAU942 and LAU954) used for the MPSS analysis. Three 5-fold dilutions of cDNAs were used to evaluate the differential expression profiles by PCR derived from normal tissue (N) and colon cancer (T). (A) Genes expressed specifically in CC. (B) Genes overexpressed in CC and absent from NB and NM. (C) Genes whose expression is down-regulated in CC. (D) Genes overexpressed in CC, BC and MM. For details, refer to the text and Table 3.
Table 4.
Expression of selected genes in a cohort of patients.
Genes overexpressed in CC
Next, we identified genes that were overexpressed in CC by calculating the tpm ratio between CC and NC. Genes with 0 tpm in NC, as well as those present in NB or NM, were excluded. We performed semi-quantitative RT-PCR on the only 3 unambiguously identified genes overexpressed by a factor of 20 or more in CC and absent from NB and NM (Table 3). As shown in Figure 2B, bone morphogenetic protein (BMP7), a member of the TGF-β superfamily, and membrane-anchored FGF receptor substrate 3 (FRS3) were clearly overexpressed in CC. BMP7 was also detected in 12/14 samples of primary CC and 4/4 of liver metastases, while its expression remained mostly undetectable in 6 tumor-matched NC samples (Table 4). Expression of lymphocyte-specific protein 1 (LSP1) was only marginally overexpressed in patients 892 and 942 and equally expressed in patients 888 and 954.
Genes down-regulated in CC
We searched among colon-specific genes (i.e. absent from NB and NM) for those that demonstrated the greatest reduction in tpm between NC and CC (Table 3). As shown in Figure 2C, expression of carbonic anhydrase 1 (CA1) and 4 (CA4), HCA520, UGT2B17 and zymogen granule protein 16 (ZG16) was down-regulated in most CC samples, confirming the results predicted by MPSS. HCA520 was reported to be expressed in several normal tissues but not in tumor cell lines of different histological origins, except for an ovarian cancer cell line (15). ZG16 was also found to be down-regulated or even absent in over 80% of hepatocellular carcinomas (16), while CA1 was reported to be down-regulated in a large proportion of CC (17, 18) and decreased expression of CA4 in renal cell carcinomas was associated with poor patients' prognosis (19). Considering that tumor cells may undergo dedifferentiation, decreased expression of some of these genes that are typically expressed in terminally differentiated cells may be expected.
Genes overexpressed in multiple cancers
Finally, we searched for genes that were not only overexpressed in CC but also in BC and MM. Criteria for the selection of such candidate genes were that their tpm values be >0 in normal tissues NC, NB and NM, the tpm ratio between NC and CC >20 and the ratio between normal and neoplastic breast and melanocyte be >1. Among the 13 genes fulfilling these criteria, the 7 genes with highest tpm ratios between NC and CC are shown in Table 3, together with their tpm ratios between normal and neoplastic breast and melanocyte. Within this category, KIAA1533, cancer susceptibility candidate 3 (CASC3/MLN51) and dolichol-phosphate mannosyltransferase (DPM1) were most clearly overexpressed in CC, heat shock protein 105 (HSPH1) was moderately overexpressed while splicing factor R/S-rich 2 interacting protein (SFRS2IP) and UBX domain-containing protein 4 (UBXD4) were not (Figure 2D). Again, with the exception of the latter two, all genes predicted to be overexpressed in CC were confirmed. CASC3 has been reported to be overexpressed in BC (and in gastric cancers) (20) and HSPH1 in a variety of tumors, including breast. It is noteworthy that HSPH1, also known as NY-CO-25, is a target of autologous antibodies in colorectal cancer patients (21). We were unable to perform PCR amplifications of IER2 in any condition tested (data not shown).
These results demonstrate the validity of MPSS in detecting differentially expressed genes. However, it should be noted that a gene with 0 tpm in a given sample analyzed by MPSS does not automatically imply that this particular gene is not expressed in that sample (see Discussion).
Expression pattern of HERV-H gag transcript
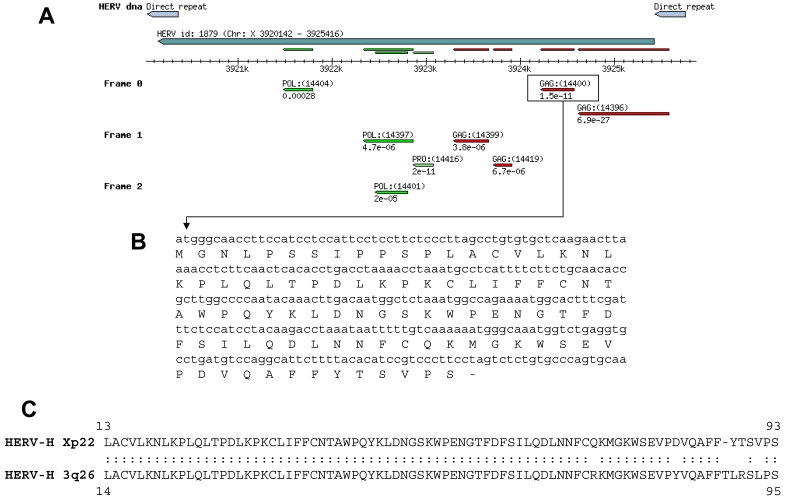
Among the genes tested above, we focused our attention on HERV-H located on chromosome Xp22. Human endogenous retroviral elements constitute up to 8% of our genome (22). Several HERV sequences were identified in our MPSS analysis (data not shown). However, HERV-H Xp22 was the only one for which a significant tag count difference between NC and CC was observed. The vast majority of the HERVs are defective, owing to the accumulation of multiple mutations and/or deletions. It has been previously reported that other members of the HERVs, in particular HERV-K, is expressed in some melanomas (23). HERVs are composed of a single open-reading frame containing, from 5' to 3', gag, pol and env, under the control of the 5' long terminal repeat (LTR) (Figure 3). Because of our interest in translated gene products and considering the high frequency of mutations leading to premature stops in the HERV transcripts, we selected pairs of oligonucleotides from the gag region situated downstream from the 5' LTR. Several putative open-reading frames (ORFs) were predicted for gag (Figure 3A). The DNA sequence of each of the predicted ORF was translated (Figure 3B and data not shown) and the amino acid sequences were used to perform protein BLAST analyses. The highest degree of homology between any of the predicted Gag ORFs and the Gag sequence of other HERVs was found for the Gag denoted GAG:(14400) in Figure 3A (Figure 3C). No homology between GAG:(14396) with any Gag protein was found, while GAG:(14399) and GAG:(14419) did not contain any initiation codons (data not shown). We performed RT-PCR on primary CC samples from 25 patients. We also analyzed 6 CC metastases to the liver and 1 sample of tubulo-villous colon adenoma. As shown in Figure 4, HERV-H gag transcripts were detected in 60% of the primary CC samples, in 7 of 8 metastases and in the pre-cancerous adenoma. In contrast, no expression of HERV-H gag transcripts was found in any of the following normal tissues: colon, liver, spleen, stomach, kidney, lung, skin, endometrium, ovary, prostate, peripheral blood monocytes and thyroid. Finally, weak expression (thin band detectable only at the lowest cDNA dilution) was found in bladder. The amplified cDNA from the gag region was sequenced and an amber mutation was found 280 bp downstream from the initiation codon. The same mutation was found in all samples analyzed (n = 7) and corresponded to the genomic sequence of chromosome X available in public databases. It is therefore unlikely to be a driving mutation that contributes to the development of CC. Taken together our results indicate that HERV-H encodes a truncated protein of 93 amino acids that could serve as target for anti-tumor therapy.
Figure 3.
Structure and sequence of HERV-H Xp22. (A) Schematic representation of the predicted open-reading frames located between the 5' and 3' LTR (direct repeat) as provided by RetroSearch.dk (HERV ID 1879; 47). Several ORFs are predicted to code for Gag and Pol. The boxed Gag region corresponds to the sequence identified in several cancer lesions. (B) Gag coding sequence and corresponding amino acid sequence. Note the presence of the stop codon TAG leading to the premature termination of the protein. (C) Alignment of the translated Gag protein sequence with the Gag of HERV-H 3q26, its closest homologue as determined by BLAST.
Figure 4.
Expression patterns of HERV-H gag transcripts in CC, CC metastases and adenoma. Black boxes indicate positive detection of the transcript by RT-PCR, while grey boxes indicate absence of detection. Data for NC is not shown as no transcript was detected.
Discussion
MPSS has been developed as a method to sequence and identify very large numbers of transcripts simultaneously. The main advantages of this technique are the unbiased identification of genes expressed in a given sample, the high number of sequenced tags ensuring complete coverage of the transcriptome and the non-saturable detection of abundant transcripts. Nevertheless, some expressed genes remain undetectable (11). Several reasons account for this, including long sequence lengths between the 3' end of the coding sequence and the polyA sequence, repetitive or highly homologous sequences, gene polymorphisms and genome mis-annotations. In the current study, the presence of false negative tags is the most relevant issue. Theoretically, a tag with 0 tpm should indicate that this particular transcript is absent from the sample. For example, a large fraction of genes was found to have 0 tpm in NC and >0 in CC. However, our validation by semi-quantitative RT-PCR did not confirm these results, as 0 tpm rarely correlated with the complete absence of detectable transcript. One reason for this is the MPSS analysis method itself, which only scores genes that have at least 1 tpm in each of at least two independent sequencing runs. Tags derived from very rare transcripts which have been found in only one run or have <0.5 counts per million sequenced tags (i.e. less than 2 tags among the 4 x 10⁶ sequenced tags) will receive the value 0, even though they have been detected at least once. A second reason is sample heterogeneity. Because we were primarily interested in identifying frequently deregulated transcripts, we have pooled the RNA from 4 individuals who may not share identical expression profiles. Moreover, the tissue was not microdissected and most likely contained other cell types, such as endothelial cells from blood vessels, stromal and immune cells. Thus, while we could confirm the frequent deregulation of genes identified by our MPSS analysis in a cohort of patients, rare RNA species expressed in the tumor cells of only 1 patient might have been diluted to levels lower than 0.5 tpm. Altogether, we conclude that the 0 tpm values should be evaluated with caution. Similar conclusions were reached by Stolovitzky and colleagues (24).
Aside from the problem of the false-negative tag counts, the question of the threshold defining over- or under-expression arose. The significance of differential gene expression in two biologically distinct samples analyzed by MPSS was previously established by statistical methods (7). However, because the tpm values of commonly expressed genes varied greatly between the NC and CC samples, we set the threshold of significance based on the following calculation: We determined the tpm variation encompassing at least 95% of the 580 commonly expressed genes between NC and CC. The value that was obtained was 20 (a 40-fold difference in tpm was required to reach 99% inclusion). This threshold may appear unusually high, as 5- to 10-fold differences in gene expression are frequently reported in comparisons between normal and cancerous tissues. It should be noted that variations between a range of so-called housekeeping genes have been experimentally tested by quantitative RT-PCR and found to vary greatly, in some cases up to 100-fold (9, 25). We would therefore conclude that the significance of a variation in gene expression that is lower than at least an order of magnitude should be considered with great caution.
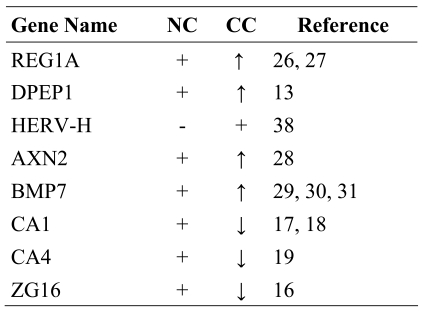
Among the genes identified by MPSS that displayed significant differential expression in NC and CC, we selected the top candidates of each category defined by a given Boolean search and confirmed the results by semi-quantitative RT-PCR. In most cases, differential expression revealed by MPSS could be confirmed, not only in the samples used for the MPSS analysis but also in those of larger cohort of CC patients. Genes such as REG1A, DPEP1, BMP7 and AXN2 had been previously found to be overexpressed in CC (13, 26-28) and other cancers, such as melanomas (29), ovarian (30) and breast cancer (31), while CA1, CA4 and ZG16 were reported to be down-regulated (Table 5). We also identified several new genes that were differentially expressed in CC, including FRS3, KIAA1533, HCA520 and DPM1. These gene products operate in seemingly distinct cellular pathways, suggesting that deregulated gene expression affects multiple pathways. It is nevertheless noteworthy that gene products active in the extracellular space appear to distinguish CC from NC.
Table 5.
Genes for which the previously described differential expression has been confirmed in this study.
Most interestingly, we uncovered the selective expression of HERV-H, an endogenous retrovirus. Human endogenous retroviral sequences are estimated to represent between 1-8% of the human genome (22, 32). Despite the fact that most of them are defective, their promoters, the 5' LTRs, remain functional and can drive not only the transcription of retroviral genes but also that of neighboring genes (33, 34). Translocation of the FGFR1 kinase downstream of a HERV 5' LTR resulted in the aberrant transcription of that gene in atypical stem-cell myeloproliferative disorder (35) and the 5' LTR of HERV-H located on chromosome 17 was recently shown to act as alternative promoter of the GSDML gene in the human colon cancer cell line HCT-116 (36). Finally, immunosuppressive properties of certain HERV sequences have also been documented (37).
The HERV-H family is the largest of the HERVs, with sequences present on almost every chromosome including chromosome X. Our study identified a transcript from the HERV-H located on chromosome Xp22 in the majority of primary and metastatic CC samples analyzed, as well as in adenoma. In contrast, no detectable expression was found in any normal tissue tested, except for bladder. Expression of that HERV was also detected in approximately 25% of non-small cell lung carcinoma but not in melanoma (data not shown). Moreover, it was reported to be expressed in approximately 40% gastric and 17% pancreatic cancers (38). This pattern of expression, i.e. lack of expression in most normal tissues, is reminiscent of a category of genes, the so-called cancer/testis genes, whose expression is restricted to testis and tumors (39). Similar to HERV-H Xp22, the majority of cancer/testis genes are also located on chromosome X. However, unlike HERV-H Xp22, which is only infrequently expressed in normal testis (data not shown), cancer/testis genes are commonly expressed in normal testis. Sequence analyses indicated that the expression of HERV-H Xp22 would generate a protein of 93 amino acids. Based on its frequent expression in CC, its limited expression in normal tissue and the predicted expression of a truncated protein, HERV-H Xp22 should be considered as a therapeutic target for the active immunotherapy of human colon cancer.
Abbreviations
- CC
colorectal carcinoma
- GO
gene ontology
- HERV
human endogenous retrovirus
- LTR
long terminal repeat
- MPSS
massively parallel signal sequencing
- NB
normal breast epithelium
- NC
normal colon
- NM
normal melanocytes
Acknowledgements
This work was supported in part by the Ludwig Institute for Cancer Research, the Cancer Research Institute, the NCCR, a research instrument of the Swiss National Foundation, the Swiss National Science Foundation and the Hans-Altschüler Foundation.
References
- 1.Kinzler KW, Vogelstein B. Lessons from hereditary colorectal cancer. Cell. 1996;87:159–170. doi: 10.1016/s0092-8674(00)81333-1. [DOI] [PubMed] [Google Scholar]
- 2.Galon J, Costes A, Sanchez-Cabo F, Kirilovsky A, Mlecnik B, Lagorce-Pages C, Tosolini M, Camus M, Berger A, Wind P, Zinzindohoue F, Bruneval P, Cugnenc PH, Trajanoski Z, Fridman WH, Pages F. Type, density, and location of immune cells within human colorectal tumors predict clinical outcome. Science. 2006;313:1960–1964. doi: 10.1126/science.1129139. [DOI] [PubMed] [Google Scholar]
- 3.Cunningham D, Humblet Y, Siena S, Khayat D, Bleiberg H, Santoro A, Bets D, Mueser M, Harstrick A, Verslype C, Chau I, Van Cutsem E. Cetuximab monotherapy and cetuximab plus Irinotecan in irinotecan-refractory metastatic colorectal cancer. N Engl J Med. 2004;351:337–345. doi: 10.1056/NEJMoa033025. [DOI] [PubMed] [Google Scholar]
- 4.Alves PM, Levy N, Bouzourene H, Viatte S, Bricard G, Ayyoub M, Vuilleumier H, Givel JC, Halkic N, Speiser DE, Romero P, Levy F. Molecular and immunological evaluation of the expression of cancer/testis gene products in human colorectal cancer. Cancer Immunol Immunother. 2007;56:839–847. doi: 10.1007/s00262-006-0228-5. [DOI] [PMC free article] [PubMed] [Google Scholar]
- 5.Li M, Yuan YH, Han Y, Liu YX, Yan L, Wang Y, Gu J. Expression profile of cancer-testis genes in 121 human colorectal cancer tissue and adjacent normal tissue. Clin Cancer Res. 2005;11:1809–1814. doi: 10.1158/1078-0432.CCR-04-1365. [DOI] [PubMed] [Google Scholar]
- 6.Brenner S, Johnson M, Bridgham J, Golda G, Lloyd DH, Johnson D, Luo S, McCurdy S, Foy M, Ewan M, Roth R, George D, Eletr S, Albrecht G, Vermaas E, Williams SR, Moon K, Burcham T, Pallas M, DuBridge RB, Kirchner J, Fearon K, Mao J, Corcoran K. Gene expression analysis by massively parallel signature sequencing (MPSS) on microbead arrays. Nat Biotechnol. 2000;18:630–634. doi: 10.1038/76469. [DOI] [PubMed] [Google Scholar]
- 7.Grigoriadis A, Mackay A, Reis-Filho J, Steele D, Iseli C, Stevenson BJ, Jongeneel CV, Valgeirsson H, Fenwick K, Iravani M, Leao M, Simpson A, Strausberg RL, Jat PS, Ashworth A, Neville AM, O'Hare MJ. Establishment of the epithelial-specific transcriptome of normal and malignant human breast cells based on MPSS and array expression data. Breast Cancer Res. 2006;8:R56. doi: 10.1186/bcr1604. [DOI] [PMC free article] [PubMed] [Google Scholar]
- 8.Tsujino T, Seshimo I, Yamamoto H, Ngan CY, Ezumi K, Takemasa I, Ikeda M, Sekimoto M, Matsuura N, Monden M. Stromal myofibroblasts predict disease recurrence for colorectal cancer. Clin Cancer Res. 2007;13:2082–2090. doi: 10.1158/1078-0432.CCR-06-2191. [DOI] [PubMed] [Google Scholar]
- 9.Blanquicett C, Johnson MR, Heslin M, Diasio RB. Housekeeping gene variability in normal and carcinomatous colorectal and liver tissues: applications in pharmacogenomic gene expression studies. Anal Biochem. 2002;303:209–214. doi: 10.1006/abio.2001.5570. [DOI] [PubMed] [Google Scholar]
- 10.Saha S, Bardelli A, Buckhaults P, Velculescu VE, Rago C, St Croix B, Romans KE, Choti MA, Lengauer C, Kinzler KW, Vogelstein B. A phosphatase associated with metastasis of colorectal cancer. Science. 2001;294:1343–1346. doi: 10.1126/science.1065817. [DOI] [PubMed] [Google Scholar]
- 11.Jongeneel CV, Delorenzi M, Iseli C, Zhou D, Haudenschild CD, Khrebtukova I, Kuznetsov D, Stevenson BJ, Strausberg RL, Simpson AJ, Vasicek TJ. An atlas of human gene expression from massively parallel signature sequencing (MPSS). Genome Res. 2005;15:1007–1014. doi: 10.1101/gr.4041005. [DOI] [PMC free article] [PubMed] [Google Scholar]
- 12.Buckhaults P, Rago C, St Croix B, Romans KE, Saha S, Zhang L, Vogelstein B, Kinzler KW. Secreted and cell surface genes expressed in benign and malignant colorectal tumors. Cancer Res. 2001;61:6996–7001. [PubMed] [Google Scholar]
- 13.McIver CM, Lloyd JM, Hewett PJ, Hardingham JE. Dipeptidase 1: a candidate tumor-specific molecular marker in colorectal carcinoma. Cancer Lett. 2004;209:67–74. doi: 10.1016/j.canlet.2003.11.033. [DOI] [PubMed] [Google Scholar]
- 14.Wentzensen N, Wilz B, Findeisen P, Wagner R, Dippold W, von Knebel Doeberitz M, Gebert J. Identification of differentially expressed genes in colorectal adenoma compared to normal tissue by suppression subtractive hybridization. Int J Oncol. 2004;24:987–994. [PubMed] [Google Scholar]
- 15.Wang Y, Han KJ, Pang XW, Vaughan HA, Qu W, Dong XY, Peng JR, Zhao HT, Rui JA, Leng XS, Cebon J, Burgess AW, Chen WF. Large scale identification of human hepatocellular carcinoma-associated antigens by autoantibodies. J Immunol. 2002;169:1102–1109. doi: 10.4049/jimmunol.169.2.1102. [DOI] [PubMed] [Google Scholar]
- 16.Zhou YB, Cao JB, Yang HM, Zhu H, Xu ZG, Wang KS, Zhang X, Wang ZQ, Han ZG. hZG16, a novel human secreted protein expressed in liver, was down-regulated in hepatocellular carcinoma. Biochem Biophys Res Comm. 2007;355:679–686. doi: 10.1016/j.bbrc.2007.02.020. [DOI] [PubMed] [Google Scholar]
- 17.Kivelä AJ, Saarnio J, Karttunen TJ, Kivelä J, Parkkila AK, Pastorekova S, Pastorek J, Waheed A, Sly WS, Parkkila S, Rajaniemi H. Differential expression of cytoplasmic carbonic anhydrases, CA I and II, and membrane-associated isozymes, CA IX and XII, in normal mucosa of large intestine and in colorectal tumors. Dig Dis Sci. 2001;46:2179–2186. doi: 10.1023/a:1011910931210. [DOI] [PubMed] [Google Scholar]
- 18.Mori M, Staniunas RJ, Barnard GF, Jessup JM, Steele GD Jr, Chen LB. The significance of carbonic anhydrase expression in human colorectal cancer. Gastroenterology. 1993;105:820–826. doi: 10.1016/0016-5085(93)90900-w. [DOI] [PubMed] [Google Scholar]
- 19.Takenawa J, Kaneko Y, Kishishita M, Higashitsuji H, Nishiyama H, Terachi T, Arai Y, Yoshida O, Fukumoto M, Fujita J. Transcript levels of aquaporin 1 and carbonic anhydrase IV as predictive indicators for prognosis of renal cell carcinoma patients after nephrectomy. Int J Cancer. 1998;79:1–7. doi: 10.1002/(sici)1097-0215(19980220)79:1<1::aid-ijc1>3.0.co;2-5. [DOI] [PubMed] [Google Scholar]
- 20.Degot S, Regnier CH, Wendling C, Chenard MP, Rio MC, Tomasetto C. Metastatic Lymph Node 51, a novel nucleo-cytoplasmic protein overexpressed in breast cancer. Oncogene. 2002;21:4422–4434. doi: 10.1038/sj.onc.1205611. [DOI] [PubMed] [Google Scholar]
- 21.Scanlan MJ, Chen YT, Williamson B, Gure AO, Stockert E, Gordan JD, Türeci Ö, Sahin U, Pfreundschuh M, Old LJ. Characterization of human colon cancer antigens recognized by autologous antibodies. Int J Cancer. 1998;76:652–658. doi: 10.1002/(sici)1097-0215(19980529)76:5<652::aid-ijc7>3.0.co;2-p. [DOI] [PubMed] [Google Scholar]
- 22.Bock M, Stoye JP. Endogenous retroviruses and the human germline. Curr Opin Genet Dev. 2000;10:651–655. doi: 10.1016/s0959-437x(00)00138-6. [DOI] [PubMed] [Google Scholar]
- 23.Schiavetti F, Thonnard J, Colau D, Boon T, Coulie PG. A human endogenous retroviral sequence encoding an antigen recognized on melanoma by cytolytic T lymphocytes. Cancer Res. 2002;62:5510–5516. [PubMed] [Google Scholar]
- 24.Stolovitzky GA, Kundaje A, Held GA, Duggar KH, Haudenschild CD, Zhou D, Vasicek TJ, Smith KD, Aderem A, Roach JC. Statistical analysis of MPSS measurements: Application to the study of LPS-activated macrophage gene expression. Proc Natl Acad Sci U S A. 2005;102:1402–1407. doi: 10.1073/pnas.0406555102. [DOI] [PMC free article] [PubMed] [Google Scholar]
- 25.Tricarico C, Pinzani P, Bianchi S, Paglierani M, Distante V, Pazzagli M, Bustin SA, Orlando C. Quantitative real-time reverse transcription polymerase chain reaction: normalization to rRNA or single housekeeping genes is inappropriate for human tissue biopsies. Anal Biochem. 2002;309:293–300. doi: 10.1016/s0003-2697(02)00311-1. [DOI] [PubMed] [Google Scholar]
- 26.Rechreche H, Montalto G, Mallo GV, Vasseur S, Marasa L, Soubeyran P, Dagorn JC, Iovanna JL. pap, reg Ialpha and reg Ibeta mRNAs are concomitantly up-regulated during human colorectal carcinogenesis. Int J Cancer. 1999;81:688–694. doi: 10.1002/(sici)1097-0215(19990531)81:5<688::aid-ijc3>3.0.co;2-r. [DOI] [PubMed] [Google Scholar]
- 27.Macadam RC, Sarela AI, Farmery SM, Robinson PA, Markham AF, Guillou PJ. Death from early colorectal cancer is predicted by the presence of transcripts of the REG gene family. Br J Cancer. 2000;83:188–195. doi: 10.1054/bjoc.2000.1227. [DOI] [PMC free article] [PubMed] [Google Scholar]
- 28.Yan D, Wiesmann M, Rohan M, Chan V, Jefferson AB, Guo L, Sakamoto D, Caothien RH, Fuller JH, Reinhard C, Garcia PD, Randazzo FM, Escobedo J, Fantl WJ, Williams LT. Elevated expression of axin2 and hnkd mRNA provides evidence that Wnt/beta-catenin signaling is activated in human colon tumors. Proc Natl Acad Sci U S A. 2001;98:14973–14978. doi: 10.1073/pnas.261574498. [DOI] [PMC free article] [PubMed] [Google Scholar]
- 29.Rothhammer T, Poser I, Soncin F, Bataille F, Moser M, Bosserhoff AK. Bone morphogenic proteins are overexpressed in malignant melanoma and promote cell invasion and migration. Cancer Res. 2005;65:448–456. [PubMed] [Google Scholar]
- 30.Sunde JS, Donninger H, Wu K, Johnson ME, Pestell RG, Rose GS, Mok SC, Brady J, Bonome T, Birrer MJ. Expression profiling identifies altered expression of genes that contribute to the inhibition of transforming growth factor-beta signaling in ovarian cancer. Cancer Res. 2006;66:8404–8412. doi: 10.1158/0008-5472.CAN-06-0683. [DOI] [PubMed] [Google Scholar]
- 31.Alarmo EL, Rauta J, Kauraniemi P, Karhu R, Kuukasjärvi T, Kallioniemi A. Bone morphogenetic protein 7 is widely overexpressed in primary breast cancer. Genes Chromosomes Cancer. 2006;45:411–419. doi: 10.1002/gcc.20307. [DOI] [PubMed] [Google Scholar]
- 32.Stauffer Y, Theiler G, Sperisen P, Lebedev Y, Jongeneel CV. Digital expression profiles of human endogenous retroviral families in normal and cancerous tissues. Cancer Immun. 2004;4:2. http://www.cancerimmunity.org/v4p2/040102.htm [PubMed] [Google Scholar]
- 33.Medstrand P, Landry JR, Mager DL. Long terminal repeats are used as alternative promoters for the endothelin B receptor and apolipoprotein C-I Genes in humans. J Biol Chem. 2001;276:1896–1903. doi: 10.1074/jbc.M006557200. [DOI] [PubMed] [Google Scholar]
- 34.Ting CN, Rosenberg MP, Snow CM, Samuelson LC, Meisler MH. Endogenous retroviral sequences are required for tissue-specific expression of a human salivary amylase gene. Genes Dev. 1992;6:1457–1465. doi: 10.1101/gad.6.8.1457. [DOI] [PubMed] [Google Scholar]
- 35.Guasch G, Popovici C, Mugneret F, Chaffanet M, Pontarotti P, Birnbaum D, Pebusque MJ. Endogenous retroviral sequence is fused to FGFR1 kinase in the 8p12 stem-cell myeloproliferative disorder with t(8;19)(p12;q13.3). Blood. 2003;101:286–288. doi: 10.1182/blood-2002-02-0577. [DOI] [PubMed] [Google Scholar]
- 36.Sin HS, Huh JW, Kim DS, Kang DW, Min DS, Kim TH, Ha HS, Kim HH, Lee SY, Kim HS. Transcriptional control of the HERV-H LTR element of the GSDML gene in human tissues and cancer cells. Arch Virol. 2006;151:1985–1994. doi: 10.1007/s00705-006-0764-5. [DOI] [PubMed] [Google Scholar]
- 37.Mangeney M, Pothlichet J, Renard M, Ducos B, Heidmann T. Endogenous retrovirus expression is required for murine melanoma tumor growth in vivo. Cancer Res. 2005;65:2588–2591. doi: 10.1158/0008-5472.CAN-04-4231. [DOI] [PubMed] [Google Scholar]
- 38.Wentzensen N, Coy JF, Knaebel HP, Linnebacher M, Wilz B, Gebert J, von Knebel Doeberitz M. Expression of an endogenous retroviral sequence from the HERV-H group in gastrointestinal cancers. Int J Cancer. 2007;121:1417–1423. doi: 10.1002/ijc.22826. [DOI] [PubMed] [Google Scholar]
- 39.Simpson AJ, Caballero OL, Jungbluth A, Chen YT, Old LJ. Cancer/testis antigens, gametogenesis and cancer. Nat Rev Cancer. 2005;5:615–625. doi: 10.1038/nrc1669. [DOI] [PubMed] [Google Scholar]
- 40.Sobin LH, Wittekind Ch, editors. TNM classification of malignant tumours. New York (NY): John Wiley & Sons. Inc.; 2002. (Eds.) 6th ed. [Google Scholar]
- 41.Brenner S, Williams SR, Vermaas EH, Storck T, Moon K, McCollum C, Mao JI, Luo S, Kirchner JJ, Eletr S, DuBridge RB, Burcham T, Albrecht G. In vitro cloning of complex mixtures of DNA on microbeads: Physical separation of differentially expressed cDNAs. Proc Natl Acad Sci U S A. 2000;97:1665–1670. doi: 10.1073/pnas.97.4.1665. [DOI] [PMC free article] [PubMed] [Google Scholar]
- 42.Iseli C, Stevenson BJ, de Souza SJ, Samaia HB, Camargo AA, Buetow KH, Strausberg RL, Simpson AJ, Bucher P, Jongeneel CV. Long-range heterogeneity at the 3' ends of human mRNAs. Genome Res. 2002;12:1068–1074. doi: 10.1101/gr.62002. [DOI] [PMC free article] [PubMed] [Google Scholar]
- 43.Jongeneel CV, Iseli C, Stevenson BJ, Riggins GJ, Lal A, Mackay A, Harris RA, O'Hare MJ, Neville AM, Simpson AJ, Strausberg RL. Comprehensive sampling of gene expression in human cell lines with massively parallel signature sequencing. Proc Natl Acad Sci U S A. 2003;100:4702–4705. doi: 10.1073/pnas.0831040100. [DOI] [PMC free article] [PubMed] [Google Scholar]
- 44.Chen YT, Scanlan MJ, Venditti CA, Chua R, Theiler G, Stevenson BJ, Iseli C, Gure AO, Vasicek T, Strausberg RL, Jongeneel CV, Old LJ, Simpson AJ. Identification of cancer/testis-antigen genes by massively parallel signature sequencing. Proc Natl Acad Sci U S A. 2005;102:7940–7945. doi: 10.1073/pnas.0502583102. [DOI] [PMC free article] [PubMed] [Google Scholar]
- 45.European Bioinformatics Institute GO-slim FTP directory. ftp://ftp.ebi.ac.uk/pub/databases/GO/goa/goslim/
- 46.NCBI Reference Sequence (RefSeq) collection. http://www.ncbi.nlm.nih.gov/RefSeq/
- 47.RetroSearch.dk. http://www.daimi.au.dk/~biopv/herv/res2/index.php
Materials and methods
Patients
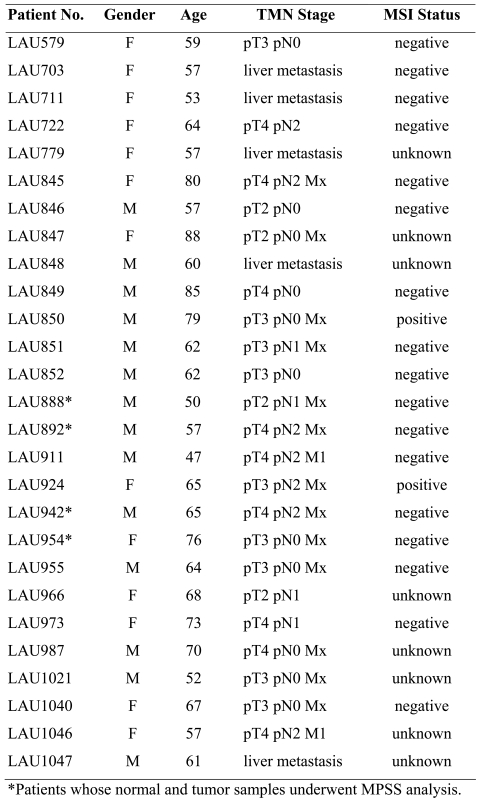
Samples from CC patients were obtained after informed consent. The study protocol was approved by the Ludwig Institute for Cancer Research ethical review committee, as well as by the medical and ethical committees of the University Hospital (Lausanne, Switzerland). All patients were operated according to standard procedures and had not undergone any preoperative treatment. Detailed information about the patients included in this study is given in Table 6.
Table 6.
Clinical characteristics of colon cancer patients evaluated by MPSS and RT-PCR.
Tissue samples and handling
Tissue samples from normal colonic mucosa (NC), CC, normal liver and CC liver metastases were obtained at the time of surgical resection. The normal tissue was collected at distant sites from the tumor. Tissue fragments were isolated with the help of a qualified pathologist, cut into small fragments and snap-frozen in liquid nitrogen. Samples were stored at -80˚C until mRNA extraction. In parallel, tissue samples were also embedded in paraffin and used for pathological analysis and tumor staging (40).
Isolation of mRNA
Frozen fragments were processed using a Qiagen RNAeasy MiniKit (Qiagen, Hilden, Germany). In brief, frozen material was weighted and mechanically dissociated by Polytron (Kinematica AG, Newark, NY, USA) in RLT buffer (1 ml/20-30 mg tissue) following the manufacturer's instructions. The samples were then treated with 30 U DNAse I (Qiagen) to remove genomic DNA. The quality and quantity of the RNA was assessed using the Agilent Bioanalyzer chip. Purified RNA was stored at -80˚C until use.
For the MPSS analysis, RNA was extracted from paired NC and CC tissues of 4 patients (LAU888, LAU892, LAU942 and LAU954). The patients were representative of the local population of CC patients and provided sufficient material for the study. Each of the NC and CC RNA samples of the 4 patients were pooled. A total of 130 µg RNA of each NC and CC pool was sent to Lynx Therapeutics (Hayward, CA) for MPSS analysis.
Sample processing and gene annotation
The samples were processed and analyzed following the "Megaclone signature" procedure described previously (6, 41). Briefly, mRNA was isolated and reverse transcribed and the cDNA was digested with the restriction enzyme DpnII. The cDNA fragment adjacent to the polyA proximal DpnII restriction site was cloned. The resulting library of templates was amplified and annealed to microbeads. The microbeads were then loaded into flow cells and the signature sequences of these templates (or tags) were determined by a series of enzymatic sequencing cycles. Approximately 4 x 10⁶ sequences were analyzed over 4 independent sequencing runs. Only tags that were detected in at least 2 independent sequencing experiments were scored. For each tag, the highest value obtained over the different sequencing runs was selected. Scoring for each tag was then calculated as follows and expressed as tag per million (tpm): tpm (tag A)=sum of tag A in run N x 106/sum of all tags in run N.
Tag sequences were assigned to known transcripts and thence to genes, using the two stage procedure described previously (42, 43) and the NCBI36 assembly of the human genome. Counts from tags that mapped to more than one transcript were discarded, unless those transcripts came from the same gene as a result of alternative splicing, in which case the counts were pooled.
MPSS data mining
A database containing all genes identified by MPSS in the NC and CC samples was assembled. This database was integrated into a larger MPSS database, which also included genes expressed in normal breast epithelium (NB) and breast cancer (BC), normal melanocyte (NM) and melanoma (MM). This larger database was used throughout this work and allowed us to compare the expression pattern of genes in NC and CC with their expression in other normal and tumor tissues of different histological origin. The assembled database was curated so as to contain only tags identifying genes unambiguously. This curated database was subjected to multiparametric Boolean searches. The list of genes identified by individual queries was then organized in such a way that the genes with the highest bias were ranked first.
To identify commonly expressed genes, a database containing unique tags identified by MPSS analyses of 32 normal tissues (44) was compared with the MPSS database described above. Even though the MPSS data from the normal and neoplastic tissues were not directly comparable with those of the 32 normal tissues because of differences in sequencing procedures, we nevertheless considered tags present in both databases to be commonly expressed.
Identification of gene ontology terms associated with genes overexpressed in CC
The representation of GO terms in genes expressed in colon was investigated using the GO-slim ontologies obtained from the EBI (45). GO terms were assigned to genes based on the associated RefSeq annotation (46) and mapped onto GO-slim using the goaslim.map file (dated 21-AUG-2007). To test for significant GO-slim terms for genes specific to NC or CC, we defined a set of colon-specific genes (see Supplementary Table 1) and assigned GO-slim terms as described. This served as the reference list for the number of genes having a given GO-slim term. We then assembled subsets of this gene list, based on expression criteria (e.g. 0 tpm in NC and at least 20 tpm in CC), and determined the number of genes having a given GO-slim term. The number of genes associated with each GO-slim term in the subset was compared to the same GO term in the reference list, and any difference tested for significance using a Fisher exact test in the R package. Only differences with P <0.05 were considered significant.
Semi-quantitative RT-PCR
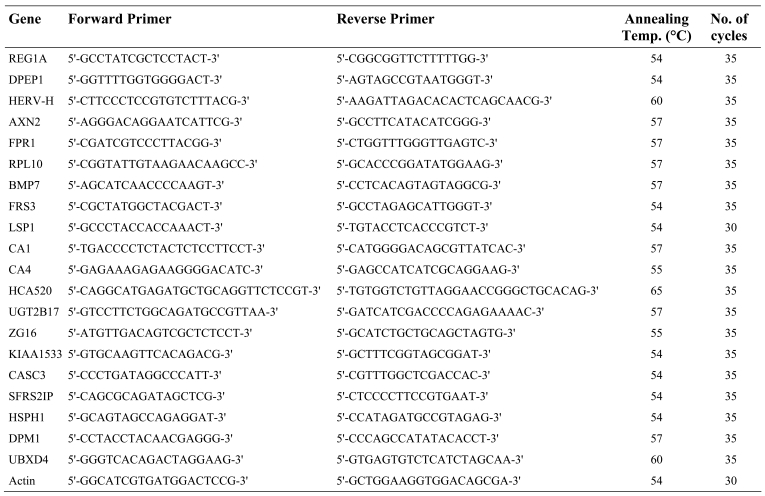
The differential expression of selected genes identified by MPSS was experimentally validated by RT-PCR, first on the material isolated from the 4 patients whose RNA had been subjected to MPSS analysis and then on the material isolated from a larger cohort of colon cancer patients. The sequences of primer pairs used to amplify each gene and the amplification conditions are listed in Table 7. Primer pairs were designed in such a way that they matched coding sequences separated by at least one intron (except for the intron-less HERV-H sequence). The housekeeping gene β-actin was used as calibrator. All oligonucleotides were purified by HPLC. Semi-quantitative PCR was performed on serial 5-fold dilutions of cDNA. Complementary DNA was produced using 100 U M-MLV reverse transcriptase per µg of RNA, following the manufacturer's protocol. However, for the analysis of the intron-less HERV-H sequences, an additional DNAse treatment was performed before reverse transcription so as to ensure absence of genomic DNA contamination. DNA sequencing of the HERV-H gag region was performed on amplified cDNA.
Table 7.
Primer sequences and PCR conditions used in this study.
Supplemental data
Download from http://www.cancerimmunity.org/v8p11/080510_suppl_tab1.txt (522 KB tab-delimited TXT file).
Associated Data
This section collects any data citations, data availability statements, or supplementary materials included in this article.
Supplementary Materials
Download from http://www.cancerimmunity.org/v8p11/080510_suppl_tab1.txt (522 KB tab-delimited TXT file).


