

Abstract
There are only a few available methods to study lateral interactions and self assembly of transmembrane helices. One of the most frequently used methods is sodium dodecylsulfate polyacrylamide gel electrophoresis (SDS-PAGE) which can report on strong interactions between peptides in SDS solution. Here we offer a cautionary tale about studying the folding and assembly of membrane proteins using peptides and SDS-PAGE experiments as membrane mimetic systems. At least for the specific peptide and detergent systems studied here, we show that a polar asparagine residue in the 12th position of an otherwise hydrophobic helical segment of 20 amino acids causes a peptide to migrate on SDS-PAGE gels with an apparent molecular weight that is twice its true molecular weight, suggesting dimerization. However when examined carefully in SDS solutions and in situ in the polyacrylamide gel itself using Forster resonance energy transfer no interaction can be detected. Instead we show evidence suggesting that differential interactions between peptide and detergent drive the differences in electrophoretic mobility without any interaction between peptides. These results emphasize the need to apply multiple independent techniques to the study of membrane protein folding, and they highlight the usefulness of studying folding and structure of membrane proteins in lipid membranes rather than in detergents.
Introduction
Approximately one quarter of eukaryotic genes encode for membrane proteins. Yet our knowledge of the folding and the interactions of membrane proteins has been slow to emerge [1–4] because of the scarcity of biophysical tools to study the fundamental principles of folding and structure. Even the lateral dimerization of hydrophobic transmembrane (TM) helices, one of the simplest biological interactions in cellular membranes, has been difficult to study due to the scarcity of techniques. As an example spanning the last two decades, studies of the dimerizing TM domain of the erythrocyte protein glycophorin A (GpA) have highlighted the few available methods [5–9] as well as their limitations. One of the first techniques applied to GpA dimerization was SDS-polyacrylamide gel electrophoresis which showed that native GpA migrates predominantly as a dimer in the detergent SDS while sequences with certain destabilizing mutations migrate as monomers [5]. Because of its simplicity and ability to report directly and rapidly on the oligomeric state of a peptide in a “membrane mimetic” environment, SDS-PAGE is still often used for assessment of dimerization propensities of transmembrane helices.
In some SDS-PAGE experiments, such as those performed with GpA or with the single TM helices of some receptor tyrosine kinases, two bands are observed [5;6], [10;11] allowing for the unequivocal conclusion that lateral interactions are taking place which give rise to different oligomer species. In other experiments, only a single band is observed, making identification of the species present much more ambiguous because of the possibility of anomalous migration [12;13]. In this latter case, the peptide is either completely monomeric or completely oligomeric and the monomer/oligomer state is assessed, at least initially, from the mobility of the band relative to a set of molecular weight standards, an interpretation that is complicated by the fact that significant deviations in mobility can arise from factors other than oligomerization [14].
However, there are questions about the reliability and universality of SDS-PAGE for studying TM helix dimerization that arise, in part, from the fact that SDS is a very destabilizing detergent that is known to unfold most proteins, including membrane proteins. Thus it is surprising that strong non covalent interactions between helices can occur in SDS. On the other hand, the SDS concentration in the PAGE gel itself may be low, and protein concentrations can be very high, at least transiently. These factors will promote interactions between helices. The assumption that SDS-PAGE experiments always accurately report monomer/oligomer equilibria for transmembrane-like peptides has not often been scrutinized. Instead, other techniques are used such as Forster Resonance Energy Transfer (FRET) in detergents [15] and in bilayers [16], analytical ultracentrifugation in detergents [8;17;18] and two-hybrid assays in biological membranes [7;19;20]. Given how widely SDS-PAGE is used in this field, more investigations into the universality of the utility/capability of SDS-PAGE for assessing oligomeric states of hydrophobic helices are overdue. Specifically, studies of the effect of polar residues on electrophoretic mobility is very important, since polar residues mediate hydrogen bonds that are known to play a role in stabilizing helical dimers in hydrophobic environments [21], and because there are diseases that are known to occur due to single amino acid substitutions to polar residues [22;23]. Although it is acknowledged that polar residues can cause anomalous migration [14], stringent tests are not always performed to distinguish between true oligimerization and anomalous migration in SDS-PAGE experiments.
One example of a peptide that migrates on SDS-PAGE as a single band at an apparent oligomer molecular weight is the MS1 peptide described by Choma et al [13]. MS1 has an asparagine in the 12th position of a 20 residue hydrophobic segment, while a control peptide has the hydrophobic amino acid leucine in the same position. In SDS gels, the leucine-containing control peptide runs as a single band at its correct monomeric molecular weight, while the MS1 sequence, with Asn, migrates as a single band at two to three times its molecular weight, consistent with dimeric or trimeric peptide. DeGrado and colleagues have shown very clearly that MS1 is oligomeric in some detergents by FRET and by analytical ultracentrifugation [13;17;18;24;25]. However the association propensity is weak; oligomers form in certain mild detergents (C14 sulfobetaine (also known as Zwittergent 3–14 or Anzergent 3–14), dodecylphosphocholine (also known as DPC or FOScholine12) and in C12E8 only at relatively high peptide to detergent ratios in the range of 1 peptide per 100 detergent molecules.
Since its oligomerization propensity is weak and because SDS is a strong denaturing detergent, it is surprising that MS1 is apparently always 100% oligomeric in SDS-PAGE experiments. We thus investigated if the slow migrating “oligomer” of MS1 in SDS-PAGE is indeed an oligomer. We performed experiments using FRET in gel loading buffer, containing concentrated SDS, as well as in gel running buffer, with low SDS and observed no evidence of oligomerization. Furthermore, we developed the methodology for making in situ FRET measurements in the unperturbed gel. Even in the PAGE gel we found no evidence of oligomerization of MS1 peptides under any conditions. Thus the peptide is apparently monomeric in SDS-PAGE gels despite migrating at an apparent molecular weight that is too large by a factor of two or three. Lastly we show that differences in peptide-micelle interactions are probably responsible for the anomalous migration. While SDS-PAGE can be a useful tool for studying lateral interactions between transmembrane helices, this study highlights the limitations of the method and suggests that PAGE results be interpreted with caution and only in the context of complimentary methods.
Materials and Methods
Peptide Synthesis
The peptides in Figure 1 were synthesized on TentaGel S-Ram amide resin using a Pioneer automated continuous flow peptide synthesizer made by Applied Biosystems as previously described [26]. Subsequent to the synthesis, the final FMOC protecting group was removed. Aliquots of 2–5 mg of resin, with sidechain-protected peptide were labeled overnight with a 10-fold excess of fluorescent dye-succinamidyl esters in synthesis grade DMF with 1% DIPEA. Efficient labeling of the amino group was assessed with a ninhydrin test [27] and the dye coupling was repeated if necessary. Cleavage of labeled or unlabelled peptides from the resin and cleavage of sidechain protecting groups was done with 90% triflouroacetic acid containing 5% ethanedithiol and 2.5% each thioanisole and anisole. Peptides were purified as described below. Mass spectrometry, done on a MALDI-TOF Voyager-DE (Applied Biosystems) showed the expected molecular weights for all peptides.
Figure 1.
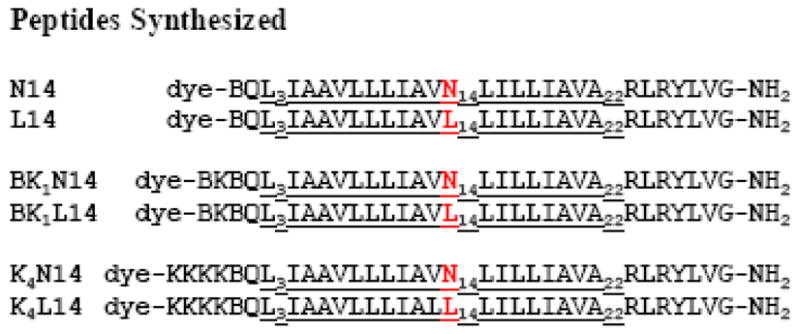
Sequences of the peptides synthesized for this work. The sequences are based on a peptide previously described [13] which was engineered to be a membrane-spanning homolog of the dimerization domain of the GCN4 transcription factor dimerization domain. These peptides contain a 20 residue segment of hydrophobic amino acids. The N14 variants have a polar asparagine residue at position 12 of the otherwise hydrophobic segment, while the L14 variants have a non polar leucine in the 12th position. In the K4 version of the peptides, four lysines were added at the amino terminal end of the peptide to improve solubility and ease of purification. B stands for beta alanine which has improved dye-labeling efficiency on the amino terminus. The dyes fluorescein (FL), TAMRA, CY3, CY5, Rhodamine-X (ROX), and bodipy-fluorescein (B-FL) were coupled to the amino termini of the peptides using succinamidyl ester modified dyes.
Experimental determination of fractional dye labeling is important for quantitative characterizing FRET efficiencies [16;28]. Furthermore, reverse phase HPLC purification of hydrophobic peptides such as these, generally does not separate full length labeled and unlabelled peptides. We measure dye-labeling efficiency by making samples in 2% SDS, measuring optical absorbance of the dye and measuring ellipticity of the same sample by circular dichroism. From the shape of the CD spectra (Figure 3), we concluded that the peptides were fully α-helical [29]. We can thus use CD to estimate the total peptide concentration in SDS using the expected helix value for molar ellipticity at 222 nm of –35,000 deg dmol−1 cm2. By comparing the concentration obtained from the dye absorbance with that estimated from ellipticity we determine dye labeling. For all the peptides the average labeling of about 0.8.
Figure 3.
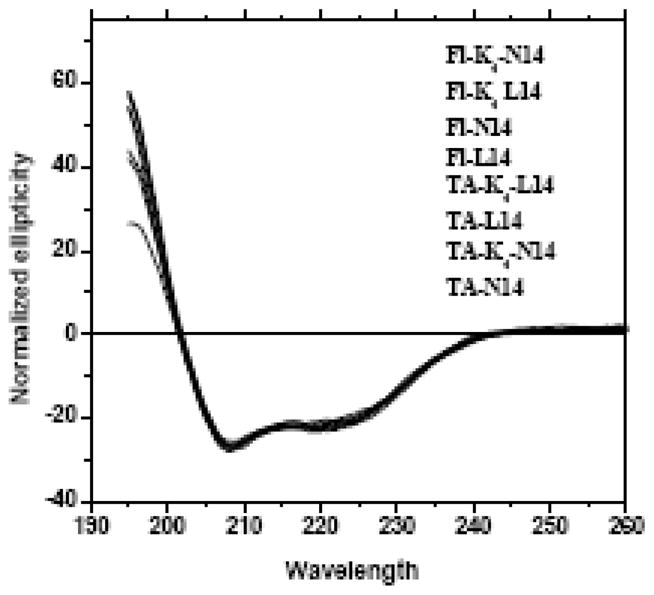
Circular dichroism spectra of N14 and L14 peptides in gel loading SDS solution containing 2% (70 mM) SDS. In this experiments detergent solutions of peptides at approximately 20 μM were prepared as described in the text. Spectra are shown for all versions of fluorescein- and TAMRA-labeled N14, L14, K4N14 and K4L14 peptides. The ellipticities were normalized to the same value at 222 nm. All spectra are essentially identical. The shape and ellipticity values are consistent with fully α-helical secondary structure in detergent.
Peptide Purification
Peptides were purified from cleavage scavengers, unreacted dye, and incomplete sequences using a bulk ion exchange resin method. The cation exchange resin used for this “spin-down” purification was PolyCatA. Three buffers were prepared, for loading, washing and elution. The loading buffer contained 70% of 10 mM aqueous ammonium acetate (pH 6.0), 10% methanol and 20% isopropanol. The washing buffer contained 40% aqueous 10 mM ammonium acetate (pH 6.0), 10 % methanol and 50% isopropanol. The eluting buffer contained 55% distilled water and 45% glacial acetic acid. PolyCatA IEX Resin was prepared by repeated washing in loading buffer, which was done by orbital mixing (10 minutes), centrifugation of the resin and decantation of the buffer. For purification, crude peptide, dissolved in hexafluoroisopropanol (10–50 mg/ml) was added to prepared resin (100 mg resin per mg peptide). About 4 ml of loading buffer was added to the resin-peptide-HFIP slurry. Depending on the ratio of HFIP to buffer, a phase separation sometimes occurred, which was reversed by adding methanol (up to 1 ml). Next the volume of loading buffer was brought to 7 ml total. The sample was mixed orbitally for 20 minutes to allow the polycationic peptides to bind to the resin. The resin was then centrifuged and the buffer decanted. Resin with bound peptide was washed at least three times with loading buffer and then at least 4 times with washing buffer. Final elution of the purified peptide from the resin was done with eluting buffer. For these hydrophobic peptides, elution was more efficient using a 2:1 mixture of eluting buffer and HFIP. Elution was done three times with 4 ml of 2:1 buffer:HFIP. All elution samples were pooled, dried by rotary evaporation and then lyophilized into small vials from glacial acetic acid.
Reverse phase HPLC purification was done using a C2 RP column from Machery-Nagel. Peptides were dissolved in 2:1 HFIP:water and injected onto the C2 column equilibrated with 30% acetonitrile (0.1% TFA) and 70% Water (0.1% TFA). A linear gradient from 30–100% acetonitrile was run and the peptides eluted at about 85% acetonitrile as sharp, resolved peaks. Characterization of purified peptides was done using mass spectrometry. Crude and purified unlabelled N14/L14 peptides gave single mass peaks either at 3089 ± 2 Da. Dye labeled peptides showed expected masses sometimes with a trace of unlabelled peptide. After purification, no free dye was observed in SDS gels (Figure 2B).
Figure 2.
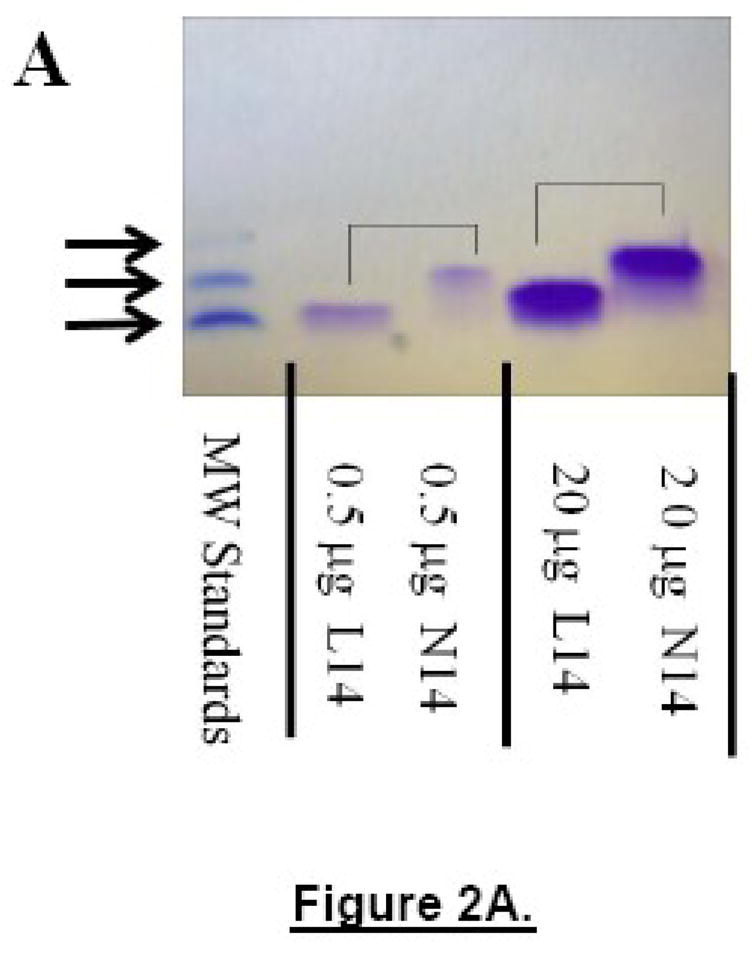
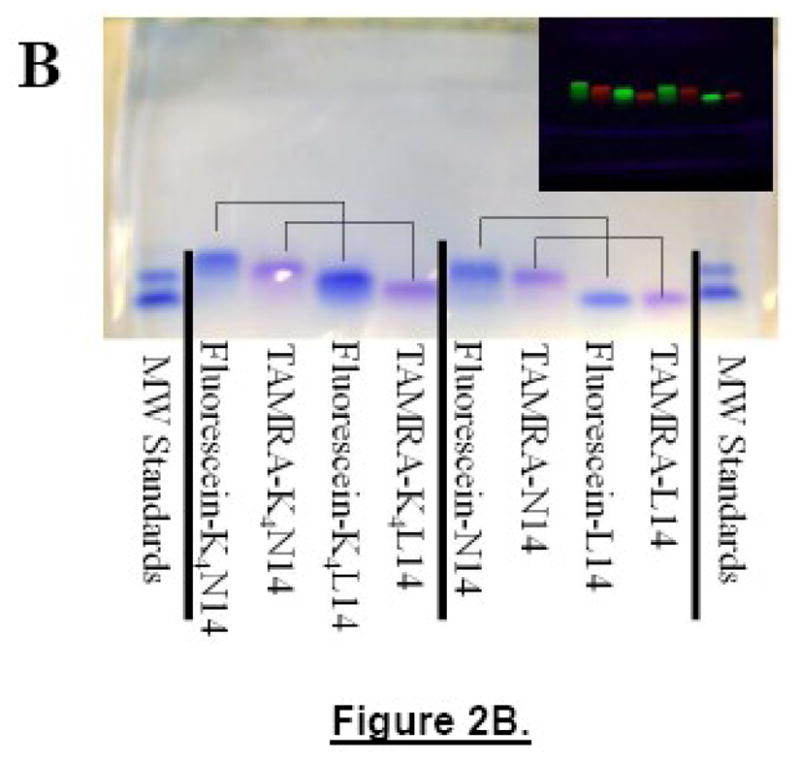
Panel A: Concentration effect on electrophoretic mobility. Pairs of unlabelled peptides of either L14 or N14 containing 0.5 μg (lanes 2 and 3) or 20 μg of peptide (lanes 4 and 5, respectively) run in a 16.5% Tris Tricine SDS gel at 80V for 120 min, along with a molecular weight standard containing peptides of 3800, 7600 and 11,400 Da. No monomer band was observed in any N14 peptide sample which always migrated as if they were 100% dimeric. Panel B: Example of polyacrylamide gel electrophoresis. Samples of N14, L14, K4N14 and K4L14 (5 μg each) labeled either with fluorescein or TAMRA on their N-termini were loaded onto a 16.5% Tric/Tricine SDS polyacrylamide gel and electrophoresed for 120 minutes at 80V. Before staining with coomassie the gel was photographed under UV light where the fluorescein is green and the TAMRA is red (shown in the inset). The coomassie stained gel shows molecular weight standards of 3800, 7600 and 11,400 Da in the first and last lanes. The K4 segment decreases mobility and the fluorescein-labeled peptides migrate slower than TAMRA-peptides. Pairs of peptides that differ only in the residue at position 12 are connected with lines for comparison. In each case the L14 peptides migrate close to their true molecular weight of 3100–3400 Da while the N14 peptides migrate with markers that are twice the molecular weight of the peptide.
Detergent solubilization of TM helices
When working with very hydrophobic peptides, details of sample preparation can dramatically affect the behavior, stability and solubility of the peptides [30]. For the peptides used here sample preparation was designed to achieve peptide-detergent solutions in which the peptides are well-mixed, fully α-helical and stably soluble at room temperature for at least several days. Stock solutions of peptides were prepared by dissolving lyophilized peptide powder in hexafluoroisopropanol (HFIP). To prepare detergent-solubilized samples, aliquots of HFIP-peptides solutions (e.g. Donor and Acceptor labeled peptides) were mixed together in a single tube and dried under a nitrogen stream. Detergent solutions in 100 mM Tris, pH 8.5 were added immediately and complete dissolution of the dried peptide film occurred in less than 1 min. Peptide concentrations were assessed by absorbance of the N-terminal dye. Samples were monitored by fluorescence and also assessed for helicity by CD spectroscopy immediately after preparation, after boiling, and for as long as 72 hours after preparation. We observed no changes that would indicate slow equilibration.
SDS Polyacrylamide Gel Electrophoresis
For polyacrylamide gel electrophoresis experiments, we used either BioRad 16.5% Tris/Tricine SDS gels or BioRad 10–20% gradient Tris/Tricine SDS gels developed in BioRad standard running buffer containing 0.1% (3.5 mM) SDS, 100 mM Tris, pH 8.5. We also used NuPAGE® Novex 4–12% Bis-Tris Gel developed in NuPAGE® MES SDS Running Buffer (Invitrogen). All gels showed the same pattern and relative mobility of bands. Samples were prepared by adding aliquots of peptide in HFIP to a tube, drying off the HFIP with nitrogen and adding 30 μl of sample buffer containing 2% (70 mM) SDS, 100 mM Tris, pH 8.5. Biorad gels were run at 80V for 120 min, and Novex gels were run at 120 V for 30 min, until the sample buffer dye band was near the bottom of the gel. For molecular weight standards we used a partially disulfide crosslinked sample of a 3800 Da peptide from the protein colicin E3 [31] that contains two cysteines. In this sample there were monomer, dimer and trimer bands of 3800, 7600 and 11,400 Da, respectively. Reduced E3 peptide ran as monomer at 3800 Da. Gels with dye-labeled peptides were photographed in 20% ethanol under UV light before Coomassie staining.
Circular Dichroism Spectroscopy
Circular dichroism (SD) was performed in a JASCO 810 spectropolarimeter. Samples were prepared by drying aliquots of peptide from HFIP and adding detergent solutions. CD was done at room temperature in 1 mm rectangular quartz cuvettes using scan rates of 10 nm per second and a time constant of 16 seconds. Typically, CD spectra were collected immediately after sample preparation, again several hours later and once more several days later to assess sample stability. Temperature changes between 5 and 95°C had no effect of CD spectra. Most samples were stable and fully helical for several days or longer after preparation.
Forster Resonance Energy Transfer in detergent solution
Forster Resonance Energy Transfer measurements were performed using an SLM Aminco model 8100 fluorescence spectrophotometer, equipped with a 450 W Xenon arc lamp, triple holographic grating monochromater on excitation and a double holographic grating monochromater on emission. Slits were set to 4 nm. Because the excitation monochrometer naturally imparts a strong vertical polarization, a Glann-Thomson polarizer on emission was set to the magic angle to reduce any polarization, dynamics or light scattering artifacts. Measurements were made in 4×10 mm quartz cuvettes, with the short axis perpendicular to the excitation path to reduce possible inner filter effects. In all cases, optical absorbance of solutions at excitation and emission wavelengths and pathlengths were below 0.1 absorbance units so that inner filter effects were not significant. Where necessary, cuvettes with excitation pathlengths as low as 1 mm were used. Cuvettes were maintained at 25 °C for all measurements.
To prepare samples for FRET, peptides, dissolved in HFIP, were mixed together first and the HFIP was dried off followed by addition of detergent solution to assure proper mixing of peptides. Whenever possible, CD spectroscopy was done on the samples to assure fully helical secondary structure, which was almost always observed. In a typical FRET experiment three samples were prepared in parallel and were examined sequentially; donor fluorophore only, acceptor only and donor + acceptor. In the latter sample, donor and acceptor concentrations were additive, such that in the absence of FRET the fluorescence of the donor + acceptor sample should be equal to the sum of the fluorescence of the donor only and acceptor only samples. Each of the three samples was subjected to two different measurements. First, all samples were excited at the donor excitation wavelength and the emission intensity was scanned across the region of donor emission continuing through the region of acceptor emission. Next, to confirm the solubility and verify the concentration of acceptor dye-labeled molecules in each sample was excited at the acceptor excitation wavelength and scanned across the acceptor emission peak.
FRET was assessed by examining the loss of donor fluorescence and excess fluorescence at the acceptor emission wavelength of the donor + acceptor sample compared to the donor only and acceptor only sample. This excess fluorescence, if any, was compared to the “direct excitation” or the acceptor fluorescence that was observed when the acceptor only sample was excited at the donor wavelength. At 1:10 Donor:Acceptor ratios, this direct excitation peak was significant.
In situ Forster Resonance Energy Transfer in Polyacrylamide Gels
In situ fluorescence spectroscopy was done on intact bands excised from polyacrylamide gels. Samples were prepared by electrophoresing co-dissolved mixtures of fluorescein-N14 and TAMRA-N14, mixtures of fluorescein L14 and TAMRA L14, and samples of TAMRA-peptides only on 16.5% Tris/Tricine/SDS polyacrylamide gels. After running the gels at 80V for two hours the peptides had moved to near the bottom of the gel, with the L14 mixtures running as monomers and the N14 mixtures running as apparent dimers. The peptide bands were then cut from the gel with a razor blade and transferred to a 1×0.4 cm quartz cuvette filled with 1x gel running buffer for immediate spectroscopy. The gel is transparent to visible light the orientation of the slab was not critical for the measurement. We used perpendicular emission and excitation polarizers and double grating monochrometers to reduce the effect of scattered light. Measurements were done by exciting the samples at the donor excitation and scanning emission across donor and acceptor emission wavelengths. Control samples showed that absolute intensity was variable and depended on the exact slab shape, orientation and position in the sample holder. Spectral shape, however, was always consistent.
Dynamic Light Scattering
Aliquots of peptides in HFIP were transferred into a small glass vial and were dried with nitrogen. To each vial, 20 mM SDS in 100 mM Tris buffer (pH 8.3) was added and the sample was gently agitated to dissolve peptides. Solutions of 100, 200, 300 and 400 μM nominal peptide concentration were prepared in this way. Actual peptide concentration were measured by diluting the samples to 50 μM and using circular dichroism to measure ellipticity at 222 nm. All peptides were fully helical and actual concentrations were similar to nominal concentrations. Once prepared, samples were equilibrated for at least one day at room temperature prior to DLS measurements. Dynamic light scattering experiments were performed on Malvern Zetasizer (Malvern, UK) using a 633nm laser. All samples were filtered through PVDF 0.1um membrane before measurements to remove particulates. Samples were measured in 40 μl disposable polystyrene cuvettes. Each experiment was repeated independently two times.
RESULTS
Peptides Studied
There is a disagreement between the weak oligomerization of the MS1 peptide in mild detergents [17;24] and its apparently very strong oligomerization under the denaturing conditions of SDS-PAGE [13]. We thus synthesized the peptides shown in Figure 1 and labeled them with dye molecules to study the nature of peptide-peptide interactions in SDS solution and in SDS gels using Forster Resonance Energy Transfer (FRET). MS1 was originally engineered from the GCN4 transcription factor coiled-coil dimerization domain to be a Membrane Spanning α-helix with a 20 residue hydrophobic segment containing a leucine zipper-like dimerization motif and a native asparagine residue at the 12th position in the 20 residue segment, or 14th position overall. A control peptide with leucine at the 14th position is monomeric [13]. As shown in Figure 1, we use a naming scheme for all three sets of peptides that is based on the original MS1 sequence in which the 14th residue overall is either asparagine (N14) or leucine (L14). The three sets of peptides all contain the MS1 sequence, and two of them have additional basic residues added to the N-terminus to promote ease of handling and purification. As shown below, the three sets of Asn/Leu peptide pairs behave similarly in all experiments.
Polyacrylamide Gel Electrophoresis
Peptide mobility on polyacrylamide gel electrophoresis is frequently used to determine oligomer states of TM helical peptides [6;10;21;32;33]. We assayed N14 and L14 peptides for their apparent molecular weights using several types of peptide gels; 10–20% gradient Tris/Tricine SDS gels (BioRad) and 16.5% Tris/Tricine SDS gels (BioRad) developed in BioRad SDS running buffer, and NuPAGE® Novex 4–12% Bis-Tris Gel developed in NuPAGE® MES SDS Running Buffer (Invitrogen). For precise molecular weight standards in the appropriate range we performed a partial crosslinking of a peptide fragment of the colicin E3 protein binding domain [31], which is 3800 Da, to produce bands of 3800, 7600 and 11,400 Da. These markers migrated at their appropriate molecular weights when compared to commercially available marker sets. Unlabelled L14 migrates at its molecular weight of about 3100 Da. The addition of fluorescent dyes, or the addition of the K4 segment to the L14 sequence shown in Figure 1 reduced mobility of the TM peptides on the gel slightly, as expected from the increased molecular weight. Most importantly, replacement of the 14th position leucine by asparagine, which changes molecular weight by a single mass unit, decreased peptide mobility substantially. In Figure 2A we show a coomassie-stained gel in which pairs of lanes have a 40 fold difference in the amount of N14 or L14 peptide. The left two sample lanes contain 0.5 μg (5 μM in the well) of either L14 or N14 peptide, while the right two sample lanes contain 20 μg (200 μM in the well) of either N14 or L14 peptides. Bands containing 20 μg of peptide ran slightly slower. However in both cases, the N14 peptide runs at an apparent MW that was about twice the apparent MW of L14. In Figure 2B we show a gel with various N14 and L14 peptide pairs. We found an apparent MW ratio ranging from 1.8–2.4 (N14/L14) in roughly 25 side-by-side comparisons such as the one shown in Figures 2A and B. The median apparent MW ratio was 2.0. Unlike other published examples of TM helix dimerization [32], no evidence of a concentration effect and no evidence of monomer-oligomer coexistence was observed in any gel electrophoresis experiment we performed. N14 peptides appeared to be 100% dimeric under all conditions, suggesting a very strong interaction.
Anatomy of an SDS-PAGE experiment
A peptide in an SDS-PAGE experiment experiences a range of possible environments during the course of the electrophoresis. With respect to SDS concentrations samples are initially dissolved in a “loading” buffer with at least 2% (70 mM) SDS. The gels themselves are made in a “casting” buffer which typically contains 0.2% (7 mM) SDS while the “running” buffer that bathes the gel and conducts current contains 0.1 % (3.5 mM) SDS.
Peptide-detergent complexes form in the loading buffer. For the gel in Figure 2B, about 30 μl of sample containing about 600 μg (70 mM) of detergent and 5 μg (50 μM) peptide in buffer was loaded into a well and an electric field was applied, causing the detergent and peptide to move into the top layer, or “stacking” layer of the gel. The stacking layer is a low crosslink density polyacrylamide gel matrix which allows for less restricted migration of charged molecules. Peptide and detergent are compacted into a very thin band at the intersection of the stacking gel and the more highly crosslinked separating gel matrix. We estimate this compacted band to be as much as 20 fold more concentrated than the original sample which means that the detergent concentrations are on the order of 1 molar and the peptide concentrations are on the order of 1 millimolar as the sample enters the separating gel.
During the separation phase, the smaller peptide-free micelles will presumably electrophorese into the gel faster than the larger peptide/detergent complexes, creating an environment in the gel with an intermediate detergent concentration. Strong peptide-detergent interactions in the sample will cause the peptide to co-migrate with detergent bound to it. Because we do not know the exact SDS concentration sampled by a peptide during the course of an SDS-PAGE experiment, in this work we explore the self association of the peptides in Figure 1 in buffers that encompass the possible SDS concentration range: in loading buffer with 2% (70 mM) SDS and in gel running buffer with 0.1 % (3.5 mM) SDS. We also measure interactions in the polyacrylamide gel itself.
Peptide Secondary Structure in SDS Solution
Hydrophobic peptides such as TM helices are frequently helical in SDS solutions, however this is not always the case. Some methods of sample preparation give peptides with some β-sheet character, which can lead to insolubility and unstable solutions. In part, this is because dried peptides are typically β-sheets and will remain so unless completely dissolved. We have found that dissolving the peptide in hexafluoroisopropanol (HFIP) or HFIP/water promotes helical structure and once dried from HFIP, the peptides remain helical and dissolve readily in detergent solutions [34]. In Figure 3 we show CD spectra for various N14 and L14 peptides in SDS solution, either 2% (70 mM) or 0.1 % (3.5 mM) dissolved using the methods described above. All variants, whether labeled or unlabelled, are apparently fully helical and have the same secondary structure. Throughout the course of the experiments described below we routinely used CD spectroscopy to verify helical secondary structure in detergent solutions.
FRET in SDS Gel Loading Buffer
In this work, we set out to characterize the association of N14 peptides in SDS using Forster resonance energy transfer (FRET). The peptides in Figure 1 were labeled on their amino-termini using succinimidyl esters of the dyes Fluorescein (FL) (λexc= 490 nm, λem=540 nm), TAMRA (λexc=540 nm, λem=580 nm), CY3 (λexc=550 nm, λem= 565 nm), CY5 (λexc=580, λem=675), bodipy fluorescein (BFL) (λexc=500 nm, λem= 515 nm) and Rhodamine-X (ROX) (λexc=580 nm, λem= 610 nm). These six dyes give five Acceptor-Donor pairs for FRET: Fluorescein-TAMRA, Fluorescein-CY3, CY3-CY5, BodipyFL-ROX and TAMRA-ROX. R0 values for these pairs are in the range 45-55 Å. Because the peptides are helical in SDS and there are either 14 or 18 residues (21 or 27 Å) between the amino terminus and the asparagine residue, parallel dimers will have dye moieties less than 25 Å apart while antiparallel dimers are expected to have dye moieties less than 40–50 Å apart. In either case, dimerization will give rise to FRET which should be easily measurable using these dye pairs.
In a typical FRET experiment, we prepared three parallel samples and collected six spectra. One sample had donor only (D), one had acceptor only (A) and one had donor and acceptor (D+A). Three FRET spectra were collected with excitation at the donor excitation wavelength and three were collected with excitation at the acceptor excitation wavelength. The latter spectra (not shown) were used to verify the concentration and solubility of acceptor peptides in each sample. Comparison of the emission intensity of the donor in the donor-only sample with the donor intensity in the donor + acceptor sample reports on acceptor dependent quenching that might occur even in the absence of classical FRET. The acceptor only sample allows for the measurement of acceptor emission that comes from “direct excitation”; the emission of the acceptor that occurs when it is excited directly at the donor excitation wavelength. Comparison of the acceptor emission intensity in the acceptor only sample with the donor + acceptor sample reports on classical FRET. In particular, any enhancement of acceptor emission over direct excitation is due to FRET. Thus, If classical FRET is occurring, the D + A sample will show a loss of donor fluorescence and a concomitant gain in acceptor fluorescence [28;35]. There are reports that suggest fluorescein and TAMRA do not always undergo classical FRET [36], but instead can show proximity by donor quenching without enhanced acceptor emission. Furthermore, comparison of donor intensity between N12 and L12 samples also reports on donor quenching in N12 samples. Thus, by comparing the spectra collected for N14 and L14 for each experiment we can detect dimerization whether it is causes only donor-quenching or classical FRET.
Examples of FRET spectra collected for 1:1 ratios of TA-N14+FL-N14 and for TA-L14+FL-L14 in gel loading buffer are shown in Figure 4. In the mixed sample, the fluorescein emission of the donor was very similar to the donor alone and the minor amount of emission of the acceptor TAMRA at 580 nm was accounted for by the small direct excitation peak. Furthermore the N14 donor emission intensity was very similar to the L14 donor emission intensity. In all samples, we conclude that the FRET efficiency for N14 peptides in SDS loading buffer was less than 5%. The lack of detectible FRET and the observation that L14 and N14 were identical shows that there was less than 5% dimerization of N14 in this experiment, which was performed under loading conditions of an SDS-PAGE gel 2% (7-0 mM) SDS. The three spectra collected while the acceptor was excited are not shown, but in all cases these measurements verified that the acceptor was present at the expected concentration in all samples.
Figure 4.
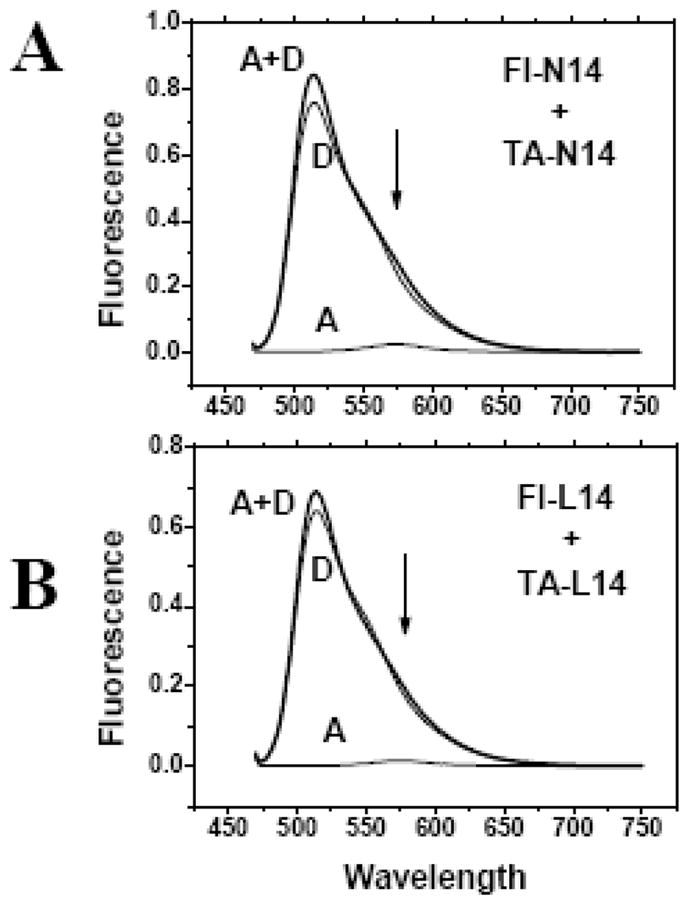
Fluorescence of peptide mixtures in gel loading SDS buffer containing 2% (70 SDS. Samples containing a 1:1 mixtures of Fluorescein and TAMRA labeled peptides were dried from HFIP stock solutions and dissolved at 1 μM each in 2% (70 mM) SDS in 100 mM Tris buffer, pH 8.4. For each peptide pair three samples were prepared and examined: Samples contained donor (fluorescein) only (D), donor and acceptor (TAMRA) (D+A) or acceptor only (A). The acceptor-only spectrum shows the contribution of direct excitation of the acceptor. Information about FRET is derived by comparing the D+A spectrum to the others. If there is no FRET, the D+A spectrum will equal the sum of the A and D spectra. FRET from dimerization will cause a loss of donor fluorescence and an equal increase of acceptor fluorescence. Panel A: Mixture of fluorescein and TAMRA-labeled N14 peptides. Panel B: Mixture of fluorescein and TAMRA-labeled L14 peptides. These are raw spectra collected under identical conditions with no corrections, normalization or scaling.
To verify the observation that FL-TAMRA labeled N14 peptides do not give FRET in 2% SDS, and to eliminate dye-specific effects as possible factors, we repeated FRET experiments in gel loading buffer with N14 peptides labeled with two other dye pairs: Bodipy Fluorescein(D) + Rhodamine-X (A) and TAMRA(D) + Rhodamine-X (A). The results, in figure 5 show no detectable FRET for these other dye pairs. In all cases the D+A sample spectrum was essentially the sum of the donor-only and acceptor-only spectra.
Figure 5.
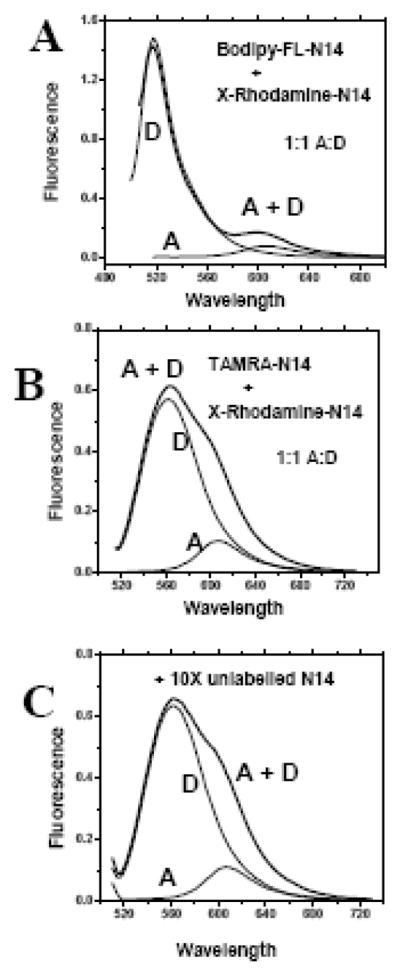
FRET experiments with other dye pairs in gel loading buffer containing 2% (70 mM) SDS. Panel A: Mixtures of N14 peptides labeled with TAMRA(D) + Rhodamine-X (A) dissolved in gel loading buffer. Panel B: Mixtures of N14 peptides labeled with or with bodipy-fluorescein(D) + Rhodamine-X (A) dissolved in gel loading buffer. For each peptide pair three samples were prepared and examined, donor only (D), donor and acceptor (D+A) and acceptor only (A). Donor-labeled peptides were present at 1 μM and acceptor-labeled peptides were present at either 1 or 10 μM. The acceptor-only spectrum shows the contribution of direct excitation of the acceptor. Information about FRET is derived by comparing the D+A spectrum to the others. If there is no FRET, the D+A spectrum will equal the sum of the A and D spectra. FRET from dimerization will cause a loss of donor fluorescence and an equal increase of acceptor fluorescence. Panel C: FRET experiment with TAMRA and Rhodamine-X labeled peptides at 1:1 A:D ratio in gel loading buffer measured with a 10 fold excess of unlabelled peptide. No changes in fluorescence were observed, indicating that these N14 peptides are monomeric in SDS solutions. These are raw spectra collected under identical conditions, for each set, with no corrections, normalization or scaling.
If the N14 peptides are oligomeric in SDS, addition of unlabelled peptide will compete for labeled peptide in the oligomers and decrease quenching or FRET [16;28;37]. In Figures 5C and 5D, we show that the addition of unlabelled peptide has no effect on fluorescence indication that the N14 peptides were monomeric. This conclusion is corroborated by the observation that the intensity of donor fluorescence in the donor-only N14 samples was always the same as the intensity of the donor-only L14 samples (Figure 4). Thus no significant donor-donor self-quenching is taking place. Given the propensity of fluorescein to self-quench [38;39] this observations supports our conclusion that N14 peptides are not dimerizing in SDS.
FRET in SDS at high peptide concentration
We hypothesized that the apparent dimerization of N14 peptides in gel electrophoresis experiments may be due to the relatively high peptide concentration in the gel (5–50 μM in the starting sample) compared to FRET experiments in solution where 1 μM peptide was typical. To test this hypothesis we conducted FRET experiments in gel loading buffer with 50 μM total peptide instead of 1 μM. The results are shown in Figure 6. To eliminate inner filter artifacts [40] due to the high optical density of the samples, we measured fluorescence in a glass capillary with a path length less than 0.5 mm. A significant amount of FRET was observed in this experiment; however the FRET was identical for N14 and L14 peptides, indicating that it was not due to a specific interaction between N14 peptides. Instead, the observed FRET is likely due to random proximity effects [28] as described below, which are expected to be significant at these peptide/detergent ratios (1:1000). We note here that peptide:detergent ratio in this experiment was lower than the range at which N14 peptides were shown to interact in other detergents by other techniques [13;17;18;24] but higher than the typical ratio in an SDS gel experiment. Importantly, this experiment also provides a positive control for the signature of FRET between fluorescein and TAMRA under our experimental conditions. For FRET pairs with large R0 values (R0 > 45 Å) FRET will occur due to random co-localization of the freely diffusing acceptor and donor moieties [28] when peptide to detergent ratio exceeds about 1:1000. We and others have developed algorithms to simulate or calculate FRET from random colocalization in two dimensional systems, which have been used successfully to correct FRET measurements in membranes [41]. If we consider an SDS solution to be a continuous (i.e. rapidly exchanging) two-dimensional system, then we can estimate FRET using these published methods. A peptide:SDS ratio of about 0.0008 (50 μM peptide 60 mM micellar SDS) leads to a predicted FRET of about 20% from random colocalization [28]. This is similar to what we observed. The fact that N14 and L14 peptides gave identical FRET shows that random colocalization was responsible for the observed FRET, rather than a sequence-specific interaction between N14 peptides.
Figure 6.
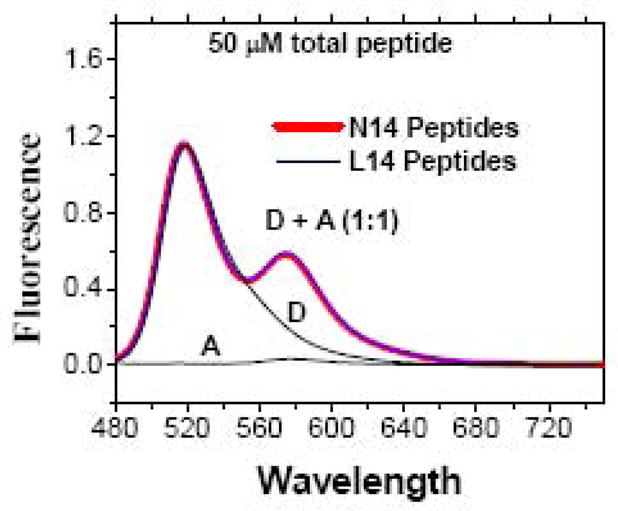
FRET experiments with high peptide concentration in gel loading buffer containing 2% (70 mM) SDS. FRET experiment with TAMRA and fluorescein-labeled peptides at 1:1 Acceptor:Donor and 50 μM total peptide concentration in gel loading buffer. Measurements were made with samples placed in a narrow capillary to eliminate inner filter absorption [40]. Because the capillary position in the beam was not always identical, absolute intensities were not directly comparable but could vary by as much as 50%. In this plot, donor-only and donor + acceptor curves were scaled to have equal intensities at 540 nm and the acceptor-only curve was scaled by the same amount because it was measured in the same sample. Direct excitation of acceptor was negligible. There was a significant amount of FRET at this high peptide concentration, but it is identical in L14 samples and in N14 samples, suggesting that it arises from random proximity rather than specific interactions, see text.
FRET in Gel Running Buffer
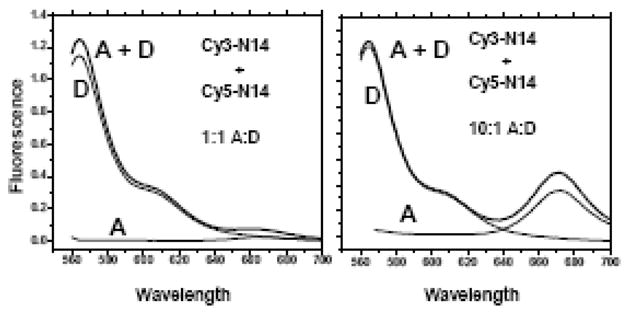
We hypothesized that the specific components of the gel running buffer (0.1%, (3.5 mM), SDS, 100 mM Tris, pH 8.5) were driving N14 peptide dimerization in the gels, but not in the loading buffer which has much higher SDS concentrations. This idea is consistent with the observation that these peptides associate measurably only at high peptide:detergent ratios in other detergents [17;24;25]. Therefore, we performed FRET experiments in Biorad gel running buffer using the Fluorescein-TAMRA donor-acceptor pair. By circular dichroism, we found that all peptides studied (Figure 1) were fully alpha-helical and stable for at least a day despite the fact that the SDS concentration in the running buffer (3.5 mM) is near the lower end of the reported CMC values for SDS. Presumably the peptides can bind enough SDS to be soluble and helical under these conditions. We performed these experiments using all three versions of N14 and L14 (Figure 1) labeled with fluorescein (donor) and TAMRA (acceptor). To increase the stringency of the experiment for detecting dimerization, these experiments were conducted at acceptor:donor ratios of 10:1. In this case, roughly 90% of the donors will have an acceptor as partner if dimerization occurred and was random. For these experiments the contribution of direct excitation of the acceptors was larger as shown in Figure 7. Although there were subtle differences in the shape and position of the peaks depending on the N-terminal sequence of the peptides, comparison of the equivalent N14 and L14 peptides showed no acceptor emission greater than the direct excitation and no quenching of donor fluorescence in any of the samples. Furthermore, the N14 and L14 peptides give almost identical intensities corroborating the conclusion that there is no donor quenching in N14 peptides and thus there is no dimerization.
Figure 7.
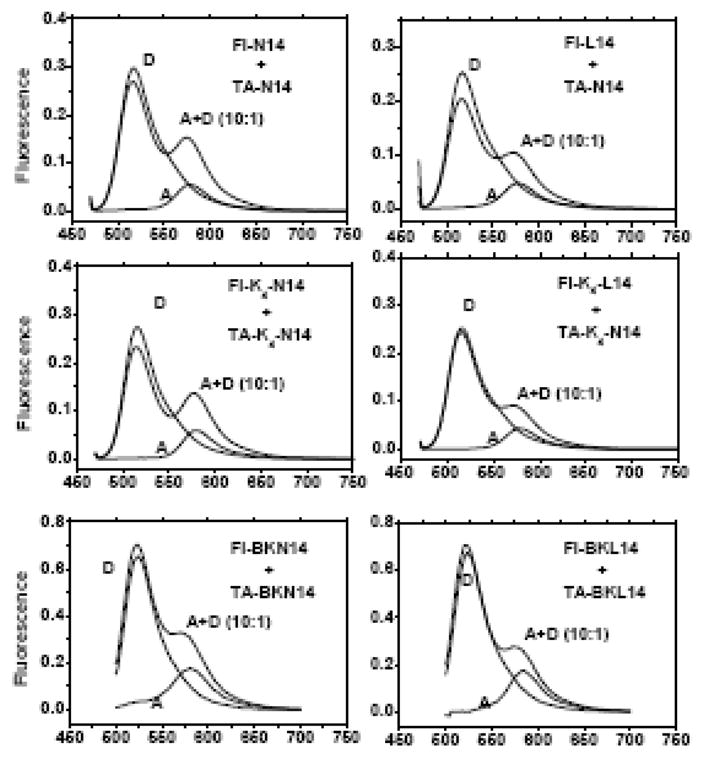
FRET experiments in SDS gel running buffer containing 0.1 % (3.5 mM) SDS. Pairs of fluorescein and TAMRA labeled peptides (Figure 1) were characterized at 1 μM donor and 10 μM acceptor peptide. We show spectra for donor only (D), acceptor only (A) and a mixture of the two (A+D). The acceptor-only spectrum shows the contribution of direct excitation of the acceptor. The direct excitation peak from the donor was larger than in Figure 4 because the D:A ratio was 1:10 in this experiment. Information about FRET is derived by comparing the D+A spectrum to the others. If there is no FRET, the D+A spectrum will equal the sum of the A and D spectra. FRET from dimerization will cause a loss of donor fluorescence and an equal increase of acceptor fluorescence. In these experiments, there was no evidence for any interaction in gel running buffer. These are raw spectra collected under identical conditions with no corrections, normalization or scaling.
Although peptides were always premixed before dissolution in SDS, we also considered the possibility that equilibration is slow to occur. This is consistent with the observation that other dimerizing peptide systems show monomer and dimer bands in the same gel [10;32]. To assess the equilibration rate, we measured FRET and ran PAGE gels before and after sample boiling, which should accelerate equilibration, but observed no changes in any of the experiments. We also monitored FRET in such samples for time periods ranging from minutes to days after sample preparation. No time-dependent changes were ever observed.
We show in Figure 8 that the lack of FRET or donor quenching did not depend on the particular dye pairs used. In addition to the fluorescein-TAMRA pair discussed above, we also made measurements in running buffer (3.5 mM), using CY3(D)+CY5(A) (Figure 8) and fluorescein(D) and CY3(A) (not shown). No evidence of dimerization was observed in gel running buffer with any other dye pair.
Figure 8.
FRET experiments in SDS running buffer containing 0.1 % (3.5 mM) SDS. These experiments were done with CY3(D) and CY5(A) labeled peptides. Measurements were made on mixtures of CY3 and CY5 labeled N14 peptides at 1:1 D:A ratio (Panel A) and 1:10 D:A (Panel B). At 1:10 D:A there was a larger direct excitation peak. Donor was present at 1 μM and Acceptor was either 1 or 10 μM. For this experiment, three samples were prepared and examined, donor only (D), acceptor only (A) and mixtures of the two (D+A). The A spectrum shows the contribution of direct excitation, while the D spectrum shows the donor fluorescence in the absence of acceptor. Information about FRET is derived by comparing the D+A spectrum to the others. If there is no FRET, the D+A spectrum will equal the sum of the A and D spectra. FRET from dimerization will cause a loss of donor fluorescence and an equal increase of acceptor fluorescence. In these experiments, there was no evidence for any interaction in gel running buffer. These are raw spectra collected under identical conditions, for each set, with no corrections, normalization or scaling.
In situ FRET in polyacrylamide
Based on the disagreement between the gel electrophoresis experiments, which indicated that N14 peptides were completely dimeric in SDS gels under all conditions, and the FRET experiments which failed to detect any dimerization in SDS in any experiment, we hypothesized that some unknown factor in the electrophoresis experiment itself was driving dimerization of asparagine-containing TM helices in the gels. To test this idea, we electrophoresed 1:1 mixtures of fluorescein- and TAMRA-labeled peptides on SDS gels and then performed FRET measurements in situ on the bands from the gel by cutting them out and immediately placing the intact gel slabs in a cuvette containing gel running buffer for spectroscopy. Peptides were not extracted from the gel, but rather were characterized immediately in situ using fluorescence spectroscopy on the intact band in the gel. In control experiments, we found that physical factors such as slab size and shape, angle to excitation beam and physical imperfections in the gel changed the fluorescence intensity from the sample, presumably through light scattering and sample illumination effects, but did not change the band shape, spectral characteristics, or the apparent amount of FRET. We tested the stability of the in situ band in the gel by cutting out control bands and soaking them in gel running buffer while monitoring the peptide remaining in the gel. Peptide diffusion out of the gel into the solution was negligible for at least several hours after the band was cut. Fluorescence measurements were always made within 15 minutes of cutting the band from the gel. Therefore, in this experiment we were measuring FRET between peptides exactly as they ran in the gel.
In a typical experiment, we loaded of peptide solutions of 5–50 μM in the well. We estimate that the final concentration of peptide in the band in the gel was similar to the starting concentration of peptide within a factor of two. Typical in situ FRET measurements are shown in Figure 9 for samples prepared with 10, 20 and 40 μM peptide. In the 10 μM experiment there was little or no FRET in excess in the N14 band over the direct excitation peak. The N14 and L14 spectra were very similar, indicating that no dimerization was taking place, even though the N14 band migrates at the molecular weight of a dimer. In the high concentration (40 μM) experiment some FRET observed for both L14 and N14 samples. This is shown by the TAMRA emission at 580 nm that was in excess of the direct excitation peak. However the amount of FRET was always similar for the mixtures of FL-L14 + TA-L14, which ran as monomers in the gel, and mixtures of FL-N14 and TA-N14 which ran as apparent dimers. FRET from random colocalization is expected to occur at these peptide concentrations (see above) and this accounts for the observed FRET. We note that N14 migrates at exactly the same dimer molecular weight at every peptide concentration studied, and shows essentially no in-situ FRET, except at the highest concentrations where proximity FRET takes place. Most importantly, in all cases, the amount of in situ FRET from N14 “dimer” bands was always similar to the amount of FRET from L14 “monomer” bands. Thus, we conclude that the N14 peptides in the gel, which always migrate dramatically slower than L14 and have apparent molecular weights about two times larger than L14, are actually monomeric.
Figure 9.
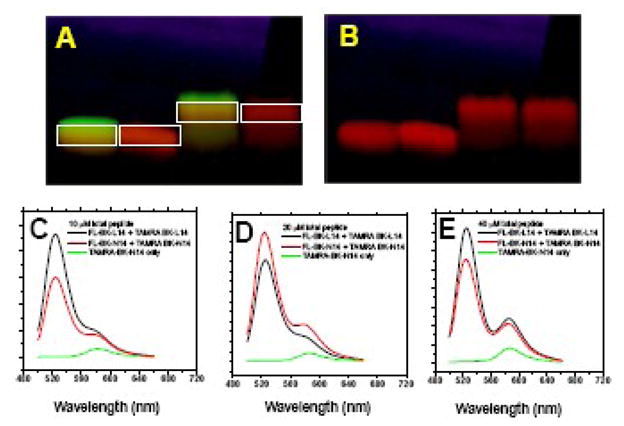
In situ FRET experiments in SDS-PAGE gels. Mixtures of 1:1 Fluorescein and TAMRA labeled N14 or L14 peptide were dissolved in gel loading buffer and electrophoresed into a Biorad 16.5% SDS/Tris/Tricine gel at 80 V for 120 minutes. Panels A and B show an example image of one gel used in this experiment. The gel in Panel A was photographed under UV light to show fluorescein and TAMRA in green and red, respectively. In Panel B the same gel was photographed with the green fluorescein signal filtered out to show the underlying TAMRA band only. The bands in the boxes were excised from the gel, placed in a cuvette containing gel running buffer and subjected to immediate fluorescence spectroscopy. Spectroscopy was performed on the bands in situ without extraction of the peptide from the gel. In this experiment we show the results of experiments with three concentrations of peptides: 10 μM (Panel C), 20 μM (Panel D) and 40 μM (Panel E). Spectra were collected for the TAMRA-only bands and the TAMRA+Fluorescein bands. Spectra were not normalized or scaled. At these high peptide concentrations, some FRET is expected due to random proximity (see text) which will be apparent in both L14 and N14 samples. FRET from dimerization will be evident only in the N14 samples, however there was little or no excess FRET in “dimeric” N14 bands compared to “monomeric” L14 samples. There is no evidence of dimerization of N14 peptides in the gel.
Bead-binding experiments
We also tested for interactions between N14 peptides using a high throughput screen we developed for helix-helix interactions. In this screen, which we have previously described [30], polystyrene/polyethylene glycol polymer beads with tethered peptide sequences are incubated with dye-labeled target peptides in detergent solution. Interaction between tethered and soluble sequences cause the dye labeled peptide in solution to accumulate on the bead, which is visible by its fluorescence. We have previously shown that this is a sensitive assay for helix-helix interactions [30], however no interaction was detected between dye-labeled N14 peptides in detergent solution and N14 sequences on beads. Experiments were performed in various SDS concentrations including loading and running buffers. We never observed evidence that any dye-labeled N14 peptide in detergent solution interacted specifically with any bead-tethered N14 peptide.
Interactions between peptides and SDS micelles
Finally, we hypothesized that the apparent changes in N14 molecular weight in SDS gels, compared to L14, were due to differences in how the peptides interact with the detergent rather than how the peptides interact with each other. To test this idea we performed a dynamic light scattering experiment on mixtures of 20 mM SDS and L14 and N14 peptide concentrations up to 400 μM peptide. About half of the 20 mM SDS will be micellar. Given that the aggregate number of SDS is ~100, this experiment encompasses nominal peptide:micelle ratios ranging up to about 4:1. In the absence of peptide, the SDS solution contained particles that were roughly 3.5 nm in diameter, consistent with the expected radius of SDS micelle (Figure 10). As peptide concentrations were increased, the average particle size increased. When there was about 1 peptide per micelle the particle size was twice as large for both peptides. Above this concentration range, the particles size in increases dramatically, with a 50-fold increase observed for L14/SDS between 1 peptide per micelle and 4 peptides per micelle. The individual micelles were probably not becoming 50 fold larger, but instead were probably aggregated together into super aggregates, perhaps bridged together by the hydrophobic L14 peptide. In the presence of N14 peptides the increase in micelle size was much less dramatic. At 4 peptides per micelle the N14/SDS particles were only 1/20th as large as the L14/SDS particles. Although we do not know exactly how the peptides affect the SDS micelles, why the particles sizes were so different, or why this difference affects PAGE migration the way it does, this experiment clearly demonstrates that there is a significant difference between the interactions of N14 with SDS compared to the interaction of L14 with SDS.
Figure 10.
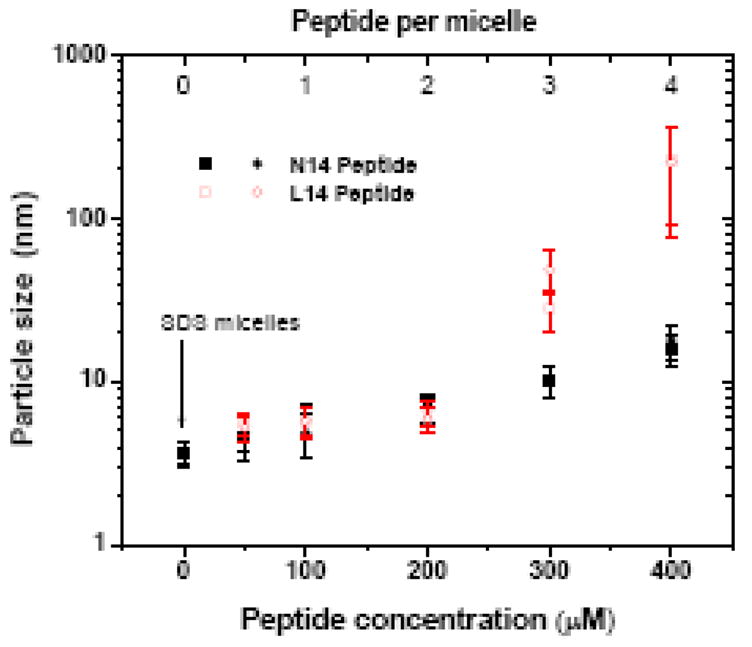
Dynamic light scattering measurements of SDS/peptide solutions. A solution of 20 mM SDS in Tris buffer, pH 8.4 was mixed with an identical solution also containing 400 μM N14 or L 12 peptide to create solutions with increasing peptide/detergent ratios. The resulting solution was equilibrated, centrifuged to remove particulates, and subjected to dynamic light scattering measurements. Assuming roughly 10 mM micellar SDS and 100 detergents per micelle, we estimate the peptide/micelle ratio at the top. The results of two independent experiments are shown for each peptide.
DISCUSSION
SDS-PAGE is a widely used technique to assess the propensity for oligomerization of TM helices [14;32;42;43]. The results we have shown here explore and address the limitations of the technique.
In SDS-PAGE gels, N14 peptides (Figure 1) migrate with an apparent molecular weight that is twice their true molecular weight while L14 peptides migrate at their true molecular weight. Given this observation, it would be reasonable to assume that the polar asparagine in N14 is driving dimerization in the gels while the hydrophobic L14 peptide is monomeric. In this particular case, we demonstrate that this assumption is not correct. The peptide N14, which dimerizes in mild detergent solution at high peptide:lipid ratios [17;24], is actually monomeric in SDS solution and in SDS gels. Thus, the polar asparagine residue drives anomalous migration in the SDS gel without driving dimerization. We give evidence here that differences in peptide-micelle interactions are responsible for the anomalous migration.
While SDS-PAGE remains a useful technique for studying oligomerization of TM helices, and does accurately report on oligomerization propensity in many cases [5;10;32], the current results suggest that dimerization/oligomerization in the gel should be interpreted with caution, and should be confirmed with independent methods such as in in situ gel FRET, FRET in detergents [15] and membranes [11;12;44], crosslinking [45], analytical centrifugation [8] or biological dimerization assays [20;46]. Such independent confirmations reduce ambiguity in the study of folding and interactions of membrane proteins.
Effect of Polar Residues in TM helices on dimerization and SDS-PAGE
A natural transmembrane helix exists in one of the most hydrophobic environments found in biology; the core of the lipid bilayer membrane. Not surprisingly, naturally occurring polar residues are rare in this environment. However they can be found, and there has been recent debate regarding the exact energetic cost and fate of polar residues in this environment [47;48]. When polar residues are present they can affect interactions between membrane proteins and between proteins and lipids in profound ways. For example, polar residues in TM helices have been shown to stabilize dimers in hydrophobic environments [21;49] but they can also affect topology of helices in bilayers without affecting dimerization [50]. In humans, naturally occurring polar residues in TM helices are essential for function and folding of many membrane proteins [51], while mutations of hydrophobic to polar residues cause disease [22]. For these reasons, the physical mechanisms underlying the lateral interactions between TM helices containing polar residues have long been of interest to biophysicists. Here we show one example in which a polar residue in a TM helix affects the migration of the TM helix in SDS-PAGE gels in an unexpected way. The asparagine residue affects the interactions between peptides and micelles and causes anomalous gel migration without causing dimerization. This example shows why special care is warranted in the study of the effects of polar residues on TM peptide-peptide interactions using SDS-PAGE experiments.
Conclusion
Here we offer a cautionary tale about studying the folding and assembly of membrane proteins using peptides and SDS-PAGE experiments as membrane mimetic systems. At least for the specific peptide and detergent systems we have studied here, a polar residue in a “transmembrane” helix can induce differential interactions between peptide and detergent and change its electrophoretic mobility without driving interaction between peptides. Importantly, the observed effect mimics the changes in electrophoretic mobility that one would expect to occur for laterally interacting sequences containing polar residues. These results emphasize the need to apply multiple independent techniques to the study of membrane protein folding, and they highlight the usefulness of studying folding and structure of membrane proteins in lipid membranes rather than in detergents.
Acknowledgments
Supported by NIH grant GM60000 (WCW) and NIH grant GM068619 (KH). We thank the New Orleans Protein Folding Intergroup for many enlightening discussions.
Footnotes
Publisher's Disclaimer: This is a PDF file of an unedited manuscript that has been accepted for publication. As a service to our customers we are providing this early version of the manuscript. The manuscript will undergo copyediting, typesetting, and review of the resulting proof before it is published in its final citable form. Please note that during the production process errors may be discovered which could affect the content, and all legal disclaimers that apply to the journal pertain.
Reference List
- 1.White SH, Wimley WC. Membrane protein folding and stability: Physical principles. Annu Rev Biophys Biomol Struc. 1999;28:319–365. doi: 10.1146/annurev.biophys.28.1.319. [DOI] [PubMed] [Google Scholar]
- 2.Popot JL, Engelman DM. Helical membrane protein folding, stability, and evolution. Annu Rev Biochem. 2000;69:881–922. doi: 10.1146/annurev.biochem.69.1.881. [DOI] [PubMed] [Google Scholar]
- 3.Engelman DM, Chen Y, Chin CN, Curran AR, Dixon AM, Dupuy AD, Lee AS, Lehnert U, Matthews EE, Reshetnyak YK, Senes A, Popot JL. Membrane protein folding: beyond the two stage model. FEBS Lett. 2003;555:122–125. doi: 10.1016/s0014-5793(03)01106-2. [DOI] [PubMed] [Google Scholar]
- 4.White SH, Ladokhin AS, Jayasinghe S, Hristova K. How membranes shape protein structure. J Biol Chem. 2001;276:32395–32398. doi: 10.1074/jbc.R100008200. [DOI] [PubMed] [Google Scholar]
- 5.Lemmon MA, Flanagan JM, Hunt JF, Adair BD, Bormann BJ, Dempsey CE, Engelman DM. Glycophorin-A dimerization is driven by specific interactions between transmembrane α-helices. J Biol Chem. 1992;267:7683–7689. [PubMed] [Google Scholar]
- 6.Lemmon MA, Flanagan JM, Treutlein HR, Zhang J, Engelman DM. Sequence specificity in the dimerization of transmembrane alpha- helices. Biochemistry. 1992;31:12719–12725. doi: 10.1021/bi00166a002. [DOI] [PubMed] [Google Scholar]
- 7.Russ WP, Engelman DM. TOXCAT: A measure of transmembrane helix association in a biological membrane. Proc Natl Acad Sci USA. 1999;96:863–868. doi: 10.1073/pnas.96.3.863. [DOI] [PMC free article] [PubMed] [Google Scholar]
- 8.Fleming KG, Ackerman AL, Engelman DM. The effect of point mutations on the free energy of transmembrane α-helix dimerization. J Mol Biol. 1997;272:266–275. doi: 10.1006/jmbi.1997.1236. [DOI] [PubMed] [Google Scholar]
- 9.Finger C, Volkmer T, Prodohl A, Otzen DE, Engelman DM, Schneider D. The stability of transmembrane helix interactions measured in a biological membrane. J Mol Biol. 2006;358:1221–1228. doi: 10.1016/j.jmb.2006.02.065. [DOI] [PubMed] [Google Scholar]
- 10.Li E, You M, Hristova K. FGFR3 dimer stabilization due to a single amino acid pathogenic mutation. J Mol Biol. 2006;356:600–612. doi: 10.1016/j.jmb.2005.11.077. [DOI] [PMC free article] [PubMed] [Google Scholar]
- 11.Merzlyakov M, Chen L, Hristova K. Studies of receptor tyrosine kinase transmembrane domain interactions: The EmEx-FRET method. J Membr Biol. 2007;215:93–103. doi: 10.1007/s00232-007-9009-0. [DOI] [PMC free article] [PubMed] [Google Scholar]
- 12.Artemenko EO, Egorova NS, Arseniev AS, Feofanov AV. Transmembrane domain of EphA1 receptor forms dimers in membrane-like environment. Biochim Biophys Acta. 2008;1778:2361–2367. doi: 10.1016/j.bbamem.2008.06.003. [DOI] [PubMed] [Google Scholar]
- 13.Choma C, Gratkowski H, Lear JD, DeGrado WF. Asparagine-mediated self-association of a model transmembrane helix. Nature Struct Biol. 2000;7:161–166. doi: 10.1038/72440. [DOI] [PubMed] [Google Scholar]
- 14.Therien AG, Grant FEM, Deber CM. Interhelical hydrogen bonds in the CFTR membrane domain. Nature Struct Biol. 2001;8:597–601. doi: 10.1038/89631. [DOI] [PubMed] [Google Scholar]
- 15.Fisher LE, Engelman DM, Sturgis JN. Detergents modulate dimerization, but not helicity, of the glycophorin A transmembrane domain. J Mol Biol. 1999;293:639–651. doi: 10.1006/jmbi.1999.3126. [DOI] [PubMed] [Google Scholar]
- 16.Li E, You M, Hristova K. SDS-PAGE and FRET suggest weak interactions between FGFR3 TM domains in the absence of extracellular domains and ligands. Biochemistry. 2005;44:352–360. doi: 10.1021/bi048480k. [DOI] [PubMed] [Google Scholar]
- 17.Lear JD, Gratkowski H, Adamian L, Liang J, DeGrado WF. Position-dependence of stabilizing polar interactions of asparagine in transmembrane helical bundles. Biochemistry. 2003;42:6400–6407. doi: 10.1021/bi020573j. [DOI] [PubMed] [Google Scholar]
- 18.Gratkowski H, Dai QH, Wand AJ, DeGrado WF, Lear JD. Cooperativity and specificity of association of a designed transmembrane peptide. Biophys J. 2002;83:1613–1619. doi: 10.1016/S0006-3495(02)73930-1. [DOI] [PMC free article] [PubMed] [Google Scholar]
- 19.Schneider D, Engelman DM. GALLEX, a measurement of heterologous association of transmembrane helices in a biological membrane. J Biol Chem. 2003;278:3105–3111. doi: 10.1074/jbc.M206287200. [DOI] [PubMed] [Google Scholar]
- 20.Langosch D, Brosig B, Kolmar H, Fritz HJ. Dimerisation of the glycophorin a transmembrane segment in membranes probed with the ToxR transcription activator. J Mol Biol. 1996;263:525–530. doi: 10.1006/jmbi.1996.0595. [DOI] [PubMed] [Google Scholar]
- 21.Zhou FX, Cocco MJ, Russ WP, Brunger AT, Engelman DM. Interhelical hydrogen bonding drives strong interactions in membrane proteins. Nature Struct Biol. 2000;7:154–160. doi: 10.1038/72430. [DOI] [PubMed] [Google Scholar]
- 22.Li E, Hristova K. Role of receptor tyrosine kinase transmembrane domains in cell signaling and human pathologies. Biochemistry. 2006;45:6241–6251. doi: 10.1021/bi060609y. [DOI] [PMC free article] [PubMed] [Google Scholar]
- 23.Partridge AW, Melnyk RA, Deber CM. Polar residues in membrane domains of proteins: Molecular basis for helix–helix association in a mutant CFTR transmembrane segment. Biochemistry. 2002;41:3647–3653. doi: 10.1021/bi0120502. [DOI] [PubMed] [Google Scholar]
- 24.Gratkowski H, Lear JD, DeGrado WF. Polar side chains drive the association of model transmembrane peptides. Proceedings of the National Academy of Sciences of the United States of America. 2001;98:880–885. doi: 10.1073/pnas.98.3.880. [DOI] [PMC free article] [PubMed] [Google Scholar]
- 25.Lear JD, Gratkowski H, DeGrado WF. De novo design, synthesis and characterization of membrane-active peptides. Biochemical Society Transactions. 2001;29:559–564. doi: 10.1042/bst0290559. [DOI] [PubMed] [Google Scholar]
- 26.Rausch JM, Marks JR, Wimley WC. Rational combinatorial design of pore-forming beta-sheet peptides. Proceedings of the National Academy of Sciences of the United States of America. 2005;102:10511–10515. doi: 10.1073/pnas.0502013102. [DOI] [PMC free article] [PubMed] [Google Scholar]
- 27.Grant GA. Synthetic peptides: A user’s guide. New York: WH Freeman and Company; 1992. [Google Scholar]
- 28.You M, Li E, Wimley WC, Hristova K. FRET in liposomes: measurements of TM helix dimerization in the native bilayer environment. Analytical Biochemistry. 2005;340:154–164. doi: 10.1016/j.ab.2005.01.035. [DOI] [PMC free article] [PubMed] [Google Scholar]
- 29.Johnson WC. Protein secondary structure and circular dichroism: A practical guide. Proteins. 1990;7:205–214. doi: 10.1002/prot.340070302. [DOI] [PubMed] [Google Scholar]
- 30.Ashish WC, Wimley Visual detection of specific, native interactions between soluble and microbead-tethered α-helices from membrane proteins. Biochemistry. 2001;40:13753–13759. doi: 10.1021/bi011449n. [DOI] [PubMed] [Google Scholar]
- 31.Mohanty AK, Bishop CM, Bishop TC, Wimley WC, Wiener MC. Enzymatic E-colicins bind to their target receptor BtuB by presentation of a small binding epitope on a coiled-coil scaffold. J Biol Chem. 2003;278:40953–40958. doi: 10.1074/jbc.M308227200. [DOI] [PubMed] [Google Scholar]
- 32.Sulistijo ES, Jaszewski TM, MacKenzie KR. Sequence-specific dimerization of the transmembrane domain of the “BH3-only” protein BNIP3 in membranes and detergent. J Biol Chem. 2003;278:51950–51956. doi: 10.1074/jbc.M308429200. [DOI] [PubMed] [Google Scholar]
- 33.Johnson RM, Heslop CL, Deber CM. Hydrophobic Helical Hairpins: Design and Packing Interactions in Membrane Environments. Biochemistry. 2004;43:14361–14369. doi: 10.1021/bi0492760. [DOI] [PubMed] [Google Scholar]
- 34.Iwamoto T, You M, Li E, Spangler J, Tomich JM, Hristova K. Synthesis and initial characterization of FGFR3 transmembrane domain: Consequences of sequence modifications. Biochim Biophys Acta. 2005;1668:240–247. doi: 10.1016/j.bbamem.2004.12.012. [DOI] [PubMed] [Google Scholar]
- 35.Wu PG, Brand L. Resonance energy transfer: Methods and applications. Anal Biochem. 1994;218:1–13. doi: 10.1006/abio.1994.1134. [DOI] [PubMed] [Google Scholar]
- 36.Reither S, Jeltsch A. Specificity of DNA triple helix formation analyzed by a FRET assay. BMC Biochemistry. 2002;3:27. doi: 10.1186/1471-2091-3-27. [DOI] [PMC free article] [PubMed] [Google Scholar]
- 37.Fisher LE, Engelman DM. HIgh-yield synthesis and purification of an α-helical transmembrane domain. Anal Biochem. 2001;293:102–108. doi: 10.1006/abio.2001.5122. [DOI] [PubMed] [Google Scholar]
- 38.Wimley WC, Selsted ME, White SH. Interactions between human defensins and lipid bilayers: Evidence for the formation of multimeric pores. Protein Sci. 1994;3:1362–1373. doi: 10.1002/pro.5560030902. [DOI] [PMC free article] [PubMed] [Google Scholar]
- 39.Ladokhin AS, Wimley WC, White SH. Leakage of membrane vesicle contents: Determination of mechanism using fluorescence requenching. Biophys J. 1995;69:1964–1971. doi: 10.1016/S0006-3495(95)80066-4. [DOI] [PMC free article] [PubMed] [Google Scholar]
- 40.Lakowicz JR. Principles of Fluorescence Spectroscopy. New York: Plenum Press; 1983. [Google Scholar]
- 41.Wolber PK, Hudson BS. An analytic solution to the Förster energy transfer problem in two dimensions. Biophys J. 1979;28:197–210. doi: 10.1016/S0006-3495(79)85171-1. [DOI] [PMC free article] [PubMed] [Google Scholar]
- 42.You M, Spangler J, Li E, Han X, Ghosh P, Hristova K. Effect of pathogenic cysteine mutations on FGFR3 transmembrane domain dimerization in detergents and lipid bilayers. Biochemistry. 2007;46:11039–11046. doi: 10.1021/bi700986n. [DOI] [PubMed] [Google Scholar]
- 43.Therien AG, Deber CM. Oligomerization of a peptide derived from the transmembrane region of the sodium pump gamma subunit: Effect of the pathological mutation G41R. J Mol Biol. 2002;322:583–590. doi: 10.1016/s0022-2836(02)00781-7. [DOI] [PubMed] [Google Scholar]
- 44.Merzlyakov M, Li E, Casas R, Hristova K. Spectral Forster resonance energy transfer detection of protein interactions in surface-supported bilayers. Langmuir. 2006;22:6986–6992. doi: 10.1021/la061038d. [DOI] [PubMed] [Google Scholar]
- 45.Cristian L, Lear JD, DeGrado WF. Use of thiol-disulfide equilibria to measure the energetics of assembly of transmembrane helices in phospholipid bilayers. Proceedings of the National Academy of Sciences of the United States of America. 2003;100:14772–14777. doi: 10.1073/pnas.2536751100. [DOI] [PMC free article] [PubMed] [Google Scholar]
- 46.Gerber D, Sal-Man N, Shai Y. Two motifs within a transmembrane domain, one for homodimerization and the other for heterodimerization. J Biol Chem. 2004;279:21177–21182. doi: 10.1074/jbc.M400847200. [DOI] [PubMed] [Google Scholar]
- 47.Hessa T, White SH, von Heijne G. Membrane insertion of a potassium-channel voltage sensor. Science. 2005;307:1427. doi: 10.1126/science.1109176. [DOI] [PubMed] [Google Scholar]
- 48.Wimley WC, White SH. Experimentally determined hydrophobicity scale for proteins at membrane interfaces. Nature Struct Biol. 1996;3:842–848. doi: 10.1038/nsb1096-842. [DOI] [PubMed] [Google Scholar]
- 49.Dawson JP, Weinger JS, Engelman DM. Motifs of serine and threonine can drive association of transmembrane helices. J Mol Biol. 2002;316:799–805. doi: 10.1006/jmbi.2001.5353. [DOI] [PubMed] [Google Scholar]
- 50.Han X, Mihailescu M, Hristova K. Neutron diffraction studies of fluid bilayers with transmembrane proteins: Structural consequences of the achondroplasia mutation. Biophys J. 2006;91:3736–3747. doi: 10.1529/biophysj.106.092247. [DOI] [PMC free article] [PubMed] [Google Scholar]
- 51.MacKenzie KR. Folding and stability of alpha-helical integral membrane proteins. Chem Rev. 2006;106:1931–1977. doi: 10.1021/cr0404388. [DOI] [PubMed] [Google Scholar]