Abstract
Accurate prediction of the pathogenic effects of specific genotypes is important for the design and execution of clinical trials as well as for meaningful counseling of individual patients. However, for many autosomal recessive diseases, it can be difficult to deduce the relative pathogenic contribution of individual alleles because relatively few affected individuals share the same two disease-causing variations. In this study, we used multiple regression analysis to estimate the pathogenicity of specific alleles of ABCA4 in patients with retinal phenotypes ranging from Stargardt disease to retinitis pigmentosa. This analysis revealed quantitative allelic effects on two aspects of the visual phenotype, visual acuity (P < 10−3) and visual field (P < 10−7). Discordance between visual acuity and visual field in individual patients suggests the existence of at least two non-ABCA4 modifying factors. The findings of this study will facilitate the discovery of factors that modify ABCA4 disease and will also aid in the optimal selection of subjects for clinical trials of new therapies.
INTRODUCTION
A major challenge and opportunity in human genetics is the use of genetic information to accurately predict the natural history (clinical course) of heritable disorders. There are at least five reasons why this is important to do. First, it allows clinicians to give a patient a more accurate prognosis than is possible with clinical methods alone. Second, as new treatments become available for clinical trial, it helps physicians judge the risk/benefit ratio of the treatment for each individual patient. Third, for some diseases, it can help determine the optimal point in the disease to initiate treatment. Fourth, it allows clinical trial investigators to balance treatment and control groups with respect to disease severity—an essential step if one is to obtain an accurate assessment of an intervention's value with the lowest possible number of subjects and in the shortest possible time. Finally, when one can reliably identify the portion of a given patient's disease caused by the disease gene itself, it makes it possible to identify additional genes and environmental factors that modify the disease in that patient. Identification of a major modifying factor can serve as the basis for the development of a new treatment.
For dominant diseases, it is often relatively straightforward to determine the relative pathogenicity of individual alleles because each affected person harbors only a single allele and because there are often several affected members of each family available for study. However, for many recessive diseases in outbred populations, the majority of affected patients are compound heterozygotes and the number of affected individuals in each family is small (1–3). As a result, the pathogenic effect of one of the alleles in each genotype is somewhat obscured by the other (4).
Variations in ABCA4 are the most common cause of autosomal recessive retinal disease in humans. ABCA4 mutations were originally discovered in patients with autosomal recessive Stargardt disease (SD) but shortly thereafter were also found to cause cone dystrophy, cone-rod dystrophy (CRD) and retinitis pigmentosa (RP), suggesting that a predictable relationship may exist between ABCA4 genotype and disease severity (5–10). However, the ABCA4 gene spans more than 100 000 bases and several hundred sequence variations have been identified within it (11–14). Most individuals with ABCA4-associated retinal disease are compound heterozygotes (3,4), making it difficult to deduce the specific pathogenic contribution of individual alleles.
In this study, we used multiple regression analysis to deduce the relative pathogenic effect of 16 specific alleles of the ABCA4 gene in patients with molecularly confirmed ABCA4 disease. We also estimated the contribution of non-ABCA4 factors to the disease phenotypes of these individuals.
RESULTS
The primary goal of this study was to determine the relative pathogenicity of different ABCA4 alleles and we therefore designed a screening strategy that would efficiently identify a large number of patients with two disease-causing alleles. A two-step screening method was used to accomplish this. The first step of the screen consisted of an inexpensive, high-throughput allele-specific assay designed to detect 32 of the most common disease-causing ABCA4 variations in the North American population. The second step consisted of automated DNA sequence analysis of the ABCA4 coding sequences of a subset of the individuals found to harbor only a single disease allele during the first step (see Materials and Methods). Since variations in ABCA4 cause a smaller fraction of RP than CRD or SD, the assay was used to screen 457 patients with RP, 60 patients with CRD, 176 patients with SD and 272 normal control individuals. One hundred sixty-nine instances of 61 different disease alleles were observed among the Stargardt patients compared with only four instances of three alleles observed among the control individuals (P < 10−10). Similarly, 14 different instances of 10 different alleles were observed among CRD patients (P < 10−6 compared with controls) and 43 instances of 23 different alleles were observed among patients with RP (P < 10−4). Eighty individuals with retinal disease and no control individuals were found to have two disease-causing alleles. Parents or other family members were available to confirm the phase of the two alleles in 44 of the 80 unrelated patients with two alleles and inheritance of one disease allele from each parent was confirmed in all of these cases. The specific genotypes of all individuals found to harbor one or more disease-causing variants in ABCA4 are shown in the Supplementary Material, Table.
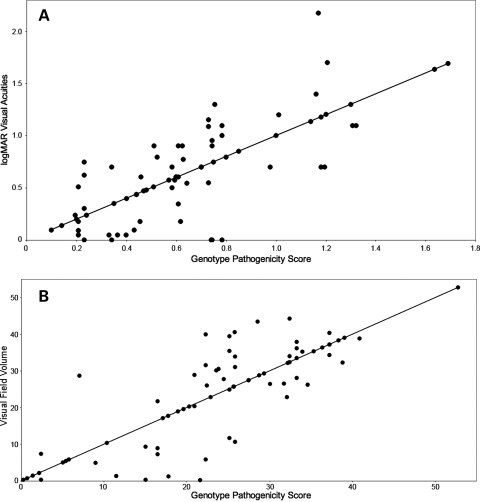
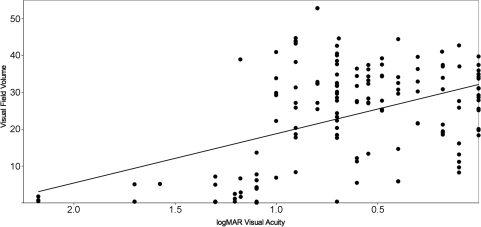
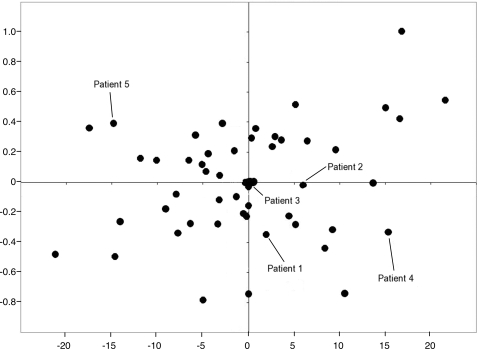
Two different measurements of visual function were used to assess the pathogenic contribution of individual ABCA4 alleles: a logMAR transformation of the best-corrected visual acuity and a volume score calculated from Goldmann visual fields (see Materials and Methods). At least one visual acuity measurement and one visual field were available from 69 of the 80 unrelated patients with two identified ABCA4 alleles. The phenotypic correlation between eyes in these individuals was high (R2 = 0.91 for the logMAR acuity and R2 = 0.94 for the visual field volume score). For 51 of the 69 patients with two disease-causing alleles, their rarer allele was present at least twice in the cohort. Multiple regression analysis of the genotypic and phenotypic data of these 51 individuals under an additive model yielded coefficients for each allele that are proportional to their pathogenicity (Table 1). We evaluated the statistical significance and clinical relevance of these coefficients in two ways. First, we placed the 16 alleles of Table 1 in order of their regression coefficients and tested all 17 possible dichotomous divisions (i.e. A = mild and B = severe, Table 1) of these ranked alleles for the ability to reject the null hypothesis that all alleles have equal effects on the phenotype. This test revealed that as a group, the A alleles had significantly milder effects than B alleles on both visual acuity (P < 10−3) and visual field (P < 10−7). Next, the regression coefficients for both alleles of each individual were added to create a genotype pathogenicity score and this score was compared with each individual's visual acuity (Fig. 1A) and visual field (Fig. 1B). The R2 values for both of these comparisons were moderate, 0.56 for the visual acuity data and 0.68 for the visual field data, suggesting that factors other than the ABCA4 genotype also play a role in the magnitude of both of these phenotypes in individual patients. If these non-ABCA4 factors had similar effects on visual acuity and visual field, one would expect these two measurements of visual function to be highly correlated to one another. However, Figure 2 shows that this is not the case. The correlation of visual acuity and visual field among the members of this cohort is noticeably less (R2 = 0.20) than the correlation of either metric to ABCA4 genotype (Fig. 1). The magnitude of the non-ABCA4 effects in each individual can be represented mathematically as residual values in each of the two multiple regression analyses. Figure 3 shows that there is no correlation (R2 = 0.06) between the residual values in this cohort, again suggesting that the factors that modify ABCA4's effect on visual acuity are largely different from the factors that modify the gene's effect on visual field.
Table 1.
Regression coefficients for visual field score and visual acuity for the most common alleles in the cohort of patients with two disease-causing ABCA4 alleles. Alleles are shown in the order of decreasing visual field score coefficients.
| Allele | VF model | Acuity model | Occurrences | Groupa |
|---|---|---|---|---|
| Leu2027Phe | 22.81 | 0.14 | 4 | a |
| Leu1201Arg | 22.29 | 0.16 | 2 | a |
| Met316fs | 20.71 | −0.15 | 4 | a |
| Gly1961Glu | 18.08 | 0.26 | 8 | a |
| Gly863Ala | 16.54 | 0.36 | 19 | a |
| Pro1380Leu | 15.88 | 0.39 | 10 | a |
| Ala1038Val | 15.19 | −0.03 | 12 | a |
| Leu541Pro | 10.95 | 0.08 | 1 | b |
| Asn965Ser | 9.3 | 0.07 | 3 | b |
| IVS40 + 5 | 9.29 | 0.22 | 9 | b |
| Val256Val | 9.27 | 0.84 | 2 | b |
| Phe608Ile | 7.24 | 0.48 | 2 | b |
| IVS38-10 | 5.75 | 0.37 | 14 | b |
| Arg1108Cys | 1.29 | 0.81 | 6 | b |
| Leu1430fs | 0.37 | 0.6 | 2 | b |
| Arg2077Trp | −6.89 | 0.93 | 4 | b |
aWhen analyzed as groups, A alleles have significantly milder effects on both visual acuity (P < 10−3) and visual field (P < 10−7) than B alleles (see text).
Figure 1.
Correlation of phenotype and genotype. (A) The correlation (R2 = 0.56) of the sum of allelic regression coefficients (genotype pathogenicity score) with the best-corrected visual acuity expressed as the log of the minimum angle of resolution. (B) The correlation (R2= 0.68) of the sum of allelic regression coefficients with the visual field volume score (see Materials and Methods).
Figure 2.
Correlation of visual acuity and visual field. The average visual acuity measurement from each patient is given on the x-axis and the average visual field measurement from each patient is given on the y-axis. The relatively poor correlation between these values (R2= 0.20) is an indication that non-ABCA4 modifying factors exist that have different effects on these two measures of visual function.
Figure 3.
Comparison of residual values from the visual acuity and visual field regression analyses. The residual values from the visual acuity regression analysis are given on the x-axis, while those of the visual field regression analysis are given on the y-axis. Individuals represented to the left of the y-axis have visual fields that are better than expected for their genotype while those to the right of the y-axis have visual fields that are worse than expected. Individuals above the x-axis have visual acuities that are poorer than expected for their genotype, while individuals below the x-axis have visual acuities better than expected. The residuals of the five patients depicted in Figure 5 are specifically labeled. The R2 value for these data is 0.06.
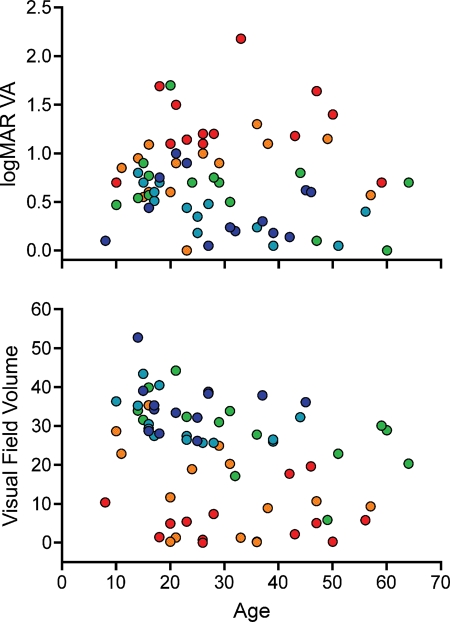
The analyses shown in Table 1 and Figures 1–3 were performed using phenotypic data from a single visit per patient. The median age of patients with a single visual field available for study was 27 years, so for the patients with multiple visits, the visit that occurred closest to their 27th birthday was the one included in the analyses. To examine the rate of disease progression associated with each genotype, one would ideally have access to multiple visual field and/or acuity measurements from every one of the two-allele patients taken at evenly spaced intervals spanning a period of decades. In the absence of such a complete data set, we attempted to gain a general understanding of the temporal behavior of ABCA4 genotypes by plotting the phenotypic measurements from the cohort of 69 two allele patients as a function of age. Figure 4A shows the visual field data sorted into quintiles of genotype pathogenicity score. Figure 4B shows a similar presentation of the visual acuity data. These figures show that the majority of the phenotypic difference among the quintiles is manifest before age 20. Given that more than 90% of the data in the regression analyses were obtained from patients older than 20 years, it is not surprising that we observed little effect of age on the analyses.
Figure 4.
Visual function over time. (A) The visual acuity values (y-axis) used for the multiple regression analysis plotted with respect to age. Each individual's genotype score (sum of their allelic coefficients) is indicated by color with the mildest quintile shown in dark blue and the remaining quintiles in the increasing order of severity shown in light blue, green, orange and red. (B) Similar presentation of the visual field values. In both panels, better visual function is at the top of the figure and poorer visual function is at the bottom. The majority of the difference in visual function among these five quintiles of ABCA4 genotype occurs before age 20.
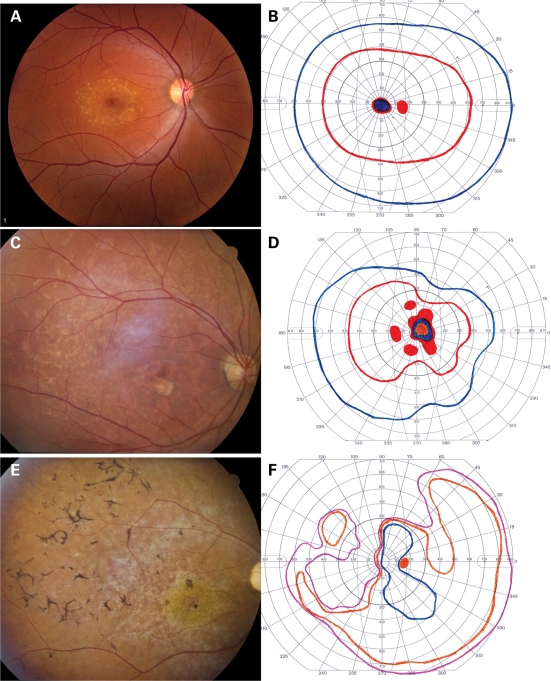
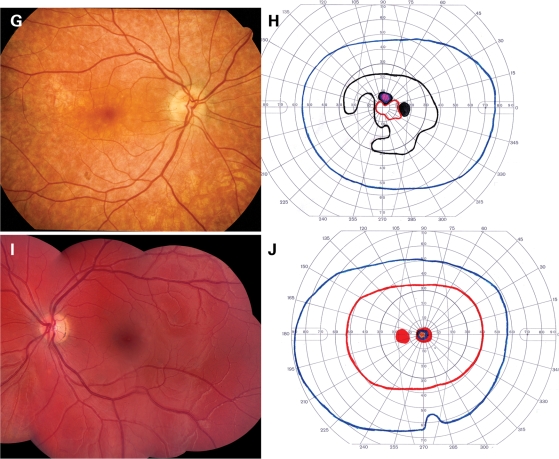
Figure 5 shows the ophthalmoscopic appearance and Goldmann visual fields of five patients from the two allele cohort. In each visual field, the colored lines represent the boundaries (isopters) within which stimuli of various sizes and intensities were visible to the patient. The red line indicates the area in which the smallest and dimmest target (I2e) was visible, whereas the purple line indicates the area within which the largest and brightest target (V4e) was seen (see Materials and Methods). Areas of solid color indicate zones in which a stimulus was not seen. Three individuals (Fig. 5A–F) are concordant with the additive pathogenicity model in that they had small residual values in both the visual acuity and visual field regression analyses (Fig. 3). In contrast, the other two individuals (Fig. 5G–J) each exhibited substantial departures from the additive model in both analyses. The patient shown in Figure 5A and B is typical for individuals with two relatively mild ABCA4 alleles. The visual acuity and visual field are excellent despite numerous yellow flecks at the level of the retinal pigment epithelium (RPE) largely confined to a 3–4 mm ellipse centered on the fovea. Figure 5C and D depicts an individual that is typical for patients with one mild and one severe allele. Flecks are present throughout the posterior pole, a circular patch of RPE atrophy is centered on the fovea and the I2e isopter of the visual field (red line) is moderately constricted. Figure 5E and F depicts an individual with two severe alleles. The fundus shows a ‘beaten metal’ appearance in the macula and extensive bone-spicule-like intra-retinal pigment. The I2e isopter has been lost and some areas of absolute scotoma are present. Figure 5G and H depicts a patient with two mild alleles, but visual fields that are considerably worse than average for patients with this genotype pathogenicity score. The RPE is diffusely thin and the choroidal vasculature is easily visible in some areas. The I2e isopter is preserved centrally but is markedly constricted. Figure 5I and J depicts a patient with two mild alleles but visual acuity that is noticeably worse than average for patients with this genotype. The RPE is completely intact, obscuring all details of the underlying choroidal vasculature. No flecks are present. There is a small, dense scotoma centered on fixation but the visual fields are otherwise normal.
Figure 5.
Fundus photographs and Goldman visual fields of five patients with ABCA4-associated retinal disease. The patients depicted in the upper 10 panels have acuities and visual fields that are completely predicted by the additive effects of their ABCA4 alleles. The patient depicted in (G) and (H) has better visual acuity and poorer visual fields than expected for her genotype, while the patient depicted in (I) and (J) has poorer visual acuity and better fields than expected. (A) and (B) depict the left eye of a 27-year-old woman with a mild ABCA4 genotype, 20/30 acuity and a visual field score of 37.5; (C) and (D) depict the right eye of an 24-year-old man with a moderate ABCA4 genotype, 20/160 acuity and a visual field score of 18.6; (E) and (F) depict the right eye of a 26-year-old man with a severe ABCA4 genotype, 10/160 acuity and a visual field score of 1.1; (G) and (H) depict the right eye of a 47-year-old woman with a moderate ABCA4 genotype, 20/20 acuity and a visual field score of 8.2; (I) and (J) depict the left eye of a 15-year-old woman with a moderate ABCA4 genotype, 20/160 acuity and a visual field score of 43.2.
DISCUSSION
The clinical variation observed among individuals with disease-causing mutations in the same gene can have at least five different non-exclusive explanations: variable structural and/or functional effects of different alleles on the proteins they encode, varying biological effects of the altered proteins on different cell types within affected tissues, effects of one or more modifying genes (i.e. the genetic background), environmental effects and effects of stochastic events occurring during development. For diseases that are inherited in an autosomal recessive fashion, the situation can be even more complicated. When the majority of affected individuals in a population are compound heterozygotes—as is the case when a gene has many alleles and is studied in an outbred population—it is difficult to distinguish the pathological effects of the two alleles in a given patient.
In this study, we investigated a group of patients affected with ABCA4-associated retinal disease, a condition in which most if not all of the previously mentioned complexities exist. Using multiple regression analysis, we found that the majority of the clinical variation among these patients is traceable to the functional sum of their two alleles. The relative pathogenicity of the 16 alleles that were observed most frequently in this cohort is given by the regression coefficients for each allele summarized in Table 1. As additional patients are studied using these methods, these values will become increasingly accurate. However, these numbers, coupled with the demonstration shown in Figure 1 that the alleles behave in an additive fashion with respect to visual phenotypes, will already be useful to investigators who wish to balance treatment and control groups for clinical trials of treatments for ABCA4-associated retinal disease.
We expected that there would be some non-ABCA4-related phenotypic variation among the patients in this cohort and this was most easily seen as the departures from the additive model lines in Figure 1A and B. However, we also expected that much of this variation would affect both visual phenotypes fairly equally. We were surprised to find that the visual acuity and visual field measurements in this cohort had a poorer correlation to each other than either of them did to ABCA4 genotype (Fig. 2), suggesting that the most powerful modifying factors affected the two phenotypes quite differently. This was most dramatically shown by the complete lack of correlation between the residuals of the regression analyses (Fig. 3), which represent the magnitudes of the modifying factors for visual acuity and visual field after subtraction of the effects of the ABCA4 gene itself.
Using the values in Table 1 and Figure 3, we were able to review the clinical records and retinal photographs of the patients in the cohort for clues to the nature of these modifying factors. Three of the patients shown in Figure 5 have small residual values for both the visual acuity and the visual field regression analyses suggesting that their clinical features are due almost entirely to the effects of the mutations present in their ABCA4 genes. The patient with the mildest genotype exhibits noticeable yellowish deposits at the level of the RPE but little evidence of photoreceptor cell death. The patient with the moderate genotype exhibits significant injury of the foveal photoreceptors but insufficient photoreceptor loss elsewhere to result in bone-spicule-like pigmentation. The patient with the most severe genotype exhibits widespread loss of both cone and rod photoreceptors in addition to significant injury to the RPE. This sequence of cellular effects—RPE, cones and rods—is compatible with our current understanding of the function of the ABCA4 protein (recently reviewed by 14) and the physiology of these three cell types. ABCA4 encodes an ATP-binding cassette transporter (15) that couples ATP hydrolysis to the translocation of a visual cycle intermediate (N-retinylidene-phosphatidylethanolamine—N-ret-PE) from the inner leaflet of the photoreceptor disk membrane to the outer leaflet (16–18). Reduced function of this protein allows an additional molecule of all-trans-retinal to covalently and irreversibly bind to N-ret-PE to form a more toxic diretinal pyridinium compound known as A2E (16,17,19). The outer segments of rod photoreceptors turn over completely every 10 days (20), while cone photoreceptors turn over at about half that rate (21). The outermost parts of the photoreceptor outer segments are phagocytosed by the RPE as new photoreceptive elements are added at the junction of the inner and outer segments. When the accumulation of A2E is fairly slow, as it would be with the mildest genotypes, one might expect its concentration in the photoreceptors to remain below a level that would cause photoreceptor injury while steadily accumulating in the RPE. With more severe genotypes, one might expect that the first photoreceptor cells to suffer injury would be those with the slowest turnover (cones). Only with the most severe genotypes would the rapidly renewed rods accumulate enough A2E to cause primary (i.e. not secondary to RPE loss) rod photoreceptor death.
The remaining two patients in Figure 5 are illustrative of the phenotypic effects of two unrelated modifying factors: one that modifies acuity with little effect on visual field and one that modifies visual field with little effect on acuity. Patient 4 in Figure 5 has a favorable acuity modifier (protecting the foveal cones in the face of a moderate ABCA4 genotype) and an unfavorable visual field modifier resulting in widespread RPE thinning and patches of RPE atrophy. Patient 5 in Figure 5 is the reverse of patient 4. In this individual, an unfavorable acuity modifier results in early loss of foveal cones, while a favorable visual field protects the RPE cells from death despite significant accumulations of intracellular A2E.
The effect of patient age on the phenotype of ABCA4 disease is interesting. Our data show that the majority of the difference among patients with mild, moderate and severe genotypes is already evident by age 20 (Fig. 4). Although it would be tempting to try to infer the temporal behavior of ABCA4-associated disease based on cross-sectional data, there are two reasons that this might be somewhat misleading. First, there is a definite bias of ascertainment in favor of patients with reduced visual acuity and/or striking fundus findings. Thus, the data points in Figure 4 are unlikely to be a random sampling of all patients affected with ABCA4 retinal disease. Second, two of the patients in this cohort with multiple acuity and field measurements showed substantial worsening after age 40 (data not shown), suggesting that the population trend of stability after age 20 does not apply to all patients.
Application of the methods used in this study to additional cohorts of patients with autosomal recessive disease will further refine our understanding of the relative pathogenic effects of specific alleles. Doing so will improve the prognostic value of genetic testing, contribute to the optimal selection of subjects in clinical trials and facilitate the discovery of non-allelic factors that modify the disease phenotype.
MATERIALS AND METHODS
Subjects
All subjects provided written informed consent for this research study, which was approved by the University of Iowa Human Subjects Committee.
The study included 176 patients with SD, 457 patients with RP, 60 patients with CRD and 272 normal control subjects. Seventeen members of this cohort (13 with SD, 1 with CRD and 3 with RP) had disease-causing mutations identified on one or both alleles in previous studies that employed single-strand conformational polymorphism analysis as the primary screening method (3). All patients and control subjects were ascertained in the outpatient ophthalmology clinic at the University of Iowa. All patients received a complete eye examination including measurement of Snellen visual acuity, slit lamp biomicroscopy of the anterior segment and fundus, and binocular indirect ophthalmoscopy. Most patients had fundus photography and Goldmann perimetry performed as well.
Molecular characterization of the ABCA4 gene
A multi-platform screening approach was used to genotype the ABCA4 gene in all 693 research subjects and 272 controls. Thirty-two of the most common disease-causing ABCA4 variations were selected for the initial screen. The entire research cohort was assayed for these 32 variations using a combination of SNPlex, SSCP analysis, TaqMan and automated DNA sequencing (3). The SNPlex and TaqMan assays were performed as previously described (22,23). Fourteen of the variations were compatible with Applied Biosystems SNPlex allele-specific assay platform. Nine variations were screened by SSCP analysis, three were screened using an Applied Biosystems' TaqMan assay and six were screened by automated DNA sequencing. All CRD and RP patients who had one plausible disease-causing allele identified in the first tier of screening were assayed by automated sequencing of the entire coding region of the ABCA4 gene in an effort to identify their second disease-causing allele. In addition, Stargardt patients who had one of the three most common alleles (Gly863Ala, Gly1961Glu or IVS38-10) were also sequenced through the entire coding region of the ABCA4 gene.
Visual acuity
The best-corrected visual acuity was recorded in each patient's medical record as a Snellen fraction (normal = 20/20). Before statistical analysis, these values were converted to the logarithm of the minimal angle of resolution (logMAR) by calculating the base 10 logarithm of the Snellen fraction [e.g. normal = log(20/20) = 0]. For patients with multiple hospital visits, the acuity measurements taken closest to the patient's 27th birthday were used for the statistical analysis. Values from the left eye and right eye were averaged.
Visual field volume scores
Goldmann visual fields were scanned with a Sharp scanner and analyzed with ImageJ software (available at http://rsbweb.nih.gov/ij/) as follows: transparent layers were added to each field, and the isopters of the visual fields were manually traced onto these layers. Each isopter was assigned a z-axis value according to relative luminous energy of the stimulus (I2e = 100, I3e = 31.7, I4e = 10, III4e = 0.49, V4e = 0.024, no detection = 0). The volume scores were calculated by multiplying the area of each isopter by its associated z-axis value and then summing the values for all isopters. For patients with multiple hospital visits, the visual field measurements taken closest to the patient's 27th birthday were used for the statistical analysis. Values from the left eye and right eye were averaged.
Statistical analyses
The frequencies of disease-causing alleles observed among the three groups of retinal disease patients were compared with the frequency in controls using Fisher's exact test. The phenotype of each patient was assumed to result from the additive effect of two alleles and one or more additional factors that were cumulatively represented by a single residual value for each subject. The values for the quantitative contribution of each allele were estimated using a multiple linear regression analysis (24). Specifically, to dissect the effect of each allele, we decomposed the mean phenotype of a person whose genotype consists of allele i and allele j into ai + aj, where ai is the effect of the i-th allele. To do this, we created a vector Yva of length 51 containing the average logMAR visual acuities for each subject, and a 51x16 matrix, X. Each cell of this matrix, Xij, indicated the number of occurrences of the j-th allele for each subject i. This system of 51 equations was solved with multiple linear regression to give estimates of a, using the statistics program R (available at http://www.R-project.org). To verify the allelic data, each row of X summed to 2, and each column summed to the corresponding number of occurrences of each allele for this cohort. These calculations were performed in the same manner for Yvol, the vector of containing each subject's visual field quantitative phenotype. The estimates of a, the coefficients for each allele, for both Yva and Yvol are given in Table 1.
SUPPLEMENTARY MATERIAL
FUNDING
This research was supported by the National Eye Institute R01 EY016822, the Foundation Fighting Blindness, the Carver Charitable Trust, the Carver Endowment for Molecular Ophthalmology and the Howard Hughes Medical Institute. Funding to pay the Open Access Charge was provided by the Howard Hughes Medical Institute.
Supplementary Material
ACKNOWLEDGEMENTS
The authors thank Dr Chris Johnson for his helpful suggestions regarding the visual field volume calculations and Jean Andorf and Becky Johnston for their excellent technical assistance.
Conflict of Interest statement. None declared.
REFERENCES
- 1.Shroyer N.F., Lewis R.A., Lupski J.R. Complex inheritance of ABCR mutations in Stargardt disease: linkage disequilibrium, complex alleles, and pseudodominance. Hum. Genet. 2000;106:244–248. doi: 10.1007/s004390051034. doi:10.1007/s004390051034. [DOI] [PubMed] [Google Scholar]
- 2.Shroyer N., Lewis R.A., Yatsenko A.N., Wensel T.G., Lupski J.R. Cosegregation and functional analysis of mutant ABCR (ABCA4) alleles in families that manifest both Stargardt disease and age-related macular degeneration. Hum. Mol. Genet. 2001;10:2671–2678. doi: 10.1093/hmg/10.23.2671. doi:10.1093/hmg/10.23.2671. [DOI] [PubMed] [Google Scholar]
- 3.Webster A.R., Heon E., Lotery A.J., Vandenburgh K., Casavant T.L., Oh K.T., Beck G., Fishman G.A., Lam B.L., Levin A., et al. An analysis of allelic variation in the ABCA4 gene. Invest. Ophthalmol. Vis. Sci. 2001;42:1179–1189. [PubMed] [Google Scholar]
- 4.Maugeri A., van Driel M.A., van de Pol D.J., Klevering B.J., van Haren F.J., Tijmes N., Bergen A.A., Rohrschneider K., Blankenagel A., Pinckers A.J., et al. The 2588G–>C mutation in the ABCR gene is a mild frequent founder mutation in the Western European population and allows the classification of ABCR mutations in patients with Stargardt disease. Am. J. Hum. Genet. 1999;64:1024–1035. doi: 10.1086/302323. doi:10.1086/302323. [DOI] [PMC free article] [PubMed] [Google Scholar]
- 5.Allikmets R., Singh N., Sun H., Shroyer N.F., Hutchinson A., Chidambaram A., Gerrard B., Baird L., Stauffer D., Peiffer A., et al. A photoreceptor cell-specific ATP-binding transporter gene (ABCR) is mutated in recessive Stargardt macular dystrophy. Nat. Genet. 1997;15:236–246. doi: 10.1038/ng0397-236. doi:10.1038/ng0397-236. [DOI] [PubMed] [Google Scholar]
- 6.Cremers F.P., van de Pol D.J., van Driel M., den Hollander A.I., van Haren F.J., Knoers N.V., Tijmes N., Bergen A.A., Rohrschneider K., Blankenagel A., et al. Autosomal recessive retinitis pigmentosa and cone-rod dystrophy caused by splice site mutations in the Stargardt's disease gene ABCR. Hum. Mol. Genet. 1998;7:355–362. doi: 10.1093/hmg/7.3.355. doi:10.1093/hmg/7.3.355. [DOI] [PubMed] [Google Scholar]
- 7.Martinez-Mir A., Paloma E., Allikmets R., Ayuso C., del Rio T., Dean M., Vilageliu L., Gonzalez-Duarte R., Balcells S. Retinitis pigmentosa caused by a homozygous mutation in the Stargardt disease gene ABCR. Nat. Genet. 1998;18:11–12. doi: 10.1038/ng0198-11. doi:10.1038/ng0198-11. [DOI] [PubMed] [Google Scholar]
- 8.Fishman G.A., Stone E.M., Grover S., Derlacki D.J., Haines H.L., Hockey R.R. Variation of clinical expression in patients with Stargardt dystrophy and sequence variations in the ABCR gene. Arch. Ophthalmol. 1999;117:504–510. doi: 10.1001/archopht.117.4.504. [DOI] [PubMed] [Google Scholar]
- 9.Maugeri A., Klevering B.J., Rohrschneider K., Blankenagel A., Brunner H.G., Deutman A.F., Hoyng C.B., Cremers F.P. Mutations in the ABCA4 (ABCR) gene are the major cause of autosomal recessive cone-rod dystrophy. Am. J. Hum. Genet. 2000;67:960–966. doi: 10.1086/303079. doi:10.1086/303079. [DOI] [PMC free article] [PubMed] [Google Scholar]
- 10.Fishman G.A., Stone E.M., Eliason D.A., Taylor C.M., Lindeman M., Derlacki D.J. ABCA4 gene sequence variations in patients with autosomal recessive cone-rod dystrophy. Arch. Ophthalmol. 2003;121:851–855. doi: 10.1001/archopht.121.6.851. doi:10.1001/archopht.121.6.851. [DOI] [PubMed] [Google Scholar]
- 11.Azarian S.M., Megarity C.F., Weng J., Horvath D.H., Travis G.H. The human photoreceptor rim protein gene (ABCR): genomic structure and primer set information for mutation analysis. Hum. Genet. 1998;102:699–705. doi: 10.1007/s004390050765. doi:10.1007/s004390050765. [DOI] [PubMed] [Google Scholar]
- 12.Stone E.M., Webster A.R., Vandenburgh K., Streb L.M., Hockey R.R., Lotery A.J., Sheffield V.C. Allelic variation in ABCR associated with Stargardt disease but not age-related macular degeneration. Nat. Genet. 1998;20:328–329. doi: 10.1038/3798. doi:10.1038/3798. [DOI] [PubMed] [Google Scholar]
- 13.Simonelli F., Testa F., de Crecchio G., Rinaldi E., Hutchinson A., Atkinson A., Dean M., D'Urso M., Allikmets R. New ABCR mutations and clinical phenotype in Italian patients with Stargardt disease. Invest. Ophthalmol. Vis. Sci. 2000;41:892–897. [PubMed] [Google Scholar]
- 14.Molday R.S., Zhong M., Quazi F. The role of the photoreceptor ABC transporter ABCA4 in lipid transport and Stargardt macular degeneration. Biochim. Biophys. Acta. 2009;1791:573–583. doi: 10.1016/j.bbalip.2009.02.004. [DOI] [PMC free article] [PubMed] [Google Scholar]
- 15.Allikmets R. A photoreceptor cell-specific ATP-binding transporter gene (ABCR) is mutated in recessive Stargardt macular dystrophy. Nat. Genet. 1997;17:122. doi: 10.1038/ng0997-122a. [DOI] [PubMed] [Google Scholar]
- 16.Weng J., Mata N.L., Azarian S.M., Tzekov R.T., Birch D.G., Travis G.H. Insights into the function of Rim protein in photoreceptors and etiology of Stargardt's disease from the phenotype in abcr knockout mice. Cell. 1999;98:13–23. doi: 10.1016/S0092-8674(00)80602-9. doi:10.1016/S0092-8674(00)80602-9. [DOI] [PubMed] [Google Scholar]
- 17.Mata N., Weng J., Travis G. Biosynthesis of a major lipofuscin fluorophore in mice and humans with ABCR-mediated retinal and macular degeneration. Proc. Natl Acad. Sci. USA. 2000;97:7154–7159. doi: 10.1073/pnas.130110497. doi:10.1073/pnas.130110497. [DOI] [PMC free article] [PubMed] [Google Scholar]
- 18.Beharry S., Zhong M., Molday R.S. N-retinylidene-phosphatidylethanolamine is the preferred retinoid substrate for the photoreceptor-specific ABC transporter ABCA4 (ABCR) J. Biol. Chem. 2004;279:53972–53979. doi: 10.1074/jbc.M405216200. doi:10.1074/jbc.M405216200. [DOI] [PubMed] [Google Scholar]
- 19.Sparrow J.R., Nakanishi K., Parish C.A. The lipofuscin fluorophore A2E mediates blue light-induced damage to retinal pigmented epithelial cells. Invest. Ophthalmol. Vis. Sci. 2000;41:1981–1989. [PubMed] [Google Scholar]
- 20.Young R.W. The renewal of rod and cone outer segments in the rhesus monkey. J. Cell Biol. 1971;49:303–318. doi: 10.1083/jcb.49.2.303. doi:10.1083/jcb.49.2.303. [DOI] [PMC free article] [PubMed] [Google Scholar]
- 21.Young R.W. The daily rhythm of shedding and degradation of rod and cone outer segment membranes in the chick retina. Invest. Ophthalmol. Vis. Sci. 1978;17:105–116. [PubMed] [Google Scholar]
- 22.Stone E.M. Leber congenital amaurosis—a model for efficient genetic testing of heterogeneous disorders: LXIV Edward Jackson Memorial Lecture. Am. J. Ophthalmol. 2007;144:791–811. doi: 10.1016/j.ajo.2007.08.022. doi:10.1016/j.ajo.2007.08.022. [DOI] [PubMed] [Google Scholar]
- 23.Ennis S., Jomary C., Mullins R., Cree A., Chen X., Macleod A., Jones S., Collins A., Stone E., Lotery A. Association between the SERPING1 gene and age-related macular degeneration: a two-stage case–control study. Lancet. 2008;372:1828–1834. doi: 10.1016/S0140-6736(08)61348-3. doi:10.1016/S0140-6736(08)61348-3. [DOI] [PMC free article] [PubMed] [Google Scholar]
- 24.Lange . Mathematical and Statistical Methods for Genetic Analysis. New York, NY: Springer; 2002. [Google Scholar]
Associated Data
This section collects any data citations, data availability statements, or supplementary materials included in this article.


