Abstract
Left ventricular (LV) segmentation, including accurate assignment of LV contours, is essential for the quantitative assessment of myocardial perfusion SPECT (MPS). Two major types of segmentation failures are observed in clinical practices: incorrect LV shape determination and incorrect valve-plane (VP) positioning. We have developed a technique to automatically detect these failures for both nongated and gated studies.
Methods
A standard Cedars-Sinai perfusion SPECT (quantitative perfusion SPECT [QPS]) algorithm was applied to derive LV contours in 318 consecutive 99mTc-sestamibi rest/stress MPS studies consisting of stress/rest scans with or without attenuation correction and gated stress/rest images (1,903 scans total). Two numeric parameters, shape quality control (SQC) and valve-plane quality control, were derived to categorize the respective contour segmentation failures. The results were compared with the visual classification of automatic contour adequacy by 3 experienced observers.
Results
The overall success of automatic LV segmentation in the 1,903 scans ranged from 66% on nongated images (incorrect shape, 8%; incorrect VP, 26%) to 87% on gated images (incorrect shape, 3%; incorrect VP, 10%). The overall interobserver agreement for visual classification of automatic LV segmentation was 61% for nongated scans and 80% for gated images; the agreement between gray-scale and color-scale display for these scans was 86% and 91%, respectively. To improve the reliability of visual evaluation as a reference, the cases with intra- and interobserver discrepancies were excluded, and the remaining 1,277 datasets were considered (101 with incorrect LV shape and 102 with incorrect VP position). For the SQC, the receiver-operating-characteristic area under the curve (ROC-AUC) was 1.0 ± 0.00 for the overall dataset, with an optimal sensitivity of 100% and a specificity of 98%. The ROC-AUC was 1.0 in all specific datasets. The algorithm was also able to detect the VP position errors: VP overshooting with ROC-AUC, 0.91 ± 0.01; sensitivity, 100%; and specificity, 70%; and VP undershooting with ROC-AUC, 0.96 ± 0.01; sensitivity, 100%; and specificity, 70%.
Conclusion
A new automated method for quality control of LV MPS contours has been developed and shows high accuracy for the detection of failures in LV segmentation with a variety of acquisition protocols. This technique may lead to an improvement in the objective, automated quantitative analysis of MPS.
Keywords: single photon emission computed tomography, quality control, myocardial perfusion imaging, left ventricle segmentation
The quantification of perfusion and function from myocardial perfusion SPECT (MPS) relies on the accurate segmentation of the left ventricle. Current software tools allow automatic definition of the left ventricular (LV) contours and manual correction if needed (1–4). In gated MPS analysis, Cedars-Sinai's automatic segmentation, developed by Germano et al., showed a high success rate (98.5%) in segmenting the LV contours of 400 dual-isotope studies (200 rest 201Tl and 200 stress 99mTc-sestamibi) (5). However, failure in that study was defined as the complete inability of the algorithm to segment the left ventricle, without any consideration of the subtle issues of valve-plane (VP) positioning. Moreover, subsequent studies, including ours, have shown that segmentation fails more often for specific imaging conditions and protocols, particularly for attenuation-corrected static scans (6). The current determination of when contour adjustment is needed is subjective and based on visual interpretation; the consequent operator adjustments add significant observer variability to an otherwise automated analysis. More important, failure to recognize incorrect segmentation of the left ventricle may cause inaccurate results in the quantification of MPS, including perfusion parameters such as total perfusion deficit (TPD), and defect extent at stress and rest (7). To minimize the subjectivity of visual interaction, the user should be provided with a reliable contour quality feedback that issues a warning when the automated results generated from the program may not be correct.
The primary aim of this project was to develop a quality control (QC) system for the fully automated cardiac SPECT quantification system for analysis of myocardial perfusion and to quantify the segmentation error of the left ventricle as the first step to achieve the aim. This first step is important, because incorrect segmentation of the left ventricle will cause errors in perfusion analysis. We do include, however, the analysis of gated contour detection as well, because gated contours could be used as an aid in the detection of the contours for the static images or for the creation of motion-frozen images for the analysis of perfusion contours derived by our quantitative gated segmentation (QGS)/quantitative perfusion SPECT (QPS) algorithm. The contour quality is described by 2 parameters, LV shape and position of the VP. This technique can be applied to gated and nongated MPS studies, obtained with or without attenuation correction.
We demonstrate that it is possible to achieve a high sensitivity for the detection of incorrect contours, with acceptable false-positive rates. This tool can be easily implemented into standard clinical practice as an additional warning flag for the existing MPS quantification software. To our knowledge, such a clinical tool for LV contour QC has not been previously described.
MATERIALS AND METHODS
Patients
A total of 318 sequential studies of 123 women and 195 men who underwent MPS and had coronary angiography within 60 d without significant intervening cardiac events were selected for the evaluation of our new algorithm. Among these, 104 patients had pharmacologic stress testing (102 adenosine and 2 dobuta-mine). The remaining 214 patients who underwent treadmill stress testing achieved a heart rate that was 92% ± 7.7% of the maximum age-predicted heart rate at the time of radiotracer injection. Among these, 11 patients diagnosed with cardiomyopathy, 5 patients with left bundle branch block or paced rhythm, and 2 patients with severe aortic stenosis were included. The clinical characteristics for all patients in this study are summarized in Table 1. Each study consisted of 6 SPECT datasets, including attenuation-corrected stress/rest scans (AC-S/AC-R), noncorrected stress/rest scans (NAC-S/NAC-R), and NAC gated stress/rest images (Gated-S/Gated-R).
TABLE 1.
Characteristics of Patients
| Characteristic | Value |
|---|---|
| Total (n) | 318 |
| Sex (n) | |
| Male | 195 (61%) |
| Female | 123 (39%) |
| BMI (n) | |
| <30 kg/m2 | 160 (50%) |
| ≥30 kg/m2 | 158 (50%) |
| Protocol (n) | |
| 1 d | 244 (77%) |
| 2 d | 74 (23%) |
| Angiography result | |
| No coronary artery disease | 80 (25%) |
| Stenosis ≥ 50% | 236 (74%) |
| Stenosis ≥ 70% | 222 (70%) |
| Diabetes (n) | 90 (28%) |
| Hypertension (n) | 192 (60%) |
| Hypercholesteremia (n) | 145 (46%) |
| Typical angina (n) | 81 (25%) |
| Atypical angina or no angina (n) | 227 (71%) |
| Dyspnea (n) | 35 (11%) |
| Age | |
| Average | 63 |
| SD | 11.7 |
| BMI | |
| Average | 30.9 |
| SD | 6.5 |
| TPD ≥ 5% (n) | |
| Stress | 361 |
| Rest | 146 |
| Median TPD (%) ± SD | |
| Stress | 7.25 ± 11.5 |
| Rest | 1 ± 7.7 |
| Median ejection fraction (%) ± SD | |
| Stress | 58.8 ± 13.0 |
| Rest | 60.9 ± 12.7 |
BMI = body mass index.
Image Acquisition and Reconstruction Protocol
The details of image acquisition and tomographic reconstruction for this study have been described in a previous study (8) and are described briefly in the supplemental materials (available online only at http://jnm.snmjournals.org).
The Quantitative Algorithm
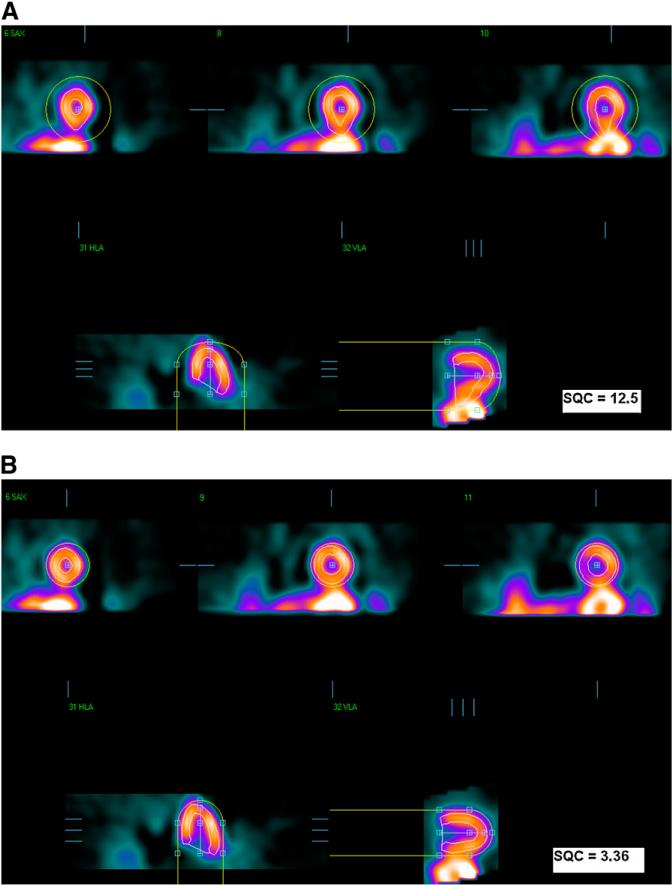
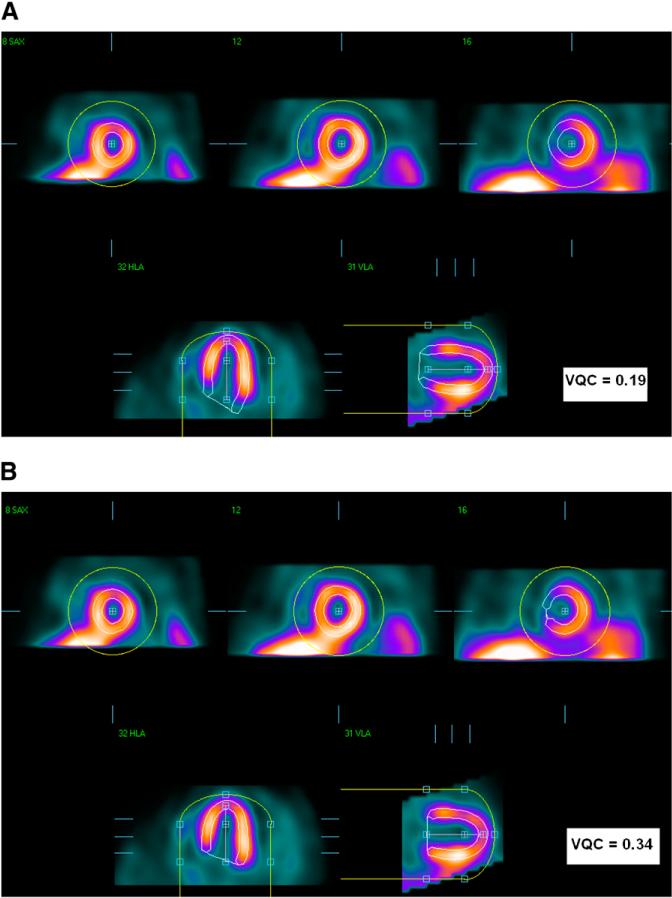
The QGS algorithm was used to segment the left ventricle in each SPECT dataset independently, as previously described (1). QGS operates in 2 steps, by fitting the 3-dimensional ellipsoid model to the left ventricle and then determining the mitral VP position. Therefore, there are 2 main types of possible failures in the QGS segmentation: gross contour failure due to incorrect ellipsoid determination (mask failure) and incorrect positioning of the VP (VP failure). These 2 types of failures can be corrected, in separate steps, by the user manually masking the image to include only the LV region (mask option) or by forcing a specific LV VP position (constrain option). Figure 1 shows the first type of failure (mask failure), which was produced by incorrect ellipsoid determination; correction would require subsequent masking of the image to include only the LV region. This failure could be caused by the presence of substantial hepatic or intestinal uptake close to the left ventricle. Figure 2 shows the second kind of failure (VP failure) in which the LV VP is not found correctly, resulting in contours that are either too short or too long. This kind of failure can be caused by low myocardial photon counting statistics, especially in the basal region. The mistakes in the computer-estimated position of the VP can result in the overestimation or underestimation of the length of the LV axis: VP overshooting (VPO) or VP undershooting (VPU).
FIGURE 1.
Mask-failure case. (A) Failed segmentation results. (B) Correct result after manual changes to initial mask. In each image, top images are in short-axis orientation, and bottom images are in vertical- and horizontal (long)-axis orientation. Yellow circles show initial masks, and LV contours are shown in white.
FIGURE 2.
VP-failure example. (A) VPO segmentation. (B) Correct result after manual changes. In each panel, top images are in short-axis orientation, and bottom images are in vertical- and horizontal (long)-axis orientation. Yellow circles show initial masks, and LV contours are shown in white.
To measure the LV segmentation quality, our automatic quantification method derives 2 parameters. The first QC parameter, shape quality control (SQC), is based mainly on the shape of the left ventricle information and is computed to detect the mask-failure cases. After identifying mask failures, the second parameter, VP QC (VQC), is calculated, based on intensity ratio, to detect the VPO or VPU failures.
Computation of QC Parameters
Shape QC
To quantify the shape of the left ventricle, 8 unique shape parameters were identified to define the SQC, as listed in Table 2 (gated, 8 parameters; nongated, 7 parameters, without stroke volume).
TABLE 2.
Parameters Considered in LV Shape Analysis
| Description | Parameter | Unit |
|---|---|---|
| LV orientation | Long-axis angle (nongated and gated images) | Angle degree |
| Area | Normalized VP area (nongated and gated images) | NA |
| Volume | Normalized volume difference (nongated and gated images) | NA |
| LV volume (nongated)/end-diastolic LV volume (gated) | mL | |
| Stroke volume (gated images only) | mL | |
| Eccentricity | Long-axis eccentricity (nongated and gated images) | NA |
| Short-axis eccentricity (nongated and gated images) | NA | |
| Intensity | Normalized count deviation (nongated and gated images) | NA |
NA = not applicable.
These parameters have different units. To diminish these differences, 8,793 NAC sequential stress gated and nongated scans from our entire nuclear cardiology database were randomly selected on the basis of the random number generator results from the MySQL program and were used to generate the gaussian distribution of each shape parameter used to evaluate the LV segmentation. Because of the large sample size, random selection, and no exclusion of studies, the sample approximates the clinical demographics. Then, the SQC was defined as follows:
| Eq. 1 |
where Pi is any of the shape parameters listed in Table 2, Pa is the average value of the same parameter generated from 8,793 correctly segmented left ventricles, and norm() is the asymmetric gaussian normalization function.
VP QC
To determine the VP position of the left ventricle, a separate parameter was calculated to define VQC as follows:
| Eq. 2 |
where VPC is the image intensity around the VP, LVC is the intensity of the left ventricle, t1=(max(VPC) – min(VPC)) × C1 + min(VPC), t2 = (max(LVC) – min(LVC)) × C2 + min(LVC), and C1 and C2 are constants between 0 and 1, which are set to 0.9 to reduce the influence of hot spots above the 90th percentile, as established experimentally.
If the segmentation results in overshooting the position of the LV VP, the count values around the VP will be much lower than those in the left ventricle, and the VQC values will decrease. When there is undershooting in the LV VP, the minimal intensity around the VP will be close to the intensities of the left ventricle, resulting in a higher VQC value. The sum operators in the VQC computation equation are used to decrease the sensitivity to focal extreme spots with extreme intensity values.
Validation of Computer-Derived Results
Manual QC evaluation of all LV segmentations was performed twice (A1 and A2) by 1 experienced observer, a nuclear medicine technologist, in gray and standard cool color scale with a 2-mo interval between the 2 processing times. Two additional experienced observers, a second nuclear medicine technologist and a nuclear medicine physician (B and C), were also unaware of all QC results and evaluated the contour segmentations in a color-scale display. Quality of the contour detection was classified by these 3 experts into 4 possible categories: successful segmentation (SS), mask failure, VPU, and VPO. A few cases in which a combination of failures occurred—mask failure with VPO or VPU failure—were included in the mask-failure category. To detect these failures, SQC and VQC were computed and compared with the evaluations of the experts.
The following comparisons were made for all datasets: automatic QC versus operator QC by A1, A2, B, and C; automated QC versus the combined QC by A2, B, and C; automated QC versus the combined QC by A1, A2, B, and C; and interobserver and display effect comparisons of manual QC.
Statistical Methods
To evaluate the performance of this new technique, we compared each automated QC measurement with the evaluations of the experts. Analyze-It software within Microsoft Office Excel (version 2.10) was used for all statistical computations. Receiver-operating-characteristic (ROC) curves for the detection of contour failures were analyzed to evaluate the performance for segmentation failure detection (9). The SQC and VQC operating thresholds were obtained individually for each type of dataset and for overall datasets from the respective ROC curves to yield the optimal values, which guarantee a high sensitivity with specificity greater than or equal to 0.9 for SQC and greater than or equal to 0.65 for VQC and which were determined to have a practical application. To compare the differences between the manual evaluations, the χ2 method and Cohen κ-coefficients were applied (10). The Fleiss κ-coefficient was calculated to compare the evaluations of 3 raters (11). In addition, the proportion test was used to compare the agreements for each classification between gated and nongated images in each evaluation.
RESULTS
Visual Evaluation of Contour Failure
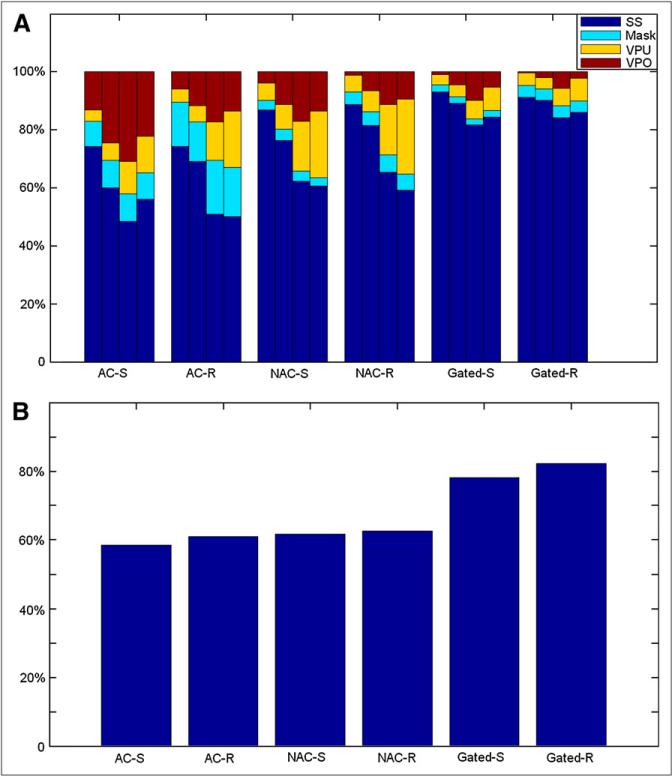
The visual assessment results of the fully automatic LV segmentation in 318 patients with 6 types of datasets (AC-S, AC-R, NAC-S, NAC-R, Gated-S, and Gated-R) are shown in Figure 3.
FIGURE 3.
Results of expert evaluation of contour QC. In each bar group for particular scan type (A), each individual bar depicts findings of individual observers A1, A2, B, and C (from left to right, respectively) regarding contour quality. (B) Overall agreement between 3 observers.
Figure 3A shows that the LV segmentation evaluation in gray-scale display was judged to be successful from 74.2% in AC-S to 93.0% in Gated-S (3 cases without gated-stress datasets). Significant difference was obtained between nongated and gated images (P < 0.0001). The success rates of the LV segmentation presented in color-scale display for A2, B, and C ranged from 60.1%, 48.4%, and 56.0%, respectively, in AC-S to 90.2%, 84.2%, and 86.1%, respectively, in Gated-R (nongated vs. gated, P < 0.0001 [A2]; P < 0.0001 [B] ; and P < 0.0001 [C]). Figure 3A and Supplemental Table 1 also show that there were significant differences for the determination of SS/VPO/VPU in nongated images between observers but not for the determination of mask.
Figure 3B shows the overall agreements, by percentage, within all of the evaluations in each dataset. Figure 3 also demonstrates that there is a significant difference in the evaluation of VP failures between gray scale and color scale (P < 0.0001).
The agreement of the first expert's evaluations in gray (A1) and color (A2) display was analyzed to show the effect of different color scales on the visual determination of contour accuracy. To show interobserver differences, the agreements between any 2 manual evaluations in the color scale (A2, B, or C) were compared. The summary for these comparisons is shown in Supplemental Table 1. In addition, nongated and gated images were compared.
The κ-coefficient for the agreement between A1 and A2 shows that it is within a substantial range. In any comparison of interobserver agreements, κ-coefficients are used to show that agreements between any 2 evaluations are within a reasonable agreement range; the agreement between B and C is almost perfect (κ = 0.80). The Fleiss κ-coefficient is also used to show the agreement among A2, B, and C, which is within a substantial agreement range (κ 5 0.63). The significant differences of agreement proportions between nongated and gated images were obtained in each comparison between any 2 of the observers.
Additionally, we determined that the failure of LV segmentation was not related to the presence or absence of coronary disease (stenosis ≥ 70% confirmed by angiography), transient ischemic dilation, TPD, or LV ejection fraction (LVEF)—with one exception for LVEF in Gated-R, which were correlated with the manual QC evaluation of observer B (P = 0.0073).
To maximize the accuracy of the adjustment by the experts, with the goal of providing a robust reference standard for the software, the disagreement cases in the visual assessment of contours evaluated by all 3 observers (A1 and A2, B, and C) were excluded. After excluding the cases with interobserver discrepancies, 1,277 datasets were available to be considered for further analysis (101 with mask failure and 102 with incorrect VP position).
Mask-Failure Detection (SQC)
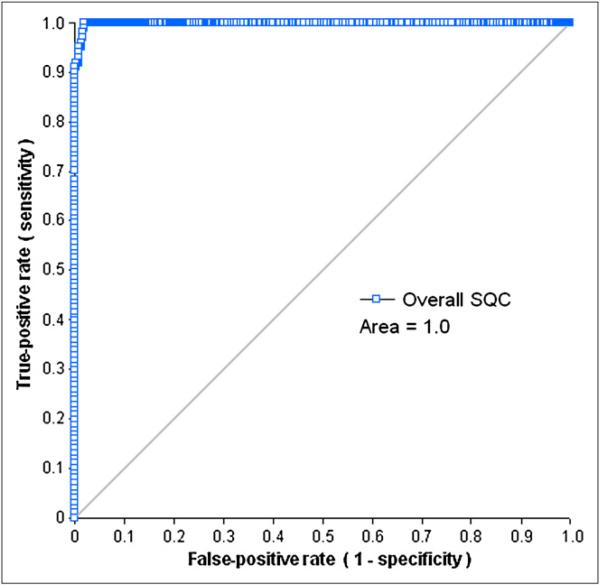
The areas under the ROC curves for the automated detection of SQC for each dataset, using A1, A2, B, or C as a reference, ranged from 0.98 on AC-R images to 1.0 on NAC-S images,from 0.96 on AC-S images to 0.99 on AC-R images, from 0.98 on AC-R images to 0.99 on NAC-S images, and from 0.97 on NAC-R images to 1.0 on NAC-S images, respectively. When the evaluation performed in color scale was selected as a gold standard (A2, B, or C), the areas under the ROC curve for SQC were significantly worse than those generated by the comparison to the A1 evaluation (gray scale) selected as a standard (P = 0.01). Figure 4 shows the ROC performance of the SQC measurement for detection of LV segmentation at the overall dataset, using the combined evaluation (A1&A2&B&C) as a reference.
FIGURE 4.
ROC curves for detection of mask failure by SQC in overall dataset.
To provide robust reference, the consistent cases, which are classified by all 3 observers and by color- and gray-scale interpretation, were used to establish the SQC threshold with considered accuracy (highest sensitivity with specificity ≥ 0.9). The SQC thresholds with optimal sensitivities and specificities for all types of the datasets are shown in Supplemental Table 2.
The ROC analysis of AC images shows that within the 25 mask failures and 124 SSs of AC-S, there were no false-positives and only 2 false-negatives according to the SQC parameter (3.92). In the 39 mask failures and 134 SSs of AC-R, there were no false-positives and only 1 false-negative, according to the SQC parameter (3.83).
Similar to the ROC analysis of the AC images, the ROC result of NAC-S and NAC-R for the consistent cases shows that except for 3 false-negatives among 164 SSs of NAC-S (3.97), there were no false-positives according to the SQC parameters in NAC-S and NAC-R (5.06) and no false-negatives in NAC-R.
Similarly, in nongated image analysis the result for gated SPECT shows that no false-positive cases were found in the 15 mask failures of Gated-S (6.37) and Gated-R (7.11). In addition, no false-negatives were found in the 236 SSs of Gated-S or in the 247 segmentations of Gated-R with corresponding thresholds.
When analyzing all of the image types together, the ROC result for SQC (Fig. 4) illustrates that the area under the ROC curve of SQC was close to 1.0. On the basis of a similar threshold choice strategy for each dataset, the overall SQC threshold was set as 3.83, with a sensitivity of 100% and a specificity of 98%. In 1,074 correct LV segmentations of all 6 datasets, there were 21 cases with a greater SQC value than that of the threshold used to detect mask failures. Of the 101 mask-failure cases in all 6 datasets, none was false-positive.
VP Failure Detection (VQC)
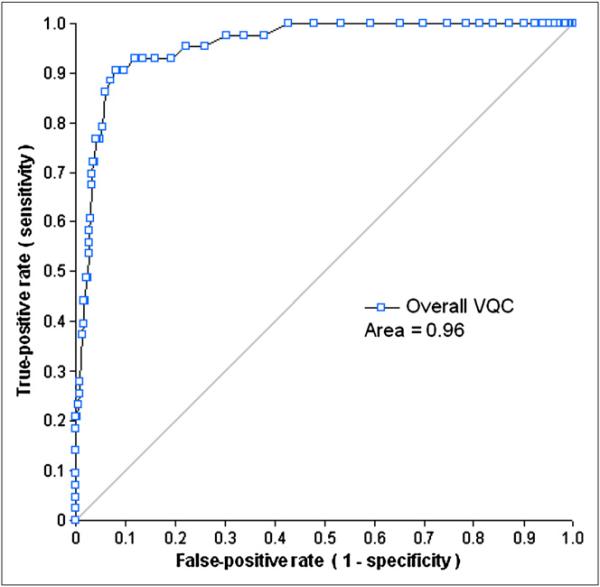
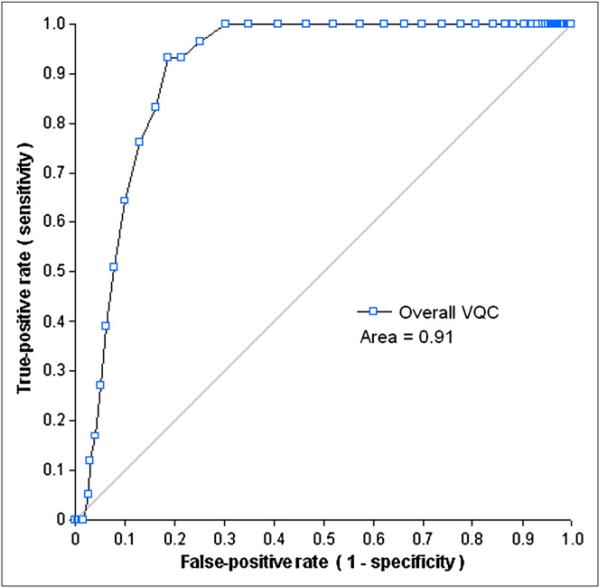
The ROC analysis of the VQC measurement was applied for the detection of LV VP failures of each dataset using A1, A2, B, or C as a gold standard (the ranges for the areas of ROC curves: 0.80–1.0 [A1], 0.71–0.92 [A2], 0.71–0.88 [B], and 0.72–0.88 [C]). When the combined evaluation (A1&A2&B&C) was a gold standard, most of the areas of ROC curves were greater than 0.88, except for the VPO failure in Gated-S (0.73). Similar to the results for SQC, the areas under the ROC curve of VQC for the 6 datasets with their evaluations generated in color scale as gold standards were generally worse than those generated by the analysis with A1 evaluation (VPU, P < 0.001; and VPO, P = 0.03). The areas under ROC curves of VQC with the combined evaluation were higher than those with A1, A2, B, or C evaluation (A1&A2&B&C vs. A1, P = 0.003; A1&A2&B&C vs. A2, P <, 0.0001; A1&A2&B&C vs. B, P < 0.001; and A1&A2&B&C vs. C, P < 0.001). Because there were no scans classified as VPO failure by all of the observers, the VQC data for Gated-R images with the combined evaluation was not obtained. Figures 5 and 6 show the ROC performances of the VQC measurement for the detection of LV VP failures for the overall dataset, with the combined (A1&A2&B&C) evaluation as a gold standard.
FIGURE 5.
ROC curves for detection of VPU failure by VQC in overall dataset.
FIGURE 6.
ROC curves for detection of VPO failure by VQC in overall dataset.
Similarly, in the analysis of mask-failure detection, with the combined evaluation used as a gold standard, the optimal threshold of VQC for each dataset was chosen to obtain the highest possible sensitivity with a preset specificity greater than or equal to 65%, as summarized in Supplemental Table 2. Because there were no VPO-failure cases in the Gated-R group, the threshold of VQC for Gated-R images was not obtained. Supplemental Table 2 shows that all of the VPO failures have smaller VQC (≤0.28), and most of the VPU failures have larger VQC (≥0.37).
After combining all 6 datasets, the areas under the ROC of VQC were 0.96 for the VPU failures and 0.91 for the VPO cases (Figs. 5 and 6). From these ROC curves, the upper threshold for the VQC value was set to 0.37, and the lower threshold for the VQC value, 0.28, was selected using criteria similar to that of the individual dataset analysis. There was only 1 false-positive case in the 43 VPU-failure cases and none in the 59 VPO failures. In the 1,074 correct LV segmentations of all 6 datasets, there were 280 cases with greater VQC values than the threshold to detect VPU failures and 272 cases with smaller VQC values than the threshold to detect VPO failures.
DISCUSSION
Existing methods for the SPECT analysis of perfusion currently require some degree of visual QC and manual adjustments based on expert judgments (1–3). This step introduces undesired inter- and intraobserver variability into otherwise objective quantitative findings. In QGS/QPS software, a manual contour-correction tool is provided to override the results of the automated contour detection of the MPS studies, if required. If the question of whether the contour correction is required in a given study was determined automatically by the computer software, the objectivity of the overall analysis of MPS could be greatly improved by reducing observer influence and variability from the quantitative results. As a preliminary step in this direction, we have developed a tool that automatically identifies LV contour detection failures. In this study, 2 parameters (SQC and VQC) were generated to automatically detect LV segmentation failures by QGS/QPS and compared with manual classifications by the 3 experienced observers. In addition, although the primary objective was to provide the QC of contours for the analysis of myocardial perfusion, we did include QC for the gated contour detection because this could be used as an aid in the detection of the contours for the static images or for the creation of motion-frozen images for the analysis of per-fusion (12). Other types of failures may occur, such as erroneously high or low ejection fraction, because of the incorrect contours. These failures were not studied here for the gated images because they would not significantly affect perfusion measurements and would require an independent standard for the comparison. Such analysis could be an object of another study that focused on the accuracy of functional measurements.
In the case of mask failures detected by SQC, most often caused by the presence of the uptake of other organs, the LV boundaries are usually set outside the myocardium, which results in a physiologically incorrect LV shape. In our study, the SQC included several parameters that described LV shape to detect this type of failure, such as LV orientation, volumetric measurements, area, and eccentricities. The SQC values ranged from 0 to 42 in all cases, with higher values indicating an increasing likelihood of contour failures. The results of the ROC analysis showed that the optimal SQC threshold values for the detection of incorrect contours were specific for each image type. However, all of the SQC thresholds that allowed the user to obtain the optimal sensitivity and specificity were greater than 3.0. Nevertheless, in the overall analysis, when the common threshold of SQC was set at 3.83, the SQC values of all mask-failure cases were greater than or equal to that threshold. On the basis of the same threshold, most of the 1,074 SS cases had smaller SQC values, and only 2.0% of these images had larger SQC values (>3.83), indicating that this threshold is relatively independent of the type of scan (stress, rest, gated, nongated AC, or NAC). In the successfully segmented cases with high SQC values, we observed that some cases had abnormal volumes whereas others had unusual eccentricities, which could be due to the normal shape variations of human hearts.
In the case of incorrect VP positioning detected by the VQC, the most common cause appears to be the low myocardial photon counting statistics in that region due to photon attenuation and decreased wall thickness. Our present method uses the intensity ratio as VQC to evaluate the position of the VP of the left ventricle and seems to agree with the evaluations of the users. Our results show that the areas under the ROC curves for detecting VP failures are greater than 0.85 for 5 of 6 types of the images. The inferiority of the results (ROC, 0.73) for detecting VPO failures in the Gated-S type was most likely due to the small number of subjects in this particular VP-failure group (only 2 VPO failures). However, when all types of studies are considered together, the areas under ROC curves for both VP failures are greater than or equal to 0.91. Therefore, VQC could be a useful parameter for evaluating the VP failures in SPECT images, even though the performance of VQC in the detection of VP failures is lower, in general, than the performance of the SQC in the detection of mask failures. It may simply be inherently more difficult to judge the performance of the VP as reflected in high user variability in the determination of the correct results, which is dependent on experiences of readers and image resolution, shown in Supplemental Table 1 and Figure 3.
Most of the results generated from the ROC analysis based on the manual evaluation in gray scale were shown to be better than those based on the manual evaluation in color scale (P = 0.005). One possible explanation is that the 2 parameters in our method were generated from the original images consisting of pixel-intensity values. Gray and color scales are 2 visualization methods for the original images. Compared with the linear gray scale, color scale provides more visual contrast, which could affect the determination of LV segmentation. Another possibility is that this particular observer performed the usual clinical evaluations in gray scale, and therefore, in this case, the gray-scale evaluations from this observer would be more reliable. Further study may be warranted to determine the optimal type of display for the contour QC.
To our knowledge, although computerized QC techniques were proposed by other investigators for other applications such as emission–transmission misalignment within the MPS-CT system (13), automatic detection of contour failures was not previously described. The current study still has several limitations. First, the SQC includes specific parameters for evaluating mask-failure cases (7 for nongated images, and 8 for gated images). Those parameters might not be able to capture all of the LV shape details. As for VQC, only 1 intensity parameter is used for evaluating the VP-failure cases. Because the intensity could be affected by the degraded image quality due to photon attenuation and basal motion, other useful parameters could be incorporated to improve VP QC. The evaluations of the segmentations of the left ventricle were generated by subjective observers in this study. Perhaps another anatomic modality such as CT or MRI could be used in the future to verify performance of our algorithms (14,15); however, in this study we included evaluations in 2 different color scales and from 3 different observers, which improves the objectivity of visual evaluations. The fact that only 1 type of protocol and camera were involved in our study might have introduced an evaluation bias. No contour quality analyses for motion-frozen (12) or prone images (16) were performed. However, 6 different types of SPECT images were evaluated in this analysis, and common thresholds could be defined, allowing for the automatic determination of the segmentation failures. In this study, we tested our method with only 1 particular algorithm (QGS/QPS, developed by our group). Other segmentation tools (2,3,6,17,18) developed for MPS analysis could also be evaluated in further studies. This method provides a technique to measure the segmentation quality of the left ventricle, which could provide feedback to the user but does not automatically correct the contours. The final goal of this research will be to develop a method for self-correcting LV segmentation based on the QC parameters developed here.
CONCLUSION
A novel method has been developed to evaluate the segmentation of the left ventricle in SPECT images for the gated and nongated stress/rest scans with and without attenuation correction. As judged by the agreement with the visual analysis, this technique operates with excellent sensitivity and a high specificity for incorrect LV shape determination and with a high sensitivity and reasonable specificity for the detection of the incorrect position of the VP. This technique may allow further improvement of automation in the analysis of perfusion by MPS.
Supplementary Material
ACKNOWLEDGMENTS
We thank Gillian Haemer and Sherry Casanova for proofreading the text. This research was supported in part by grant R0HL089765-01 from the National Heart, Lung, and Blood Institute/National Institutes of Health (NHLBI/NIH) (PI: Piotr Slomka). Its contents are solely the responsibility of the authors and do not necessarily represent the official views of the NHLBI.
REFERENCES
- 1.Germano G, Kiat H, Kavanagh PB, et al. Automatic quantification of ejection fraction from gated myocardial perfusion SPECT. J Nucl Med. 1995;36:2138–2147. [PubMed] [Google Scholar]
- 2.Ficaro EP, Lee BC, Kritzman JN, Corbett JR. Corridor4DM: the Michigan method for quantitative nuclear cardiology. J Nucl Cardiol. 2007;14:455–465. doi: 10.1016/j.nuclcard.2007.06.006. [DOI] [PubMed] [Google Scholar]
- 3.Faber TL, Cooke CD, Folks RD, et al. Left ventricular function and perfusion from gated SPECT perfusion images: an integrated method. J Nucl Med. 1999;40:650–659. [PubMed] [Google Scholar]
- 4.Lum DP, Coel MN. Comparison of automatic quantification software for the measurement of ventricular volume and ejection fraction in gated myocardial perfusion SPECT. Nucl Med Commun. 2003;24:259–266. doi: 10.1097/00006231-200303000-00005. [DOI] [PubMed] [Google Scholar]
- 5.Germano G, Kavanagh PB, Su HT, et al. Automatic reorientation of three-dimensional, transaxial myocardial perfusion SPECT images. J Nucl Med. 1995;36:1107–1114. [PubMed] [Google Scholar]
- 6.Wolak A, Slomka PJ, Fish MB, et al. Quantitative myocardial-perfusion SPECT: comparison of three state-of-the-art software packages. J Nucl Cardiol. 2008;15:27–34. doi: 10.1016/j.nuclcard.2007.09.020. [DOI] [PubMed] [Google Scholar]
- 7.Germano G, Berman DS. Clinical Gated Cardiac SPECT. 2nd ed. Blackwell Publishing; Malden, MA: 2006. [Google Scholar]
- 8.Slomka PJ, Fish MB, Lorenzo S, et al. Simplified normal limits and automated quantitative assessment for attenuation-corrected myocardial perfusion SPECT. J Nucl Cardiol. 2006;13:642–651. doi: 10.1016/j.nuclcard.2006.06.131. [DOI] [PubMed] [Google Scholar]
- 9.Hanley JA, McNeil BJ. The meaning and use of the area under a receiver operating characteristic (ROC) curve. Radiology. 1982;143:29–36. doi: 10.1148/radiology.143.1.7063747. [DOI] [PubMed] [Google Scholar]
- 10.Cohen J. A coefficient of agreement for nominal scales. Educ Psychol Meas. 1960;20:37–46. [Google Scholar]
- 11.Fleiss JL. Measuring nominal scale agreement among many raters. Psychol Bull. 1971;76:378–382. [Google Scholar]
- 12.Slomka PJ, Nishina H, Berman DS, et al. “Motion-frozen” display and quantification of myocardial perfusion. J Nucl Med. 2004;45:1128–1134. [PubMed] [Google Scholar]
- 13.Chen J, Caputlu-Wilson SF, Shi H, Galt JR, Faber TL, Garcia EV. Automated quality control of emission-transmission misalignment for attenuation correction in myocardial perfusion imaging with SPECT-CT systems. J Nucl Cardiol. 2006;13:43–49. doi: 10.1016/j.nuclcard.2005.11.007. [DOI] [PubMed] [Google Scholar]
- 14.Schaefer WM, Lipke CS, Standke D, et al. Quantification of left ventricular volumes and ejection fraction from gated 99mTc-MIBI SPECT: MRI validation and comparison of the Emory Cardiac Tool Box with QGS and 4D-MSPECT. J Nucl Med. 2005;46:1256–1263. [PubMed] [Google Scholar]
- 15.Chander A, Brenner M, Lautamaki R, Voicu C, Merrill J, Bengel FM. Comparison of measures of left ventricular function from electrocardiographically gated 82Rb PET with contrast-enhanced CT ventriculography: a hybrid PET/CT analysis. J Nucl Med. 2008;49:1643–1650. doi: 10.2967/jnumed.108.053819. [DOI] [PubMed] [Google Scholar]
- 16.Nishina H, Slomka PJ, Abidov A, et al. Combined supine and prone quantitative myocardial perfusion SPECT: method development and clinical validation in patients with no known coronary artery disease. J Nucl Med. 2006;47:51–58. [PubMed] [Google Scholar]
- 17.Lomsky M, Richter J, Johansson L, et al. A new automated method for analysis of gated-SPECT images based on a three-dimensional heart shaped model. Clin Physiol Funct Imaging. 2005;25:234–240. doi: 10.1111/j.1475-097X.2005.00619.x. [DOI] [PubMed] [Google Scholar]
- 18.Liu YH, Sinusas AJ, DeMan P, Zaret BL, Wackers FJ. Quantification of SPECT myocardial perfusion images: methodology and validation of the Yale-CQ method. J Nucl Cardiol. 1999;6:190–204. doi: 10.1016/s1071-3581(99)90080-6. [DOI] [PubMed] [Google Scholar]
Associated Data
This section collects any data citations, data availability statements, or supplementary materials included in this article.


