1. Introduction
The development of nonlinear optical (NLO) materials has been driven by a multitude of important technological applications that can be realized if suitable materials are available 1–15. Future generations of optoelectronic devices for telecommunications, information storage, optical switching, and signal processing are predicted to a large degree on the development of materials with exceptional NLO responses 1–15. A large number of organic π-conjugated molecules have been investigated in the last thirty years for suitability to function as components in hypothetical NLO materials 1–19. Several books and reviews have appeared dealing with theory of nonlinear optics and the structural characteristics and applications of nonlinear optical molecules and materials 1–19. Truly, all-optical NLO effects were not discovered until the discovery of lasers. Second-harmonic generation (SHG) was first observed in a single crystal of quartz by Franken et.al. 20 in 1961. Parametric amplification was observed in lithium niobate (LiNbO3) by two-wave mixing in temperature-tuned single crystals 21. Rentzepis and Pao 22 made the first observation of SHG in an organic material, benzpyrene, in 1964. Heilmeir examined hexamethylenetetramine single crystal SHG in the same year 24. Two other organic materials followed rapidly: hippuric acid and benzil 25. Benzil was the first material that proved relatively easy to grow into large single crystals. Over the last two decades the study of nonlinear optical process in organic and polymer systems has enjoyed rapid and sustained growth 1–19, 25–39. One indication of the growth is the increase in the number of articles published in refereed society journals, as one can find from web of science 25, SCIFINDER 26 and Scopus 27 search. The four years period 1980–1983 saw the publication of 124 such articles. In the next four years period 1984–1987, the production of articles increased to 736 (nearly six times). From 1988–1992, the number of articles increased to more than 4000 25–27. In the last decade, academia, industry and government laboratories have been working in this field to replace electronics by photonics and as a result, the number of publications has reached more than 70,000 25–27.
The rapid growth of the field is mainly due to the technological promise of these materials 1–19, 28–37. Traditionally, the materials used to measure second-order NLO behavior were inorganic crystals, such as lithium niobate (LiNbO3) and potassium dihydrogen phosphate (KDP). The optical nonlinearity in these materials is to a large extent caused by the nuclear displacement in an applied electric field, and to a smaller extent by the movement of the electrons 1–10. This limits the bandwidth of the modulator. Organic materials have a number of advantages over inorganic materials for NLO applications 28–35. The ease of modification of organic molecular structures makes it possible to synthesize tailor-made molecules and to fine-tune the properties for the desired application 28–35. Unfortunately, not all organic materials display second-order NLO properties. At the molecular level, they need to be non-centrosymmetric. A large number of organic π-conjugated molecules have been investigated 1–9, 28–35 in the last twenty years. The outcome of the results has helped to establish certain guidelines for molecular design to get good second order NLO materials. However, roughly more than 80% of all π-conjugated organic molecules crystallize in centro-symmetric space groups 1–19, therefore producing materials with no second order bulk susceptibility. To overcome this limitation, organic NLO material doped or covalently attached in polymers, have been introduced by Dalton et. al 5,6,16,38–39. A few of these chromophores have served as components of functioning polymer-based optoelectronic devices; the physical properties of all these prototype materials possess one or more critical deficiencies that render commercialization of these systems impractical 28–39. These facts suggest that new types of molecular design are necessary if significant advances are to be realized.
From 1998 onwards, researchers started effort on developing various nanomaterials, with high second order NLO properties and seeking for their applications in photonics as well as chemical and biological detection 40–106. The surface-enhanced phenomenon is predicted to have a particularly important impact in nonlinear optical NLO applications, since the generally weak nonlinear effects can be significantly increased via strong electromagnetic fields at the surfaces of metallic nanostructures 60–129. NLO based sensing have provided great potentials and opportunities for detecting different environmental toxins that exhibit some specific advantages, compared to other conventional and nanomaterial based techniques. Aim of this review is mainly to summarize and evaluate the achievements in development of nanoparticle based second order NLO materials with different sizes and shapes and it will focus on the following three major issues: (i) design of novel NLO active materials using nanoparticles (ii) nonlinear optical properties of single nanoparticle, nanoparticle aggregates and self assembly, and (iii) applications in chemical and biological sensing.
2. Brief Survey of Nonlinear Optics
Nonlinear optics deals with the interaction of applied electromagnetic fields in various materials, which generate new electromagnetic fields and altered in frequency, phase, or other physical properties 1–18. When a material is subjected to an oscillating external electric field of light, the effect of a light wave is usually described through the induced electrical polarization P 1–20. In the case of an isolated chromophore, in the presence of relatively weak electromagnetic field, this polarization is proportional to the strength of the applied field 1–20.
| (1) |
Where, αij is the ij component of the polarizability tensor α and Ej is the electric field component and the j axis. Thus, the plot of the polarization as a function of the applied field is a straight line, whose slope is the polarizabilty, αij. So when a weak optical field of a particular frequency interacts with a material, the material exhibits a time varying polarization response which creates a new field that is of the same frequency. Only the propagating wave is usually phase-shifted in time with respect to the incident field, which is proportional to the index of refraction, η, of the material. However, when a molecule is subjected to a laser light (very high intensity electric field), its polarizability change can be driven beyond the normal regime. Therefore, on the single molecule level, the polarization, which is a function of the applied field, leads to nonlinear effect and can be expressed as 1–19,130–153,
| (2) |
where βijk is the ijkth component of molecular hyperpolarizability (second-order effect) and γijkl is the ijkl component of the second molecular hyperpolarizability (third-order effect). Using Einstein convention, repeated indices are summed with i, j and k, spanning the three directions of space. It will be more convenient if we choose a Cartesian framework with axis x, y and z, adapted to the symmetry of the molecule which helps reveal a reduction of the number of independent coefficients in the expansion. Typical α’s are in the order of 10−24 esu, values of β’s are in the order of 10−30 esu (esu unit means that the dimensions are in CGS units and the charge is in electrostatic units, thus “β in esu” means β in the units of cm3 esu3/erg2), γ’s are in the order of 10−36 esu. For non-centrosymmetric molecule without any permanent dipole (molecule with D2, D3h, C3h, Td symmetry), multipole concept has recently been introduced by Zyss et. al 2,8 for the design of more isotropic NLO chromophores. According to the multipole concept 2,8, in the absence of pseudo-tensorial J=0 and J=2 (monopolar and quadrupolar) terms due to the resonnace, the hyperpolarizability tensor can be decomposed into two components βJ=1 and βJ=3, resulting from dipolar and octupolar contributions.
| (3) |
As a result, though there is no permanent dipole moment for octupolar molecules, due to the symmetry constraints of octupolar groups, octupolar molecules do present an isotropic β tensor.
Polarizability and hyperpolarizabilities, α, β and γ are second-rank, third-rank and fourth- tensors and as result, they have 9, 27, and 81 components 1–18. However, under off-resonant conditions, Kleinmann symmetry is obeyed and geometrical symmetries may further reduce the number of independent nonzero components. For example, molecule has C2v symmetry has only few nonzero elements in the hyperpolarizability tensor and those are βzzz, βzxx and βxzx = βxxz. Where as for C3 molecule, the only nonvanishing tensor elements are: βzzz and βzxx = βzyy = βxxz = βyyz = βxzx = βyzy in the molecular frame (x, y, z), where the z axis is the symmetry axis 1–18. The hyperpolarizability tensor described above is in the molecular frame. To obtain the hyperpolarizability tensor in the laboratory frame (X, Y, Z), one needs to use the following expression 1–18
| (4) |
where T is the transfer matrix corresponding to Euler angles as displayed.
Till 1991, electric-field-induced second-harmonic generation (EFISHG) 142 was the main method for the measurement of β of organic molecules in solution. EFISHG relies on a strong electric field to break the centrosymmetry of the solution. As a result, it is only limited to molecules with dipolar symmetry. Due to the lack of permanent dipole-moment, first molecular hyperpolarizabilities of nanomaterials described in this review can’t be measured using EFISHG technique. The hyper-Rayleigh scattering (HRS) technique 144–150 is as an alternative method for the measurement of molecular hyperpolarizabilities. Unlike EFISHG, HRS can be used to directly measure β of all molecules, irrespective of symmetry or charge. As a result, HRS technique has been used for the measurement of β’s of nanomaterials. The intensity of the light scattered by a single molecule at the harmonic wavelength 2ω can be calculated by performing an orientational average over β 144–150,
| (5) |
The brackets indicate orientational averaging. As is the case for linear Rayleigh scattering, the intensity of the scattered harmonic is inversely proportional to the fourth power of the fundamental wavelength λ and to the square of the distance to the scattering molecule r. The relation between 〈βHRS2〉 and the components of the molecular hyperpolarizability tensor depends on several factors and these are the polarization state of the fundamental and harmonic beams, the experimental geometry, and the molecular symmetry. If the molecules have no absorption at either fundamental or harmonic wavelength, the components of the hyperpolarizability tensor are real quantities. If the fundamental and harmonic frequencies are far from material resonance frequencies, Kleinman's symmetry condition βijk = βkij = βjki applies. In HRS experiment 144–150 one measures average β2 for any molecule, where,
| (6) |
The first subscript (X or Z) refers to the polarization direction of the frequency-doubled light. If both polarizations are detected with equal sensitivity then both terms dominated in Equation 6. The relation between <βZZZ2> in laboratory coordinates and <βzzz2> in the molecular reference frame has been discussed in detail by Cyvin et al 148, Bershon et. al. 149 and Clays et. al 144–146 and the relation can be expressed as
| (7) |
| (8) |
Here, cyc means cyclic permutation of co-ordinate indexes. Now if we impose molecular symmetry, for the molecules of different symmetry, the following expression should be used for the measurement of different β components 2,8,144–150.
| (9) |
| (10) |
| (11) |
| (12) |
| (13) |
With increasing field strengths, nonlinear effects become more important due to the higher powers of the field E. Since α is much greater than β and γ, NLO effects were not commonly observed before the invention of lasers 1–18. For the electric field of Q-switched YAG laser light, ~ 104 stat volts/cm, the contribution to P from βE2 is 10−4 (D). These polarizations are infinitesimal on the scale of chemical thinking. Yet, these small polarizations are responsible for the exotic effects described throughout this review. For a macroscopic system, total polarization (P) can be written as 1–18,
| (14) |
where χijk(2) and χijkl(3) denote the first and second nonlinear susceptibilities. Here, time-varying nonlinear polarization effects give rise to new fields of altered frequency with respect to the incident radiation, and as a result, one can observe SHG in the case of χijk(2) and third harmonic generation (THG) in the case of χijkl(3). In addition to frequency alteration, first nonlinear susceptibility, χijk(2), gives rise to an electric field dependent effective susceptibility, which is responsible for the linear electro-optic effect. In a bulk material, an overall non-centrosymmetry imposes the requirement of molecular alignment in order to achieve a finite macroscopic second-order nonlinear optical activity. In bulk material, χzzz(2)(ω) is related to the molecular parameters by 1–18,
| (15) |
where N (molecules/cm3) denotes the number density of active molecules that interact with the incident optical field, βzzz is the hyperpolarizability tensor element coincident with the molecular symmetry axis, ω is the wavelength of the incident light field, and ε is the dielectric permittivity of the electro-optic (EO) material, ε. The 〈cos3 θ〉 term is the average molecular order parameter indicating the extent of chromophore alignment relative to the laboratory z axis, which is parallel to the applied poling field. The quantity g(ω) is the Lorentz–Onsager local field factor 1–18. The linear Pockels EO effect tensor, r33, is related to χzzz(2)(ω) by 1–18
| (16) |
where η is the refractive index of the EO material.
Though among all nonlinear optical phenomena, SHG is the simplest, it is also forbidden within the electric dipole approximation in centrosymmetrical molecule or materials. The response of centrosymmetric molecules to an external field is given by P (− E) = − P (E). This relation expresses the requirement that the induced polarization of centrosymmetric molecules is opposite and of equal magnitude when the field is reversed. In order for the equation (2) to satisfy this condition, all coefficients of even powers of E (β, δ…) have to be equal to zero. Hence, only non-centrosymmetric molecules have a non-zero β value, since then P (− E) ≠ − P (E). The requirement of non-centrosymmetry is not restricted to the molecular level, but also applies to the macroscopic nonlinear susceptibility, χ (2), which means that the NLO molecules have to be organized in a non-centrosymmetric alignment. For nano sized noble metal structures, if these structures also possess centrosymmetrical shapes (spherical or rod), the surface SHG response will again vanish in the electric dipole approximation 40–75. Recently, several experimental results on spherical such as gold, silver and copper, exhibit enormous SHG responses, showing their potential to be excellent NLO candidates 40–75. For spherical metallic nanoparticles that are small compared to the wavelength of light, several theories of SHG response have been developed, including work by Agarwal and Jha 40, Hua and Gersten 41 and Dadap, Shan, Eisenthal, and Heinz (DSEH) 42. Dadap et al., 42,52 reported that in case of second harmonic scattering from a sphere of centrosymmetric material, though the overall response vanishes in the electric dipole approximation owing to the presence of inversion symmetry, huge SHG response due to the leading emission terms is from non-locally excited electric-dipole contribution and a locally excited electric-quadrupole contribution. Contributions involving quadrupolar surface plasmon polaritons associated with retardation effects either at the excitation or the radiation stage are therefore expected to be responsible for nonlocal nonlinear effect. According to the DSEH 42, 52 theory, SHG arises from an induced electric dipole moment (P) and an induced vector quadrupole moment, Q(nˆ). Hyper Rayleigh scattering power P2ω radiated between Ω and Ω + dΩ, where Ω is the solid angle, is given by 42,52,49,
| (17) |
where P and Q are the effective electric dipole and quadrupole moments, respectively. The exact angular dependence of the HRS power radiated is thus a function of the competition between two contributions, namely the effective electric dipole and quadrupole p and Q. Several experimental results 48–75 have demonstrated that the total HRS response is of electric dipole nature for small particles; however, for larger particles, retardation effects in the electromagnetic fields must be considered, and a non negligible quadrupolar contribution is observed. Furthermore, it has been shown that there is huge influence of the fundamental wavelength used in HRS experiments on the weight of the electric-dipolar and quadrupolar contributions 48–75.
3. Scope of this Review
Since last three decades, there is great scientific and technology-driven interest in developing high-performance organic electro-optic materials 1–18, 28–39. In the last twenty-five years, a large series of organic chromophore families have been developed, with very large hyperpolarizabilities 1–18.28–39. The structural features necessary to produce a significant second order NLO response at the molecular level are now quite well-known 1–18.28–39. If these organic chromophores could be incorporated into perfectly ordered non-centrosymmetric lattices, electro-optic coefficients of many hundreds of picometers per volt must be anticipated 1–18, 28–39. Organic materials exhibiting such large macroscopic optical nonlinearity should have a dramatic effect on communication and electromagnetic field sensing technologies 1–18, 28–39. However, in the process of device development, materials based on well-designed chromophores having large dipole-moment and excellent molecular hyperpolarizabilities often failed to provide expected EO response 1–18.28–39. Efforts to obtain organic materials exhibiting large EO coefficients and which can be used to fabricate devices have largely been proven unsuccessful 1–18,28–39. To achieve high EO efficiency, an organic material must be comprised of nonlinear optical NLO chromophores with a large first hyperpolarizability (β) and must be arranged non-centrosymmetrically. However, efficient arrangement of NLO chromophores has been proven to be challenging 28–39. Organic NLO chromophores demonstrating high β values typically have very large dipole moments. Due to strong dipolar forces, they tend to align in an antiparallel fashion, and as a result, the macroscopic EO effect diminishes. The intermolecular interactions are sufficiently strong enough to change the optical properties of the aggregates significantly than the corresponding monomer 1–18.28–39. Many aggregates contain a large number of randomly or semi-randomly positioned monomers encompassing a wide variety of different local interaction geometries. As a result, it is challenging to understand the role intermolecular interaction on linear and NLO properties of the aggregates 1–18.28–39. Therefore, several factors such as interchromophore electrostatic (dipolar) interactions, guest–host incompatibility, and chromophore shape have impacted them for real life application as electro-optic devices 1–18.28–39. Thus, the challenges in molecular EO materials not only involve developing novel constituent chromophore molecules with large intrinsic response properties but also in devising strategies to organize them in acentric microstructures 28–39. Since last couple of years, several groups have been concentrating on designing multichromophoric molecules or self-assembly, where dipolar interactions can lead to self-organization in multichromophoric bundles resulting in higher figures of merit for EO modulation 28–39,130–144. All the experimental results reported show a unique way to optimally tune the dipole moment that interplay between through-bond intramolecular charge transfer (ICT) and through-space ICT processes gives rise to large quadratic hyperpolarizability values. Those result also predicted that there is a failure of simple tensorial additivity models. As a result, a more sophisticated treatment that incorporates through-space polarization effects must be developed.
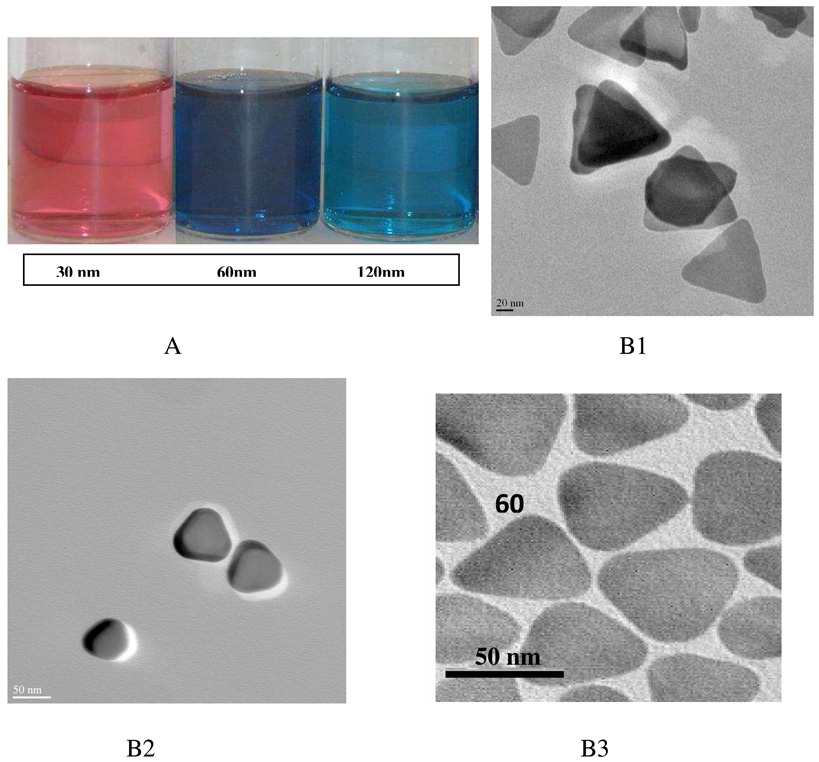
NLO properties of nanostructured materials 40–95, which are drastically influenced by quantum confinement effect, can be promising for applications in optoelectronics. Noble metal nanostructures attract much interest because of their unique size or shape dependent properties (as shown in Figure 1–3), including large optical field enhancements resulting in the strong scattering and absorption of light 96–119. In semiconductors, size and shape dependent properties are due to the confinement of the electronic motion to a length scale that is comparable to or smaller than the length scale characterizing the electronic motion in bulk semiconducting material 82–95. In case of noble metals, as the size is reduced to tens of nanometers scale, a new very strong absorption is observed, resulting from the collective oscillation of the electrons in the conduction band from one surface of the particle to the other (as shown in Figure 1–3) 40–80.
Figure 1.
Photograph showing gold nanoparticles of different sizes (reprinted with permission from Ref. 75, Copyright 2009, Willey- VCH)
Figure 3.
A) Photographic images, B1–B3) TEM pictures of silver nanoprisms of different sizes (30 nm, 60 nm and 120 nm edge length) (reprinted with permission from Ref. 157, Copyright 2009, Elsivier).
This oscillation has a frequency that absorbs the visible light. This is called the surface plasmon absorption 96–110. This strong absorption, giving rise to vivid characteristic color, has been observed even at 17th century, throughout Europe in stained glass windows of cathedrals and by the Chinese in colored vases. Due to the presence of this surface plasmon (SP) resonances, weak nonlinear effects generally significantly enhances via strong electromagnetic (plasmon) fields at the surfaces of metallic nanostructures96–120. This, together with our ability to make nanomaterials of different sizes and shapes (as shown in Figure 1–3), makes them potentially useful in the field of NLO 43–72. In the past one decade, scientists have witnessed an exponential growth of activities on NLO properties of self assembly and nanomaterials 28–95 worldwide, driven by the excitement of understanding new science and potential hope for applications in daily life as optical devices, photonic circuits, and environmental sensor as well as in medical diagnostics. Intense research has been fueled by the need for practical optical device that can address the deficiencies of conventional technologies 1–19. Over the past decade, about one hundred research papers on microscopic and macroscopic NLO properties of nanomaterials, and sensors based on NLO behavior of nanomaterials have been published 28–95. Several publications have shown that SHG can be greatly enhanced (~104) for molecules on a roughened versus an unroughened metal surface, which is comparable with very large enhancements (~106) similar to enhancements observed in surface enhanced Raman scattering (SERS) from organic dyes on colloidal solution 43–72. The resulting materials could have very high bulk second order NLO values well beyond those available today, which in turn would enable optical switches and modulators of smaller dimensions than what is currently available 120–150, while at the same time substantially reducing the cost of fabrication of EO devices. This review is mainly focused on recent advances in size and shape dependent second order NLO properties of nanomaterials and understanding new science behind the extraordinary NLO values of nanomaterials. It also discusses about the development of nanomaterial based optical technology.
The ability to integrate metal nanoparticles into biological systems has had greatest impact in biology and biomedicine 95–119. Development of nanobased biosensors has increased tremendously over the past few years as demonstrated by the large number of scientific publications in this area. The emerging ability to control the patterns of matter on the nanometer length scale can be expected to lead to entirely new types of biological sensors 90–129. These new systems will be capable of sensing at the single-molecule level in living cells, and capable of parallel integration for the detection of multiple signals, enabling a diversity of simultaneous experiments, as well as better crosschecks and controls. Since last three years, publications from several groups demonstrated that size and shape dependent nonlinear optical NLO properties of nanomaterials can be used for biological and chemical sensing with excellent detection limit and selectivity 46,58–63, 67–68, 75, 81. In this review, we will discuss recent efforts on the development of a nanomaterials based second order NLO assay for understanding chemical processes and sensing of biomolecules and toxic metals, which can improve the analytical figures of merit, such as detection limits, sensitivity, selectivity, and dynamic range, relative to the commercial systems. Finally, we will discuss problems and challenges in this assay for chemical and biological sensing.
4. NLO Properties of Nanomaterials
Low dimensional structures such as nanoparticles and nanostructured materials have attracted great interest in recent years because their properties such as quantum confinement of electrons and holes, surface effects, and geometrical confinement of phonons, are markedly different from those of bulk materials 40–129. As a result, one can use materials with already desirable bulk properties and improve or tailor these properties by a judicious control of size and surface 40–129. Nanoparticle has a rather large number of atoms, but its size is comparable with characteristic dimensions describing the behavior of electrons and holes, thus creating an intermediate regime between molecules and bulk crystals 40–129. A great deal of the recent interest in the optical responses of metal nanoparticles, nanoapertures in metal films, and metamaterials are focuses on enhancing local electromagnetic fields to facilitate light–matter interactions 40–70. Random and fractal metal clusters have been predicted to lead to giant enhancements of the local electric field. Enormous enhancement factors of 103–106 compared to the fundamental electric field at a flat metal surface have been predicted 40–70 and these strong local fields are particularly important for nonlinear optical processes, such as SHG. Since last decade, scientists are exploring size and shape dependent nonlinear optical properties of nanomaterials 40–95 driven by the excitement of understanding new science and potential hope for applications in daily life devices. In this section of current review, we will give an overview of size and shape dependent NLO properties of nanomaterials and understanding the origin of the size dependent NLO properties of nanomaterials 40–95.
4.1 Size and Shape Dependent NLO Properties of Gold and Silver Nanoparticles
Since last two decades, the interest in gold and silver metallic particles has dramatically increased, mostly because of their unique optical and electronic properties. These unique properties are mainly due to the collective excitation of the conduction band electrons known as the surface plasmon resonance (SPR) 45–70. These properties are often investigated by linear optical methods. Since last decade, nonlinear optical methods have been successfully used. This is due to the large enhancements expected for the electromagnetic fields through the SPR. Due to the lack of good dipole-moment, for the measurement of first hyperpolarizabilities of nanoparticles dispersed in a liquid solution, a method of choice is HRS 145–152. The intensity of the single photon light scattering or Rayleigh scattering is linearly dependent on the number density and the impinging laser intensity, and quadratically on the linear polarizability α 1–10. Linear Rayleigh scattering can be observed due to fluctuations in number density, caused by translational fluctuations. On the other hand, the two-photon light scattering or hyper–Rayleigh scattering can be observed from fluctuations in symmetry, caused by rotational fluctuations 145–152. Second–order nonlinear light scattering 147–149 or the HRS technique was discovered only after the advent of reliable, electro-optically Q-switched Nd3+-YAG laser. Clays et. al. 145 reinvented this technique to measure the hyperpolarizabilities of molecules in solution. The technique is both experimentally and theoretically much simpler and more widely applicable, and quickly became the technique of choice for the determination of the first hyperpolarizabilities of a wealth of newly designed and synthesized chromophores 46,59,63,67,71,75,151–153. As we discussed in section 2, the relation between 〈βHRS2〉 and the components of the molecular hyperpolarizability tensor highly depends on the molecular symmetry. Since the actual symmetry of different nanoparticles whose first hyperpolarizabilities are reported are not known, in this review all the reported β values are <β>. For nanoparticle based SHG measurement, SPR enhancement can be obtained at the fundamental or the harmonic frequency yielding more versatility, although SPR enhancement at the fundamental frequency is usually avoided in order to preserve the sample solution from degradation. Due to the SPR properties, large magnitudes for the hyperpolarizability tensor of silver and gold nanoparticles have been reported 40–73. However, according to the electric dipole approximation, for perfectly spherical metallic nanoparticles that are small compared to the wavelength of light, no HRS signal intensity should be collected owing to the centrosymmetry of both the material crystal structure and the shape of the particle 40–73. This paradox has been solved for metallic gold particles. Indeed, it has been demonstrated that the frequency conversion process finds its origin at the surface of the particles when the shape of the particles are not perfectly spherical. As a consequence, the total HRS response is of electric dipole nature for small particles; however, for larger particles, retardation effects in the electromagnetic fields must be considered, and a non negligible quadrupolar contribution is observed 49–60. It has been demonstrated that a similar origin for the HRS process occurs for silver particles. In this section of this current review, we will give an overview of recent major advances in the design of NLO activity from noble metal nanoparticles. An understanding of the origin of NLO response will be discussed, which is of fundamental scientific interest as well as a crucial component in the development of state-of-the-art NLO materials.
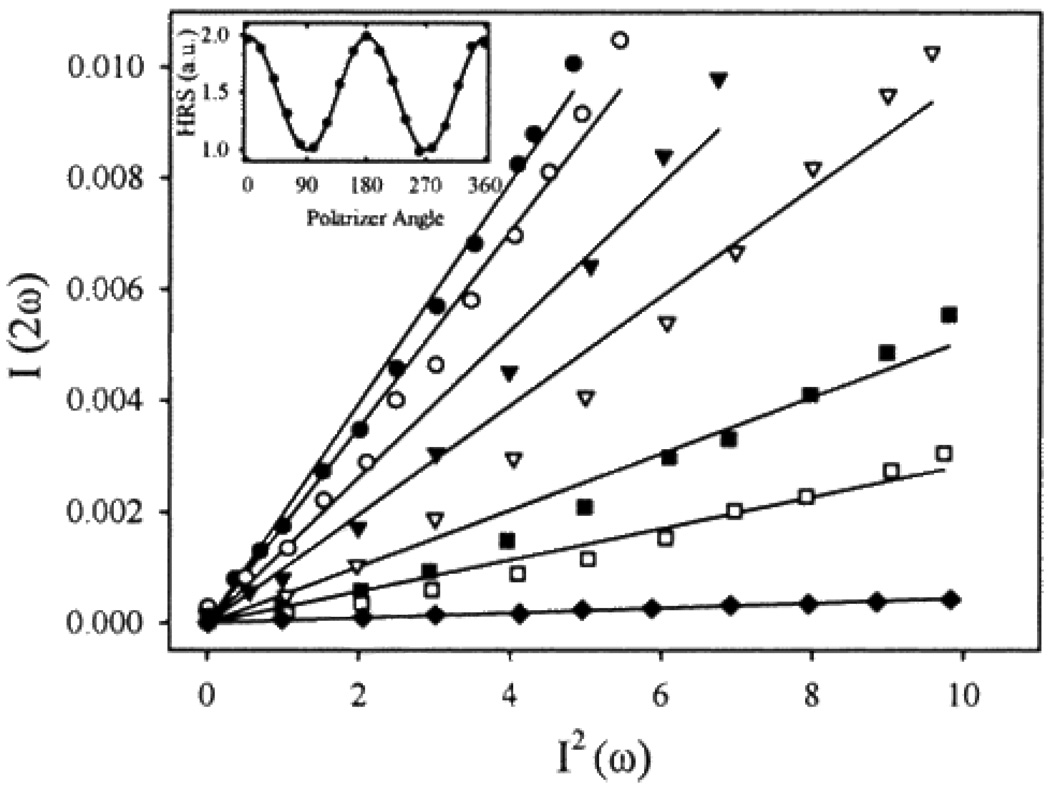
One of the first predictions on surface contributions to SHG came from Agarwaal and Jha 40. Using a simplified Mie theory, they predicted that for metal spheres of radius, d, surface contributions to SHG will be very important, if d < λ/2, where λ is the excitation wavelength. Later, Hua and Gersten 41 used Green function formalism to calculate the cross-section for SHG. Their theoretical prediction reported that for Al and Ag spheres, quadrupolar contribution becomes significant, when their diameter is larger than 30 nm. Their calculation predicted that a small metal sphere interacting with an incident electromagnetic wave would produce second harmonic radiation in a quadrupolar mode. Experimentally, first demonstration came from Vance et, al 43, who reported large second-order nonlinearity in medium-sized Au nanoparticles using 800 nm incident light. Their experimental results have shown that nanoscale particles are remarkably efficient scatterers (as shown in Figure 4). When they evaluated first hyperpolarizability for gold nanoparticles, it was much higher than the first hyperpolarizability of best available molecular chromophores. Moreover, their experiments indicate that <β> is highly sensitive to colloid aggregation and imply that HRS is an effective tool for the characterization of symmetry-reducing perturbations of nanoscale interfaces.
Figure 4.
Power dependence of hyper-Rayleigh scattering, I(2ω), vs. incident intensity squared, I2(ω), for various concentrations of Au: (·) 2.1 × 1017cm−3; (○) 8.4 × 1016cm−3; (▼) 4.2 × 1016cm−3; (▼) 2.1 × 1016cm−3; (▪) 8.4 × 1015cm−3; (□) 4.2 × 1015cm−3; (♦) water. Inset shows results of rotating a polarizer in front of the detector (reprinted with permission from Ref. 43, Copyright 1998, American Chemical Society).
As a comparison, their results demonstrated that the frequency-doubling efficiency per atom of colloidal gold is 106–107 higher than best organic NLO chromophore. With the theoretical background 40–42, 52 as we discussed before, they explained the large hyperpolarizabilities of the noble metal nanoparticles as due to the resonance enhancement via their SP absorption bands. In a subsequent paper 49, they performed some very interesting “slit” experiments with 32 nm Ag nanoparticles and demonstrated that the HRS intensities measured with 800 nm excitation are aided by the electric dipole as well as by electric quadrupole plasmon resonances.
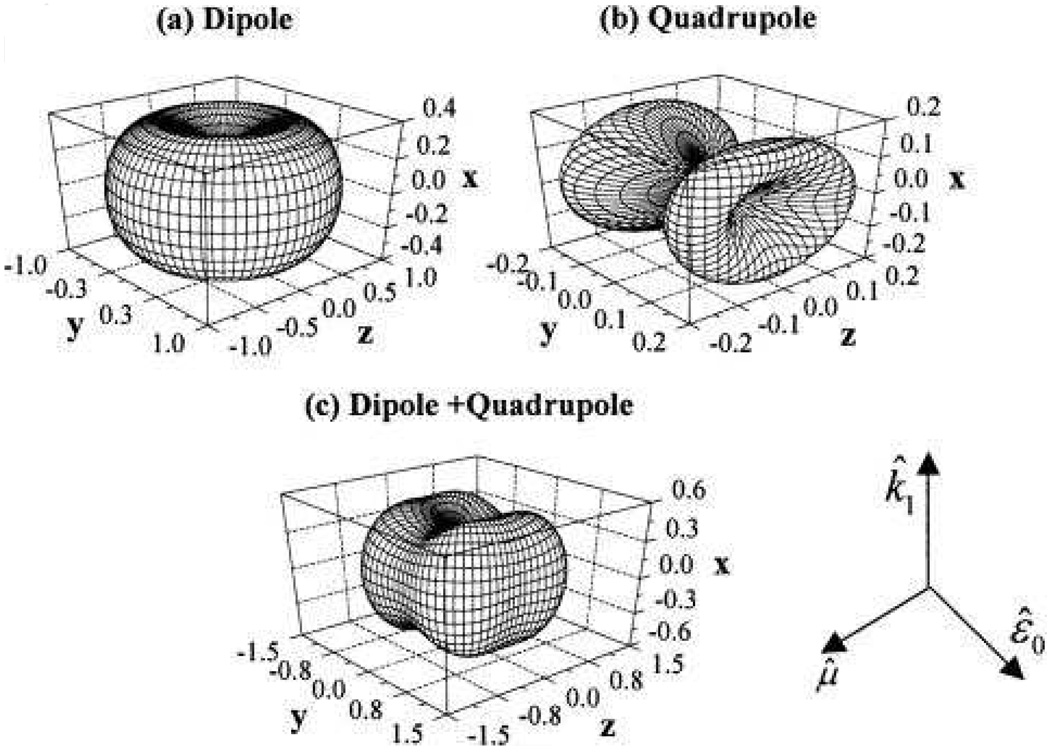
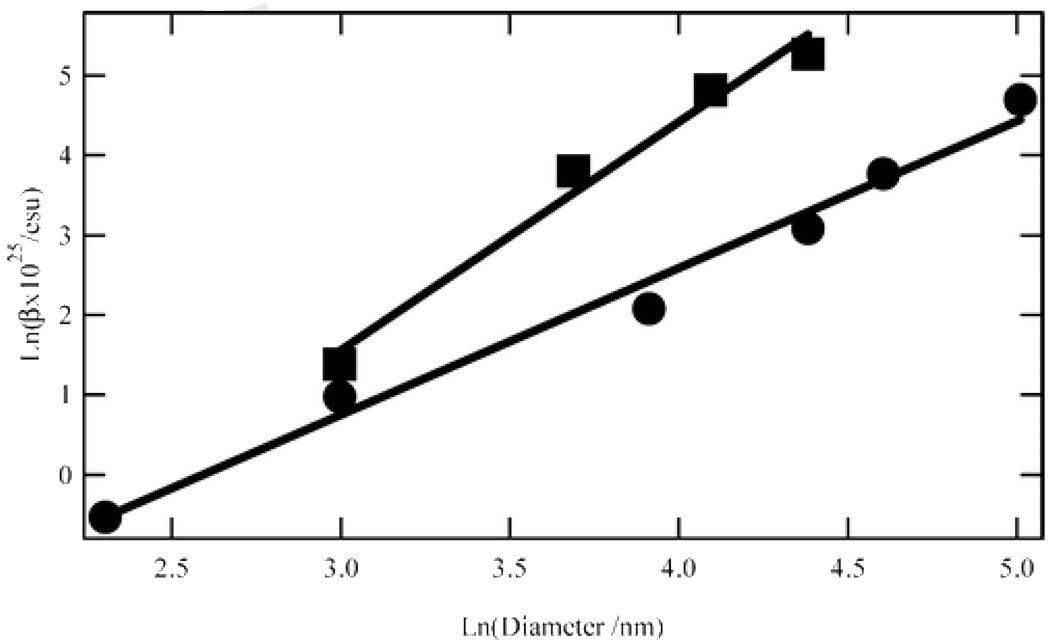
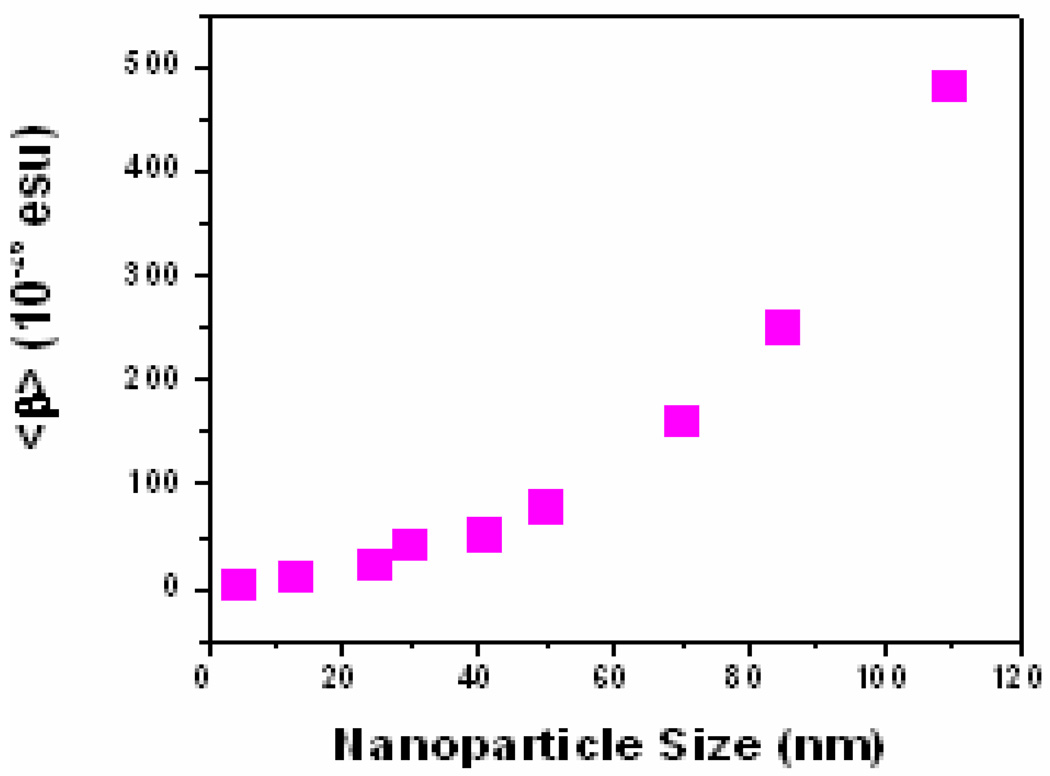
They modeled their results using a classical electromagnetic theory of SH Rayleigh scattering developed by Dadap et al. 42, 52 since known as the DSEH theory, which assumes a surface-induced nonlinear polarization from the surface of a small sphere of centrosymmetric and isotropic materials such as noble metal nanoparticles. In addition, they have shown that (as shown in Figure 5), simple angular distribution measurements may be used to determine the relative sizes of the dipole and quadrupole contributions. DSEH 42, 52 theory explains that the electric dipole at 2ω arises from two excitation mechanisms associated with the incident radiation E1 + E2 and E1 + M1 where E1 is the electric dipole excitation, M1 is the magnetic dipole excitation and E2 is the electric quadrupole excitation. The first electric dipole excitation mechanism is non-localized and large, while the second localized mechanism disappears as a consequence of the axial symmetry of the problem, which was assumed in their formulation. The electric quadrupole at the SH frequency arises from a local E1 + E1 excitation mechanism. Nappa et. al and Antonie et. al. 53–55 reported the value of the hyperpolarizability for aqueous suspensions of silver metallic particles, with diameter ranges from 20 up to 80 nm, using 780 nm incident light. They have demonstrated that although the origin of the SHG arises from the surface of the particles, the size dependence of the SH intensity exhibits a scaling with the volume of the particles. Their results clearly show that 55 (as shown in Figure 6), absolute magnitude of the first hyperpolarizability tensor obtained for gold metallic particles at the fundamental wavelength of 800 nm is smaller than that of silver particles. Now in their experiment, SPR enhancement for the silver particles is indeed rather strong owing to the harmonic wavelength used in these experiments, which is in close vicinity with the SPR wavelength. Recently Griffin et. al. 75 reported that <β> value increases by two orders of magnitude as the size changes from 5 nm to 110 nm gold nanoparticle, as shown in Figure 7. They have shown that the very high <β> value is due to high multipolar contribution. In their HRS experiment, they have used 860 nm incident light.
Figure 5.
DSEH angular distribution for three choices of the induced moments at 2ω. (a) Pure dipole emission, (b) pure quadrupole emission, and (c) equal contributions of dipole and quadrupole emission (reprinted with permission from Ref. 49, Copyright 2002, American Institute of Physics).
Figure 6.
Log–log plot of the hyperpolarizability magnitude against the particle diameter for silver (■) and gold (●) particles at the harmonic wavelength of 390 and 400 nm, respectively (reprinted with permission from Ref. 55, Copyright 2007, American Chemical Society).
Figure 7.
Variation of <β> with particle size in water solvent (reprinted with permission from Ref. 75, Copyright 2009, Willey- VCH)
The optical responses of particles that are small compared to the wavelength can be described usually in the framework of electric-dipole approximation. However, when the particle size approaches the wavelength, the dipolar picture may no longer provide a complete description, and higher multipolar interactions should be considered. When light is incident on a metal particle that has a diameter much less than the wavelength of light (d ≪ λ/10), the electromagnetic (EM) field across the entire particle is essentially uniform. This classical effect was theoretically described by Mie 154 in 1908 by solving Maxwell's equations for a plane wave incident on a metal sphere surrounded by a dielectric medium, given the dielectric function of the metal. For nanospheres whose diameters are less than about one tenth the incident radiation wavelength, only the dipole term in the expansion is significant. The collective oscillation of the electrons is known as the dipole plasmon resonance of the particle. For larger particles, when d ~ λ/10, contribution of higher-multipoles becomes very important to the scattering spectra. Multipoles can arise by two different ways and these are 1) from the light matter interaction Hamiltonian, corresponding to microscopic multipole moments, and 2) according to Mie’s scattering theory 154. Standard Mie’s theory is based on dipolar interaction, and multipoles arise from the size and retardation effects. As a result, the total nonlinear polarization consists of different contributions such as multipolar radiation of the harmonic energy of the excited dipole and possibly of higher-multipoles 48–62. The HRS intensity therefore also consists of several contributions. The first one is the electric dipole approximation, which may arise due to the imperfect triangular structure in nanoparticle. This contribution is actually identical to the one observed for any non-centrosymmetrical point-like objects such as efficient rod-like push-pull molecules.
The second contribution is multipolar contribution like electric-quadrupole contribution. This contribution is very important when the size of the particle is no longer negligible in comparison to the wavelength. To probe the multipolar contribution, Nappa et. al. 57 performed angle resolved HRS measurement using 800 nm incident light. For this purpose, the fundamental input beam was linearly polarized, and the input angle of polarization was selected with a rotating half-wave plate. The configuration of the experimental setup was such that the fundamental beam was propagating in the Z direction with the electric field polarized in the {X,Y} plane with the polarization angle and the harmonic light was collected along the Y direction, at right angle from the fundamental beam propagation direction.
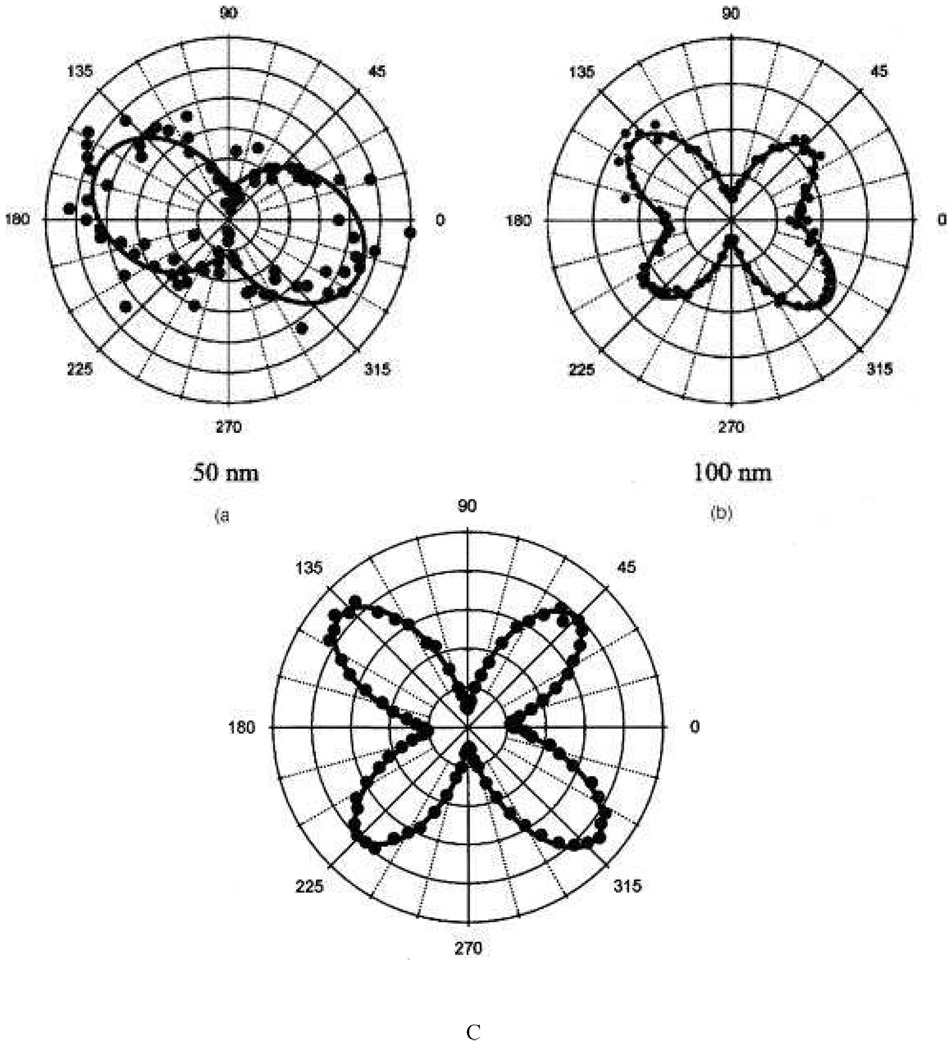
Their experimental results (as shown in Figure 8) clearly show that for the particles with a diameter smaller than 50 nm, the response is dominated by the dipolar contribution arising from the deviation of the particle shape from that of a perfect sphere. For larger diameter particles, retardation effects in the interaction of the electromagnetic fields with the particles cannot be neglected any longer and the response deviates from the pure dipolar response, exhibiting a strong quadrupolar contribution. Their experimental plot for 50 nm diameter nanoparticle shows two lobes, which are similar to the one for pure electric dipole response from noncentrosymmetric organic molecules, reported before by several groups 1–18. The polarization-resolved SH intensity can be fitted nicely with Equation 18 (as shown in Figure 8) that accounts for the input polarization dependence of SH intensities of polar molecules in isotropic media in the absence of any retardation effects 40–72,
| (18) |
where, A, B and C are the coefficients which depend on the polarization state of the detected SH light, frequency of the incident light and the non-vanishing components of the β tensor in the laboratory frame. By fitting the experimental data with equation 18, they 57 find A = 0.62, C = 0.31, B =1, which satisfies B = A + C, setting B to unity since the HRS intensity is reported in arbitrary units. These parameters clearly verify the condition B = A + C, for dipolar molecules, within the experimental error of 8% condition. Same figure shows the polar plots of the vertically polarized HRS signal as a function of the angle of polarization φ of the incoming incident light for colloidal solution of 100 nm and 150 nm silver triangular nanoprism. Here, the nature of the plot changes significantly. This contribution pattern shows four lobes oriented on the 45°, 135°, 225°, and 315° axes. The asymmetric four-lobe pattern is no longer predominantly dipolar in origin, and Equation 18 could not fit the data. Instead, the data can be fitted with a modified expression 40–72 for the polarization-resolved SH light intensity as shown in Equation 19.
| (19) |
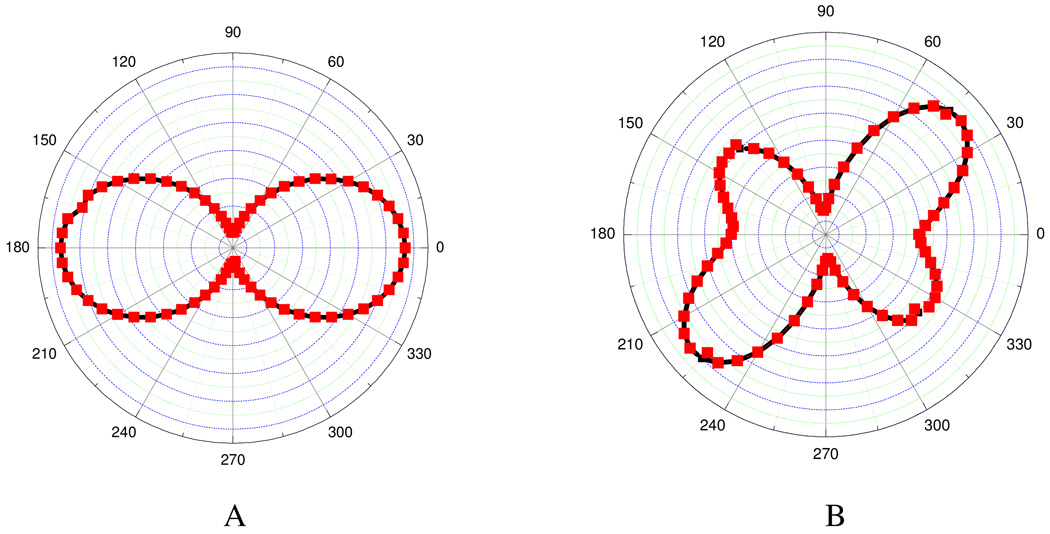
In Equation 19, the new two terms D and E represent the retardation effects as discussed before 29, 35–37, 45. By fitting the experimental data (shown in Figure 8) with equation 19, they 57 find A = 0.08, C = 0.03, B =1, D = −0.10, E = 0.06, which does not satisfy B = A + C, condition for dipolar molecules, as we discussed before. The presence of these two new parameters D and E only arise for the larger particle diameters and therefore should be related to retardation effects. They are required in order to adjust for the experimental observation of the size inequality of the lobes. Their origin is not clear yet, but their magnitude nevertheless remains weak in front of the other parameters. Same group has reported the HRS intensity as a function of the angle of polarization of the incident fundamental wave for silver nanoparticle from 20 to 80 nm 55 (as shown in Figure 9). Their result shows that for the particles with a diameter of 20 nm, the harmonic response is dominated by the dipolar contribution and for larger diameter particles, retardation effects in the interaction of the electromagnetic fields with the particles cannot be neglected, and the response deviates from the pure dipolar response, as we discussed for gold nanoparticles of bigger size.
Figure 8.
Polar plot of the HRS intensity as a function of the incoming fundamental beam polarization angle: (filled circles) experimental points and (solid) fit to the experimental data points using theoretical modeling for an aqueous suspension of (a) 50 nm diameter and (b) 100 nm diameter and c) 150 nm diameter gold particles (reprinted with permission from Ref. 57, Copyright 2006, American Institute of Physics).
Figure 9.
Polar plot of the HRS intensity as a function of the incoming fundamental beam polarization angle: (filled circles) experimental points and (solid) theoretical fit to the experimental data for aqueous suspensions of (a) 40 nm, (b) 60 nm, and (c) 80 nm diameter silver particles for a harmonic wavelength of 390 nm vertically polarized (reprinted with permission from Ref. 55, Copyright 2007, American Chemical Society).
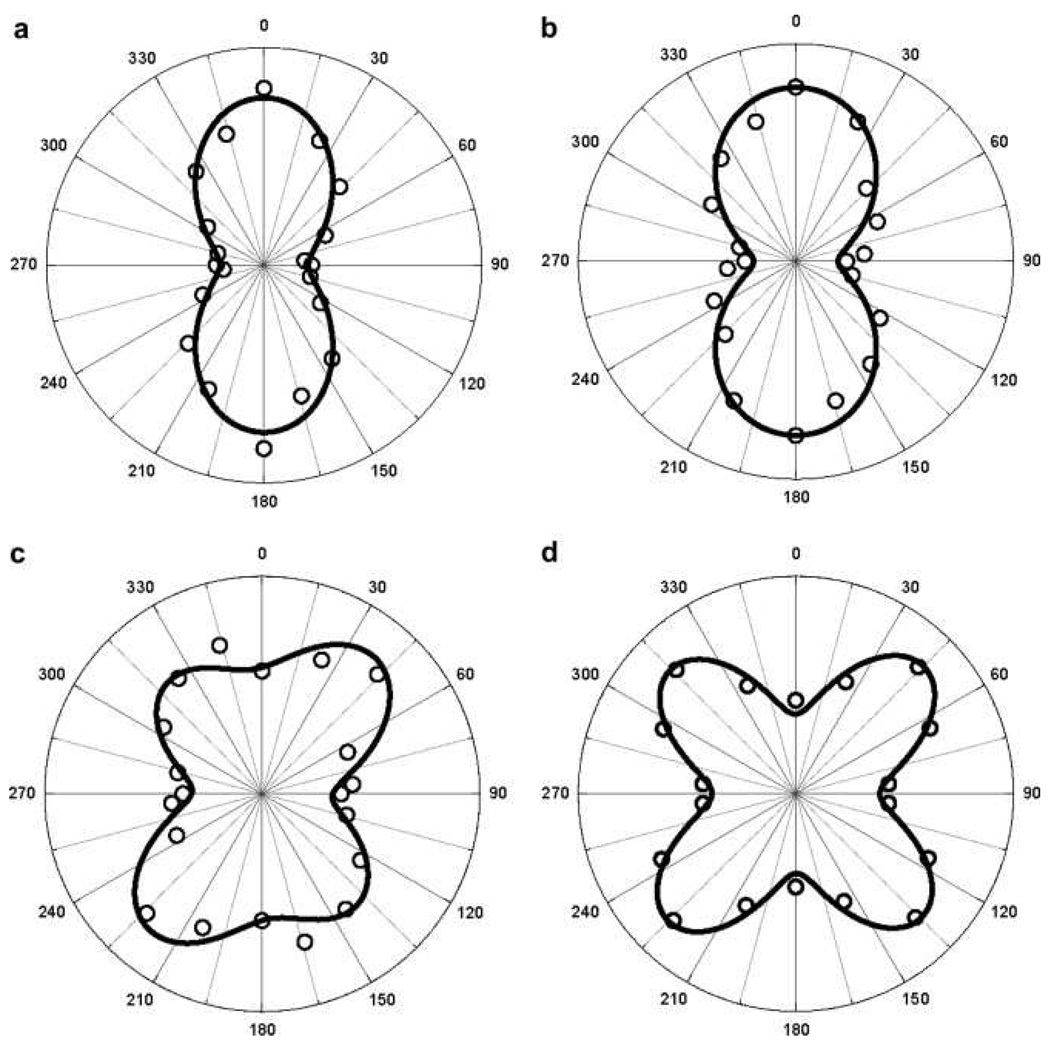
Now it is interesting to note that for smaller silver metallic nanoparticles (40 & 60 nm size) both the electric-dipole and the electric-quadrupole surface plasmon resonance contributions are clear (as shown in Figure 9), whereas for 50 nm gold nanoparticle, local electric-dipole contribution to the HRS signal intensity dominates (shown in Figure 8). Previous studies on linear spectra of silver nanoparticles 111 show that when the size of a silver metal nanoparticle increases, higher-order plasmonic wave modes such as electric quadrupole or magnetic dipole modes can be excited at the metal nanoparticle, and a series of SPR peaks can appear in the optical spectrum. But these multipolar peaks from spherical gold nanoparticle in optical extinction spectrum have not been reported. As a result, it appears that electric-multipolar contribution can be prominent for silver nanoparticle in one or multi-photon spectra.
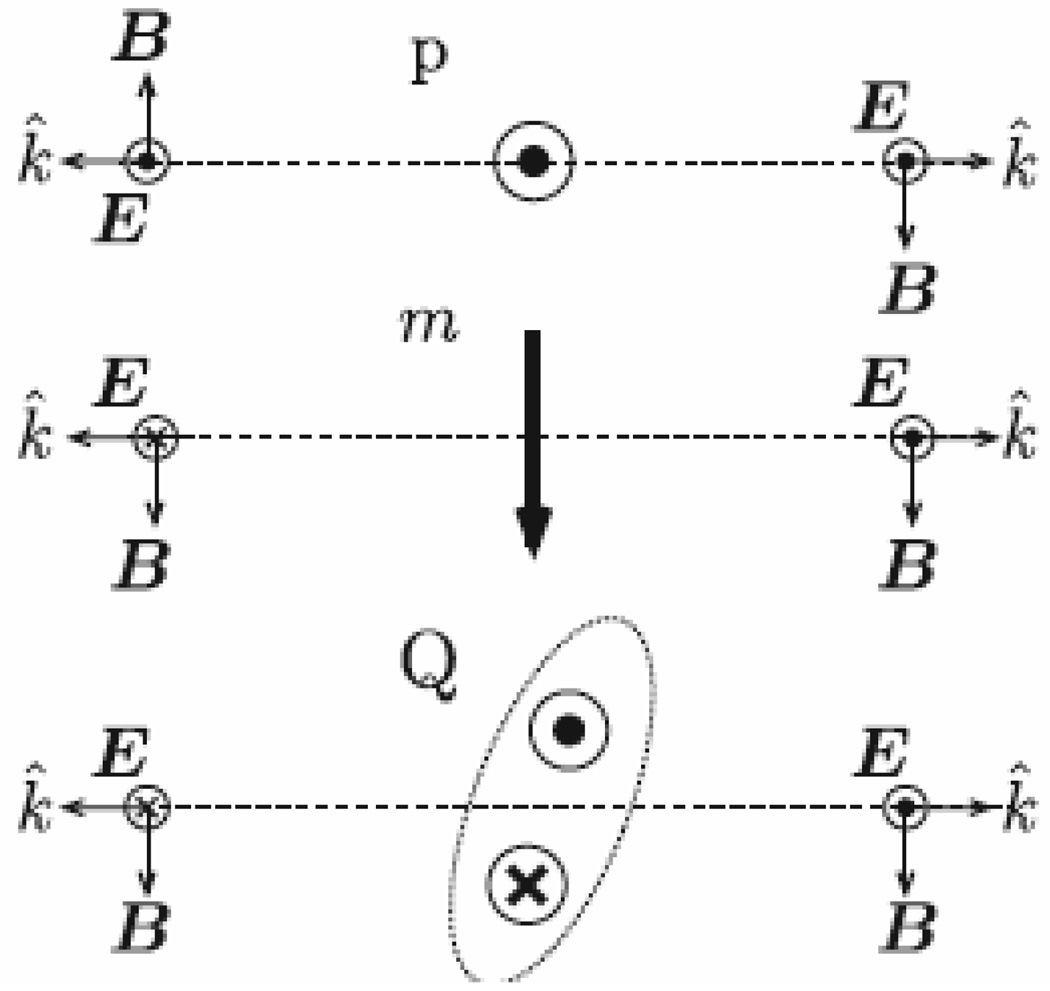
Kujala et. al. 50 provided experimental evidence for higher multipole (magnetic dipole and electric quadrupole) radiation in second-harmonic (SH) generation from arrays of metal nanoparticles. They have shown clearly that the fundamental differences in the radiative properties of electric dipoles and higher multipoles yield opposite interference effects as they observed during the SH intensities measured in the reflected and transmitted directions, shown in Figure 10.
Figure 10.
Simple schematic of the radiative properties of an electric dipole (p), magnetic dipole (m) and quadrupole (Q) (reprinted with permission from Ref. 50, Copyright 2007, American Physical Society).
Their studies clearly demonstrated that interference effects depend on the polarization of the fundamental field, which directly indicates the importance of multipole effects in the nonlinear response. They have shown that strong polarization dependence of the response can modify the relative strengths of the interfering terms, thereby allowing electric-dipole and higher-multipole contributions to the overall SHG response. Their analysis of the measured polarization dependencies provides knowledge of the mechanisms underlying the nanoscale SHG process in gold nanoparticles.
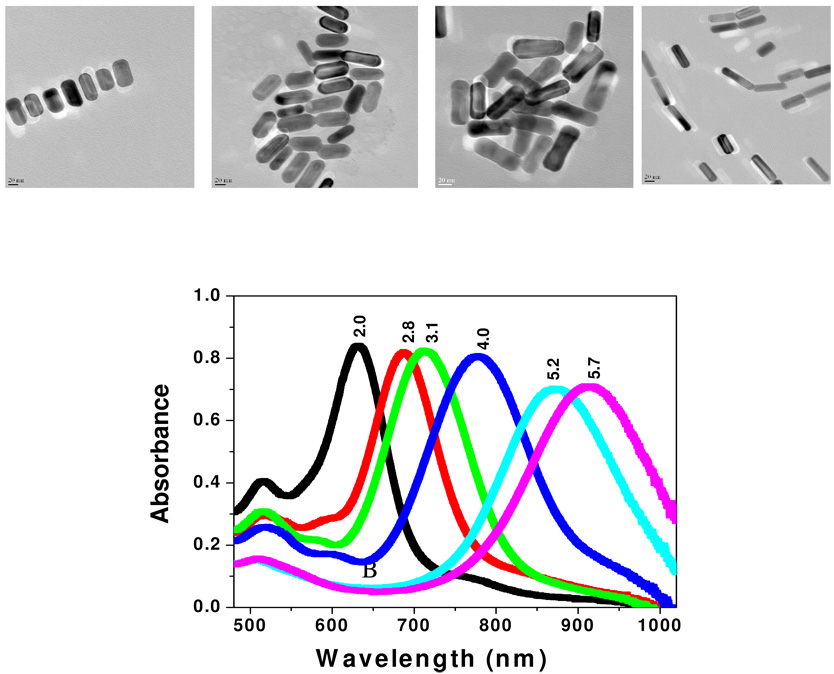
Darbha et. al. 81 reported, <βnano> = 3.8 × 10⁻²⁴ esu in water solvent for 80 nm gold nanorod (aspect ratio, 2.4) using 860 nm incident light, which is about 3–4 orders of magnitude higher than the β values reported for the best available molecular chromophores and a couple of times higher than the β value reported for gold nanoparticles. As they have discussed, higher β values for nanorod compared to nanosphere can be due to several facts and these are 1) the presence of {110} facets, which is not present in nanospheres, is known to have strong absorption energies; 2) the surface electromagnetic field of rods is the highest compared to other shapes due to the rod's high curvatures (called "the lightning rod" effect 155), and 3) possibility of single photon resonance enhancement. They have also studied the aspect ratio dependent SHG properties for silver nanorod 81. Since nanorods with different aspect ratios have roughly the same diameter, the length of the nanorods mainly varies with the variation of aspect ratio. Their data indicate that <β> value increases 3 times when the aspect ratio increases 6 times and it is due to the red shift of absorption maxima as well as higher single photon resonance enhancement.
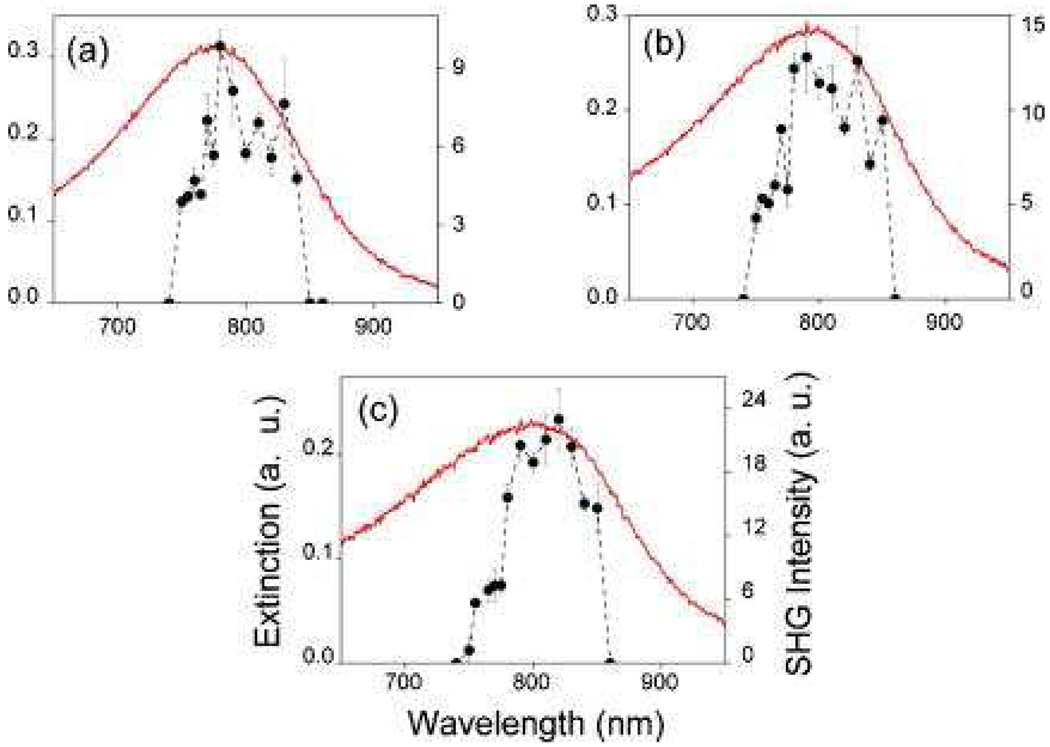
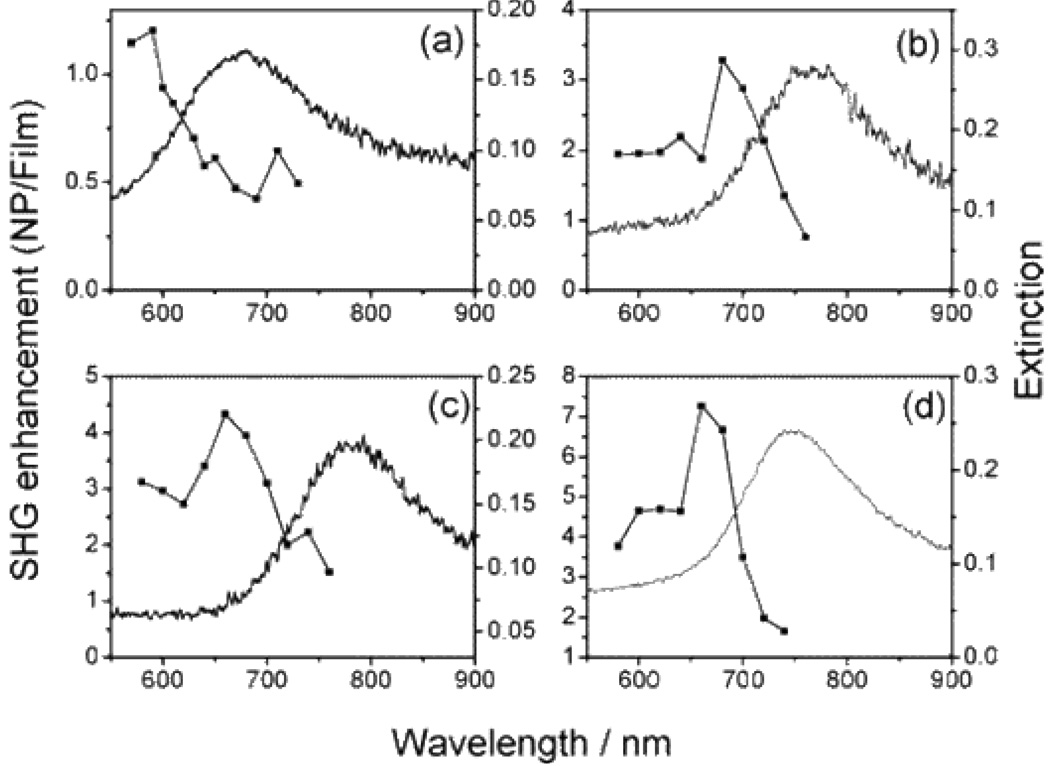
Hubert et. a. 156 studied the role of surface plasmon in SHG from arrays of gold nanorods using 800 nm incident light. Their experimental data clearly exhibit the influence of the irradiation wavelength on SHG process and confirms the role of the plasmon resonance. Excitation spectroscopy of SHG from 150, 170, and 190 nm long axis gold nanorods are shown in Fig. 11. Their results clearly show that a small variation in the plasmon resonance intensity, leads to strong variations in SH intensity. They have argued that, since the SHG is theoretically forbidden in centrosymmetrical systems, the nonlinear generation process may arise from the a) deviation of the shape of the nanoparticles from that of a perfect symmetrical nanorod as well as from the broken symmetry at the air-metal and metal-substrate interfaces; b) defects in the crystalline structure of gold nanoparticles also have to be considered and c) due to the large range of wave vectors produced by confined plasmon excitation, depolarization effects can be induced; i.e., vertical component of the near-field appears, making asymmetry discussion nontrivial.
Figure 11.
Second-harmonic generation enhancement (circles) from arrays of gold nanorods with (a) 150 nm, (b) 170 nm, and (c) 190 nm long axis (the dashed line serves as a guide for the eyes). The extinction spectrum (solid line) is shown for comparison. The irradiation time and power used to record the second harmonic signal were equal to 5 s and 50 mW, respectively. The incident polarization was set parallel to the nanoparticle long axis (reprinted with permission from Ref. 156, Copyright 2007, American Institute of Physics).
Singh et. al. 157 have demonstrated how controlling the size of a tetrahedral nanostructure can improve the NLO properties using 1064 nm incident light. They have shown experimentally that β value is highly dependent on the size of triangular silver nanomaterial. Their experimental results indicate that <β> value in water solvent varies by about two orders of magnitude with the variation of size from 30 nm to 120 nm. This can be due to several factors and these are as follows: 1) Since the absorption maximum shows red shift with increase in particle size, β should be higher for bigger particle according to two-level model 142 and 2) the most important factor is multipolar contribution. This contribution is very important when the size of the particle is no longer negligible in comparison to the wavelength, as we discussed before. Their experimental results (as shown in Figure 12) indicate that multipolar contribution is very prominent for nanoprism and higher multipolar contribution becomes higher as we increase the size. For bigger triangular nanoprism, when the size of the particle is no longer negligible in comparison to the excitation wavelength, the most important factor is multipolar contribution.
Figure 12.
A) Polar plot of the HRS intensity as a function of the incoming fundamental beam polarization angle (φ) from aqueous suspensions of 30 nm silver nanoparticle. Solid points are the HRS experimental data and solid lines are the theoretical fit of the experimental data point using Equation (18). B) Polar plot of the HRS intensity as a function of the incoming fundamental beam polarization angle from aqueous suspensions of 80 nm silver nanoprism. Solid points are the HRS experimental data and solid lines are the theoretical fit of the experimental data point using Equation (19) (reprinted with permission from Ref. 157, Copyright 2009, Elsevier).
4.2 Size and Shape Dependent NLO Properties of Copper Nanoparticles
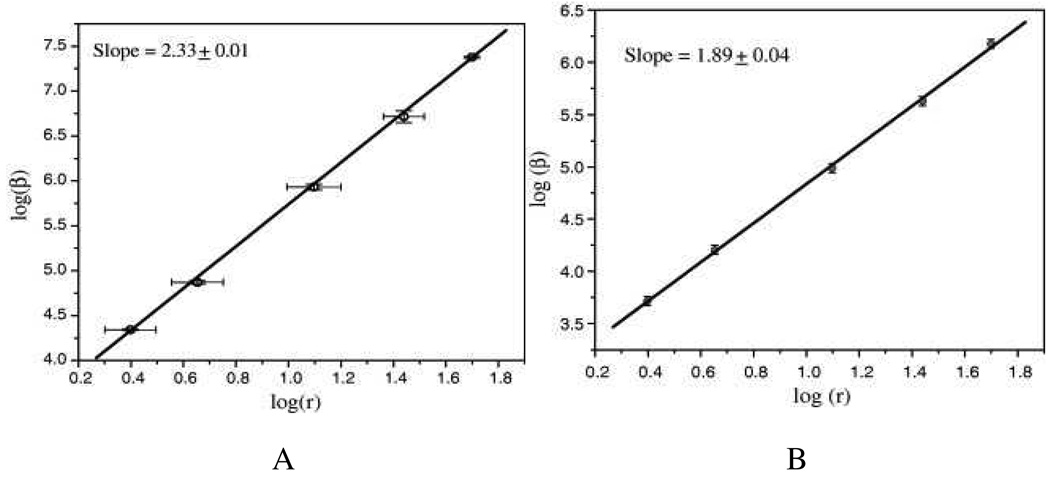
Copper is the most abundantly used metal in electronics applications due to its high conductivity and low cost. Chandra et. al. 51,56,69,70 reported the size dependency of SHG from copper nanoparticles (shown in Figure 13). Their results show that <βper particle> value changes by more than two orders of magnitudes as the size changes from 5 to 100 nm. Their first hyperpolarizability measurements under both on- and off resonance conditions show that β values are two-photon resonantly enhanced by an order of magnitude on going from off resonant (1907 nm excitation) to on-resonant condition (1064 nm excitation).
Figure 13.
A: log–log plot of β/partcile (at 1064 nm excitation wavelength) vs. particle size, r for copper nanoparticles. The straight line is a linear fit to the data points. 13B) Size dependence of the first hyperpolarizability of copper nanoparticles at 1907 nm (reprinted with permission from Ref. 69, Copyright 2009, Elsevier).
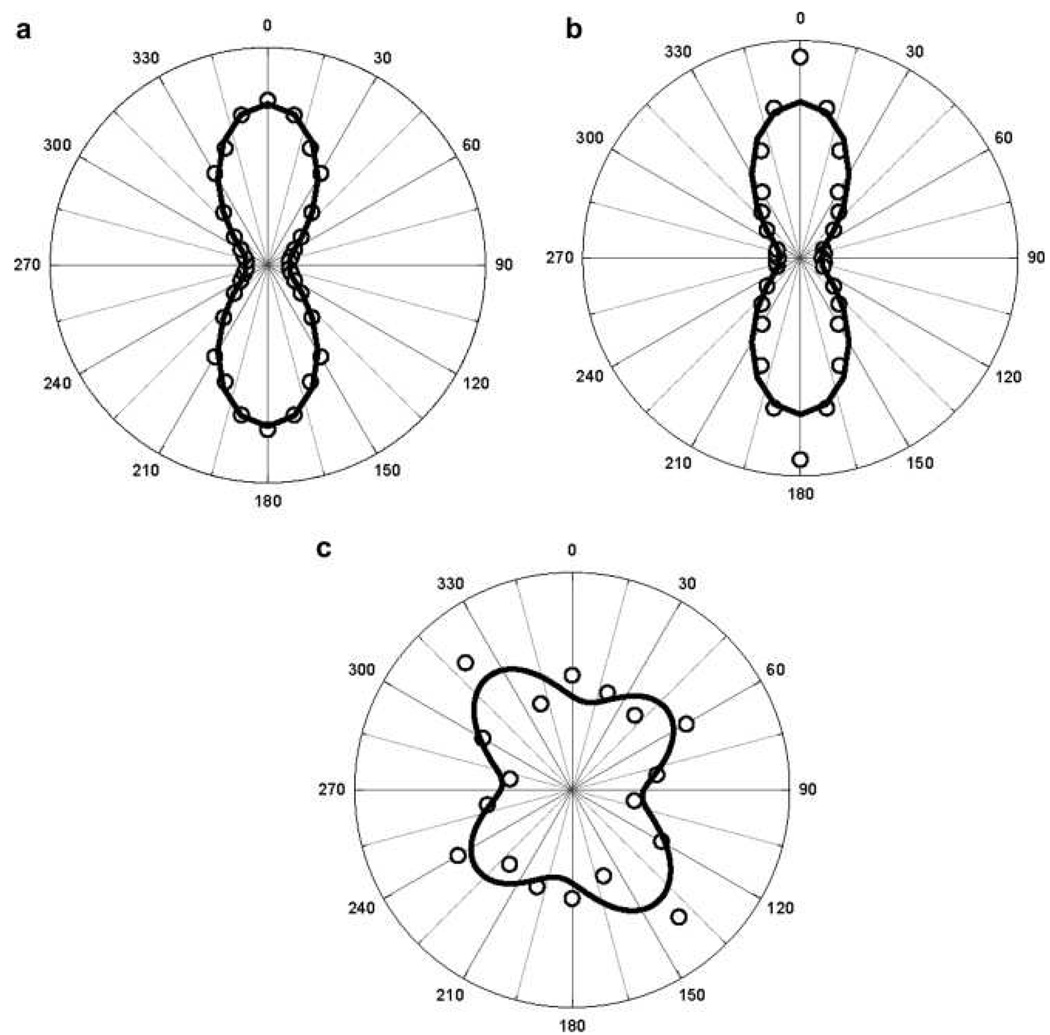
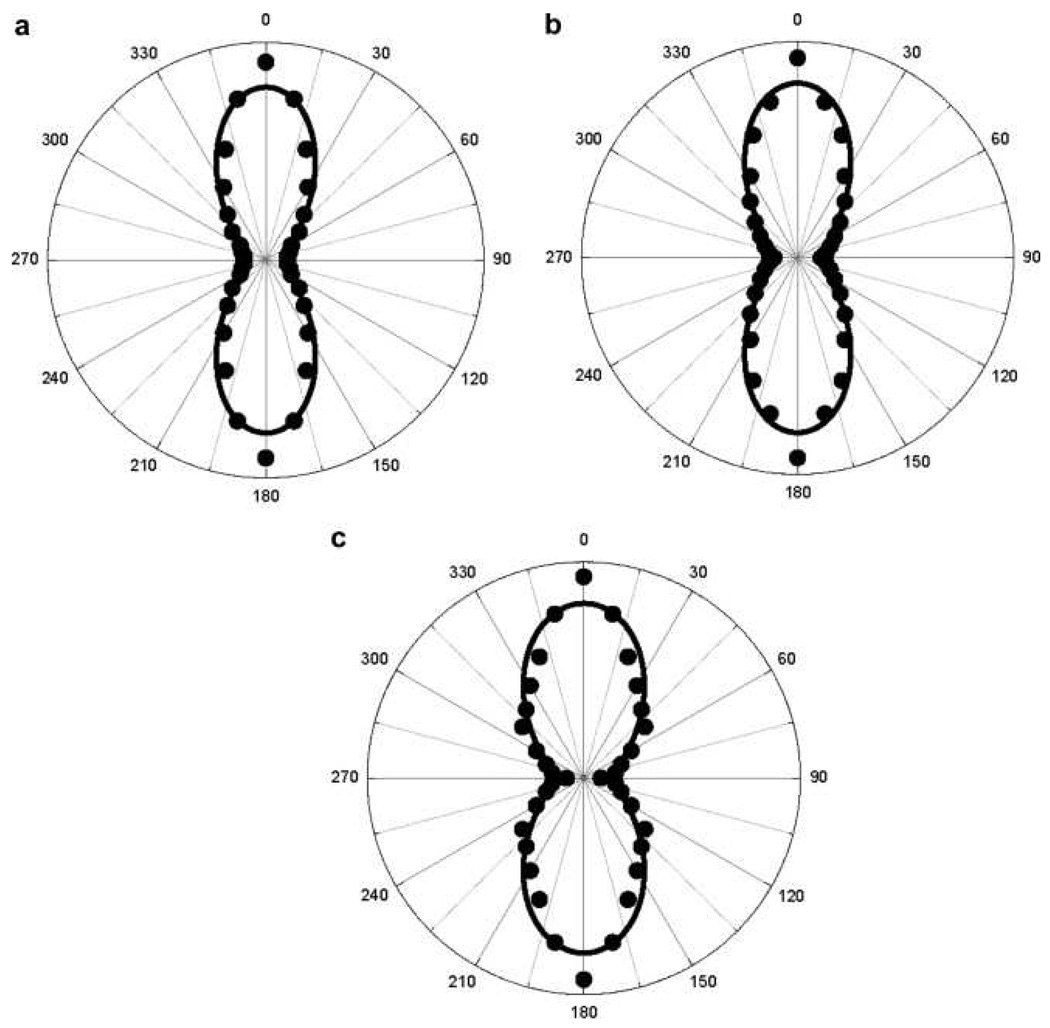
Same group has reported 70 the origin of SHG in copper nanoparticles by polarization-resolved HRS. To understand where the origin of SHG in these particles is purely dipolar in nature as long as the size (d) of the particles remains smaller compared to the wavelength (λ) of light, they have performed HRS experiments with various sizes of copper nanoparticles at three different wavelengths covering the wavelength range 738–1907 nm (as shown in Figure 14–16).
Figure 14.
Polar plots of the HRS intensities as a function of the incident light (1064 nm) polarization angle ψ for the copper nanoparticles of diameters (a) 25 nm, (b) 55 nm and (c) 100 nm. Open circles are the HRS intensities and the solid lines are fit to the data points (reprinted with permission from Ref. 70, Copyright 2009, Elsevier).
Figure 16.
Polar plots of the HRS intensities as a function of the incident light (1907 nm) polarization angle ψ for the copper nanoparticles of diameters (a) 25 nm, (b) 55 nm and (c) 100 nm. Solid circles are the HRS intensities and the solid lines are fit to the data points using (reprinted with permission from Ref. 70, Copyright 2009, Elsevier).
For 738 nm excitation (as shown in Figure 15), polar plots show that the HRS response remains predominantly dipolar up to a particle size of 25 nm, whereas retardation effects and quadrupolar contribution become visible for particle size of 55 nm as well as 100 nm particles. On the other hand, the results at 1064 nm indicate that the HRS response remains predominantly dipolar up to a particle size of 55 nm and onset of retardation effect in the SH light scattering from copper nanoparticles appears somewhere in between the d/λ ratios of 55/1064 (~1/20) and 100/1064 (~1/11). Further more, at 1907 nm excitation (as shown in Figure 16), their results clearly show that the origin of HRS from copper nanoparticles is found to be dipolar for all the particle sizes investigated.
Figure 15.
Polar plots of the HRS intensities as a function of the incident light (738 nm) polarization angle ψ for the Cu nanoparticles of diameters (a) 9 nm, (b) 25 nm (c) 55 nm and (d) 100 nm. Open circles are the HRS intensities and the solid lines are fit to the data points (reprinted with permission from Ref. 70, Copyright 2009, Elsevier).
The d/λ ratio at 1907 nm for the largest-sized copper nanoparticle (100 nm) is ~1/19, which is smaller than that at the onset of the retardation effect that has been observed at other excitation wavelengths. Form all the experimental evidences, they concluded that the critical value of d/λ at which retardation effects just appear at this wavelength as <1/13.
4.3 Size and Shape Dependent NLO Properties of Quantum Dots and Metal Oxide Nanoparticles
Semiconductor nanostructures are considered as promising materials for multicolor single excitation biological labeling and dynamic three-dimensional nanoscale optical imaging. Large nonlinear optical coefficients in these materials may lead to photonics applications, such as ultrafast optoelectronic switches 72–96. Moreover, nonlinear optical processes may provide valuable information for proper understanding of quantum confinement and surface effects in low-dimensional structures. For this reason, the NLO properties of semiconductor nanocrystals have been investigated in the past decade 72–96.
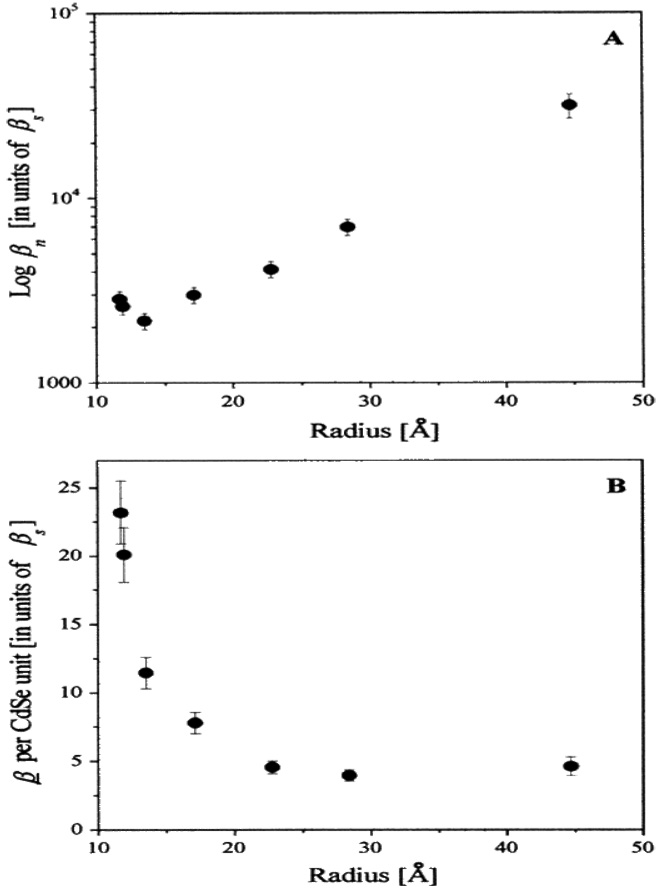
Jacobson et. al. 76 reported the size dependence SHG in CdSe nanocrystal quantum dots using 820 nm incident light, as shown in Figure 17. Their experimental result shows that <β> per nanocrystal in ethylene glycol dimethyl ether (DME) solvent decreases with size down to approximately 13 Å in radius and the <β> value increases with further size reduction. They have explained the observed size dependence of the SHG, assuming two contributions. The first is a bulk like contribution, from the non-centrosymmetric nanocrystal core, and the second, a contribution from the nanocrystal surface. According to their result, the latter contribution is most significant in small nanocrystals with a substantial proportion of surface atoms. They have also suggested that the SHG technique can be used as a probe of nanocrystal surfaces.
Figure 17.
Size dependence of the SHG response from CdSe nanocrystals. Frame A shows on a log scale, the size dependence of βn, the value of the hyperpolarizibility per nanocrystal which decreases as size is decreased to radii of 13.5 Å. For the smallest radii, this trend is reversed and βn increases. Frame B depicts the size dependence of the normalized value of the hyperpolarizibility per unit cell, which shows significant systematic enhancement for small sizes. The primary contribution to the error bars is the uncertainty in the determination of nanocrystal concentrations from the measured extinction coefficients as discussed in the Experimental Section. A ±20% error in ε propagates to ±10% error in the values of βn (reprinted with permission from Ref. 76, Copyright 2000, American Chemical Society).
Zhang et. al 83 reported second-order NLO properties of the CdS colloid using 1064 nm incident light. Their experimental result shows that ‘per particle’ first hyperpolarizability <β> value is in the range of 10−26 esu. Using water as an internal standard (β=0.56×10⁻³⁰ esu) the ‘per particle’ first hyperpolarizability <β> values are estimated to be 2.76×10⁻²⁶, 2.07×10⁻²⁶, 1.45×10⁻²⁶, 1.14×10⁻²⁶ esu for the samples aged for 5 h, one day, two days, and three months, respectively. From the experimental evidence, it is thus clear that the β values of the CdS nanoparticles decrease with increasing aging time, which may be due to the change in the surface chemical structure of nanoparticles in solution as a result of their high surface activity. In addition, their results show strong two-photon fluorescence (2PF) of CdS nanoparticles, which implies that two-photon absorption (TPA)-induced resonance enhancement may contribute to the HRS signal of CdS nanoparticles. Now it is well known that molecules that absorb light at the SH wavelength, two-photon or multiphoton fluorescence may hamper an accurate determination of β 132,134,138. Flipse et al. 132 have shown that HRS is not suitable for the measurement of <β>, if NLO chromophore exhibits fluorescence in second harmonic region. Song et. al. 134 has shown that direct S2 → S0 two-photon fluorescence band of crystal violet (CV) and the HRS peak overlap. As a result, measuring <β> values using HRS measurement can have error. Several groups 135,138,144,153 have argued that SH signal can be separated from two- or multiphoton fluorescence signal in a variety of ways including spectrally resolving the scattered light, using a femtosecond laser to separate the fluorescence in the time domain, or using a high repetition rate femtosecond laser to suppress the fluorescence. Depending on the molecule whose β is being measured, it is always better to choose excitation wavelength in such a way that the wavelength of excitation and SH wavelength, is far from the absorption band of the molecule. Other wise it is very much necessary that a careful analysis of the HRS signal should carried out to correct for TPF if present.
Zhang et al. 169 have also demonstrated that with 1064 nm incident light, the first order hyperpolarizability values of CdS nanoparticles depend on the surface coating material. Their HRS experiment indicated that <β> value per particle of CdS nanoparticles capped with 2,2'-bipyridine is 4.27 × 10⁻²⁷ esu in chloroform solvent, whereas β value is 1.30 × 10⁻²⁶ esu in chloroform solvent for bare CdS nanoparticles whose surface is not modified by organic groups. The difference is interpreted in terms of a two-level model approximations derived from molecular chromophores, when considering the contribution of molecule-like scatterers at the particle surfaces. Petorv et. al. 170 reported the 1st hyperpolarizability of polyphosphate stabilized four aqueous suspensions of CdxZn1-xS nanocrystals using 1064 nm incident light. In their study, they have used the same diameter (9 nm) nanocrystals, with different values of x, (x = 0, 0.25, 0.75, 1), so that they are able to vary band gap energies.
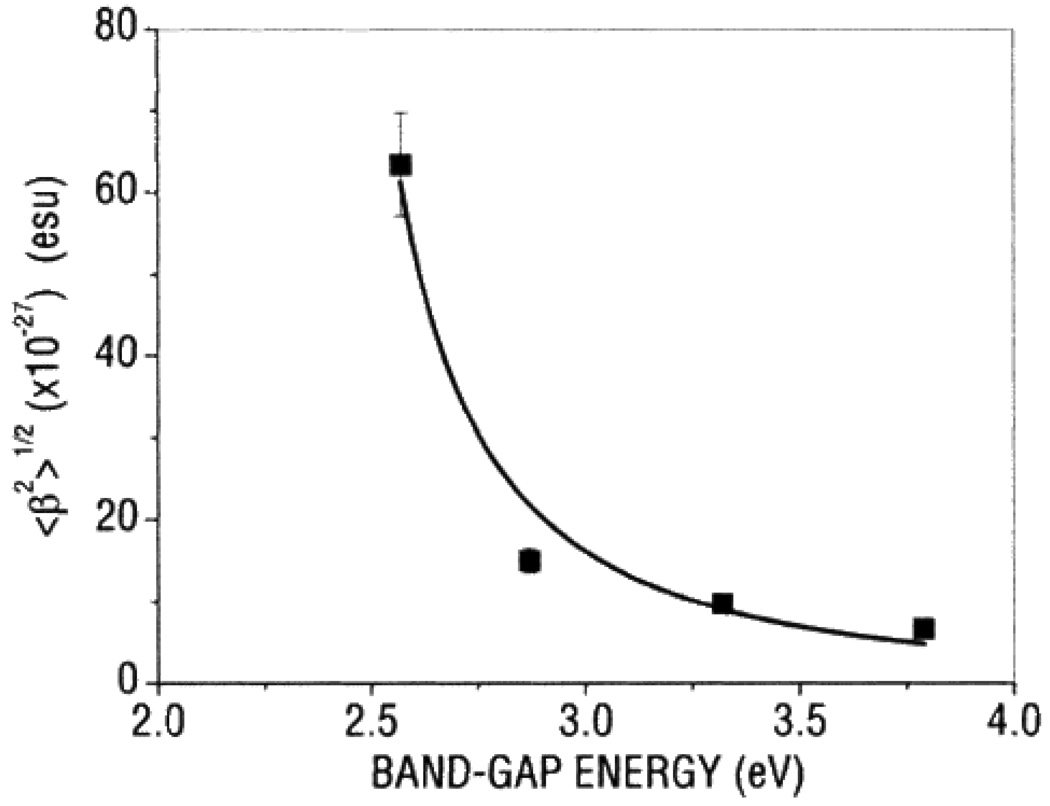
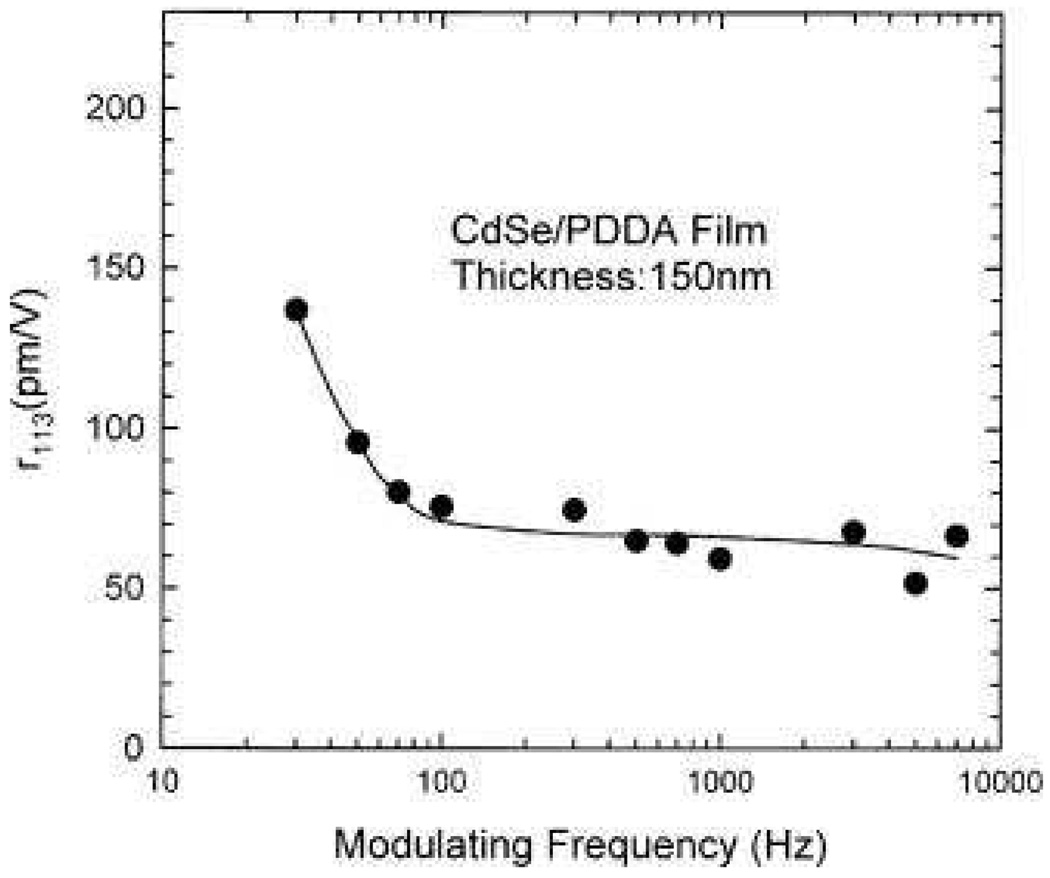
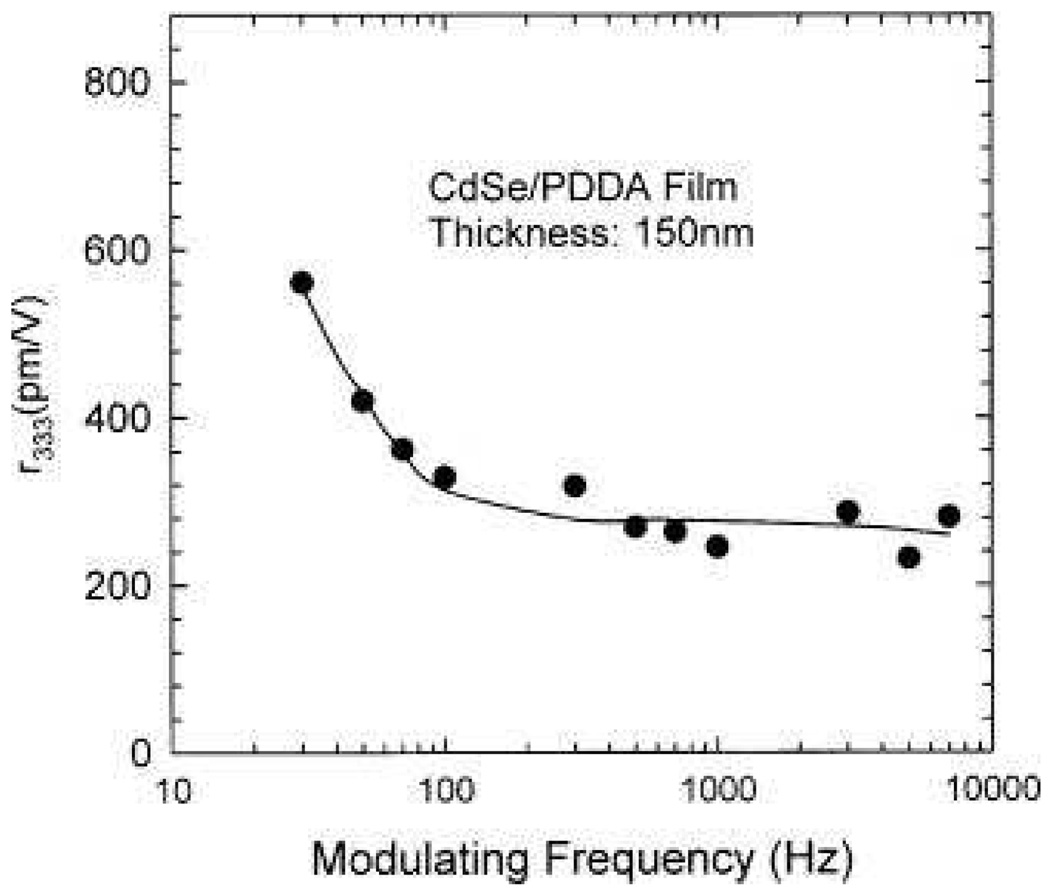
As shown in Figure 18, their results clearly demonstrate that the first hyperpolarizability β of 9 nm CdxZn1−xS nanocrystals in water solvent is observed to increase with x. This is mainly due to the increase in resonance enhancement because of the decrease in the band-gap energy. Their experimental results also show that the values of <β> of CdS nanocrystals increase with the particle size, varying from 1.4 × 10⁻²⁷ to 72.4 × 10⁻²⁷ esu as the particles grow from 2 to 9 nm in diameter. Their observation has been explained by the enhancement of both bulk and surface contributions. Bulk contribution is due to the quantum confinement effects on the volume normalized oscillator strengths. Due to the enhanced spatial overlap between the electron and hole wave functions, oscillator strength increases with decreasing particle size. The surface contribution is also expected to become more significant as the size decreases, because of the larger surface/bulk ratio. Their experimental results also indicate that bulk contribution seems to be the dominating for nanocrystal of smaller sizes ≈ 2 nm. Zhang et. al. 84 reported the second-order NLO properties of ZnS nanocrystal quantum dots in aqueous medium using 1064 nm incident light. Their experiments show that ZnS nanocrystals with cubic zinc blend structure enhanced <β>/particle value by at least two orders of magnitude compared to that of bulk cubic ZnS crystal. They have discussed about five possible contributions and these are 1) nanoparticle aggregates, 2) surface static electric field, 3) solvent field, 4) bulk-like contribution, and 5) surface contribution. In addition, their results clearly show that the <β>/particle values of ZnS nanocrystals and CdS nanocrystals reported previously are of the same orders of magnitude under similar conditions involving preparation method, size, and measurement conditions. Rodriguez et. al. 93 reported the first hyperpolarizabilities of ferroelectric BaTiO3 and PbTiO3 nanoparticles (NPs) with average diameter of ≈50 nm, using 1064 nm incident light. Their result shows that the per nanoparticle <β> value is 10−24 esu and they have also shown that β value per unit volume of NPs is two orders of magnitude larger than that of antiferroelectric NaNbO3 nanoparticles. Zhang et. al. 96 reported the electro-optic properties of CdSe quantum dots. They prepared CdSe quantum dot-polymer composites formed by an electrostatic self-assembly (ESA) technique. Their result shows that the internal field of the ESA film to be as high as 2.6 × 10⁸ V/m, which is much higher in comparison to the results obtained from bulk crystal. They have used Mach-Zenhder interferometric technique for linear electrooptic (Pockels) measurement and ellipsometric technique for quadratic electrooptic (Kerr) effect measurements. Figures 19 and 20 show their experimental values for r113 and r333, respectively. It is interesting to note that the maximum r333 at a modulating frequency of 30 Hz is 560 pm/V and both EO coefficients r113 and r333 undergo a rapid decrease at frequencies less than around 100 Hz. At frequencies higher than 100 Hz, they continue to decrease slowly until reaching a diminished stable value. Their result will be helpful in evaluating candidate polymeric and hybrid organic–inorganic materials for electro–optic device applications.
Figure 18.
First hyperpolarizability 〈β2〉1/2 as a function of the band-gap energy for the investigated samples of colloidal suspensions of CdxZn1−xS nanocrystals. The points are experimental data, whereas the solid line is the best-fitting curve (reprinted with permission from Ref. 170, Copyright 2002, American Chemical Society).
Figure 19.
r113 as a function of modulating frequency measured using the Mach–Zehnder setup. Symbols and solid line indicate the measured and fitted results, respectively (reprinted with permission from Ref. 96, Copyright 2002, American Institute of Physics).
Figure 20.
r333 as a function of modulating frequency measured using the Mach–Zehnder setup. Symbols and solid line indicate the measured and fitted results, respectively (reprinted with permission from Ref. 96, Copyright 2002, American Institute of Physics).
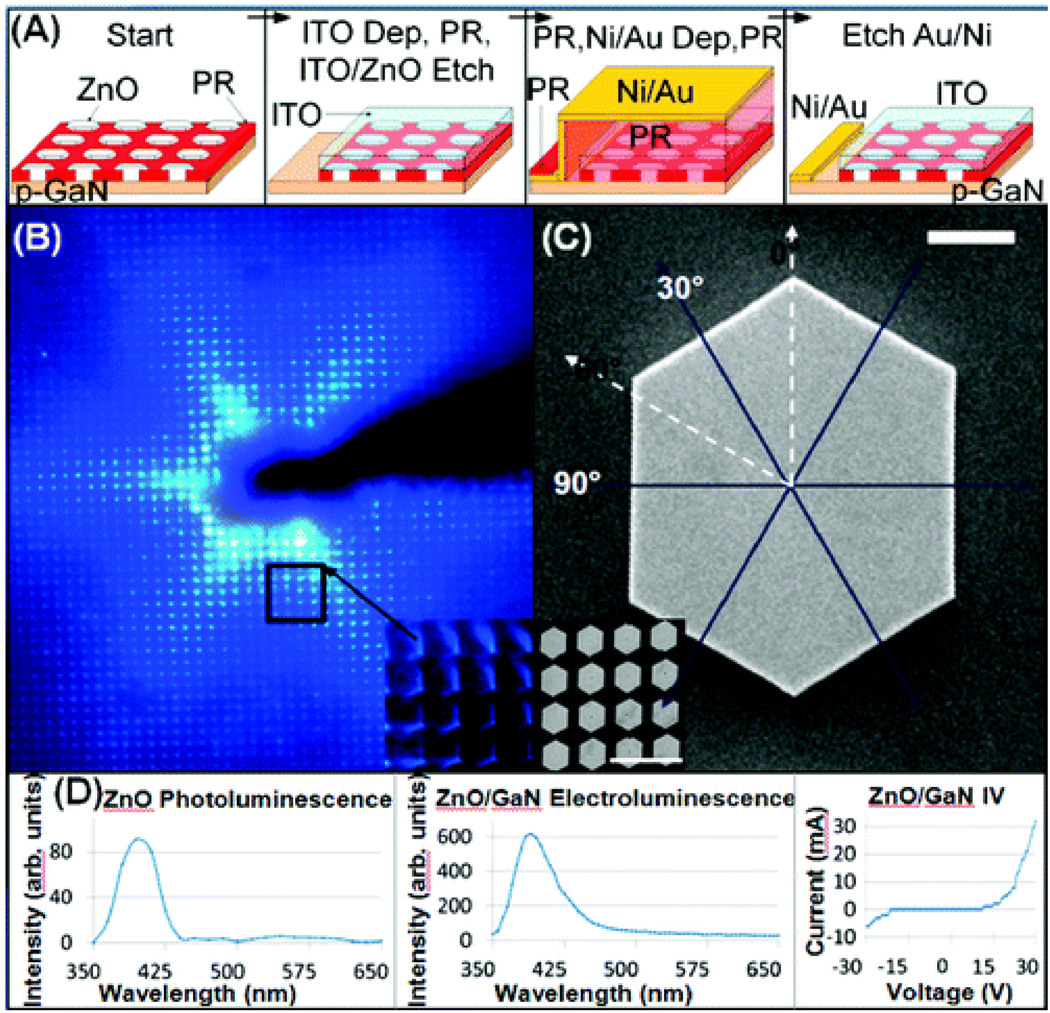
Cole et. al. 171 reported nucleation and growth process for the production of ZnO nanostructures with well-defined dimensions (<1%). They have also demonstrated that applications are n-ZnO/p-GaN heterojunction LEDs (as shown in Figure 21). Their growth process involves an oxygen plasma treatment in combination with a photoresist pattern on magnesium doped GaN substrates to define a narrow sub-100 nm width nucleation region. They have followed the nucleation by lateral epitaxial overgrowth producing single crystal disks of ZnO with desired size over 2 in. wafers. The quality of the reported patterns was high and a single near-band-edge UV peak was observed. Figures 21 show PL and EL spectra, recorded using a scanning monochromator and photomultiplier tube attached to the upright microscope. For PL excitation, they have used a hand-held ultraviolet mercury vapor lamp and 254 nm filter with a sub-350 nm cutoff, UVP, model UVGL-58. In their experimental results, as shown in Figure 21, the absence of deep-level radiative defects in electroluminescence indicates that the p-GaN/n-ZnO interface generated using plasma-defined nucleation is a high quality photonic junction.
Figure 21.
Fabrication and characterization of ZnO microcrystal heterojunction n-ZnO/p-GaN ultraviolet LED. (A) Processing steps. (B) Forward bias emission revealing a six-pointed star which is attributed to facet-to-facet (B inset, C inset) hexagonal propagation with reduced coupling along the 0° and 60° directions. (D) Photoluminescence spectrum of the ZnO, forward bias LED electroluminescence spectrum, and LED IV curve show near-band-edge emission at 3.19 eV and absence of defect peaks in the wavelength range 450–650 nm. 1 µm scale bar in C; 10 µm scale bar in C inset (reprinted with permission from Ref. 171, Copyright 2008, American Chemical Society).
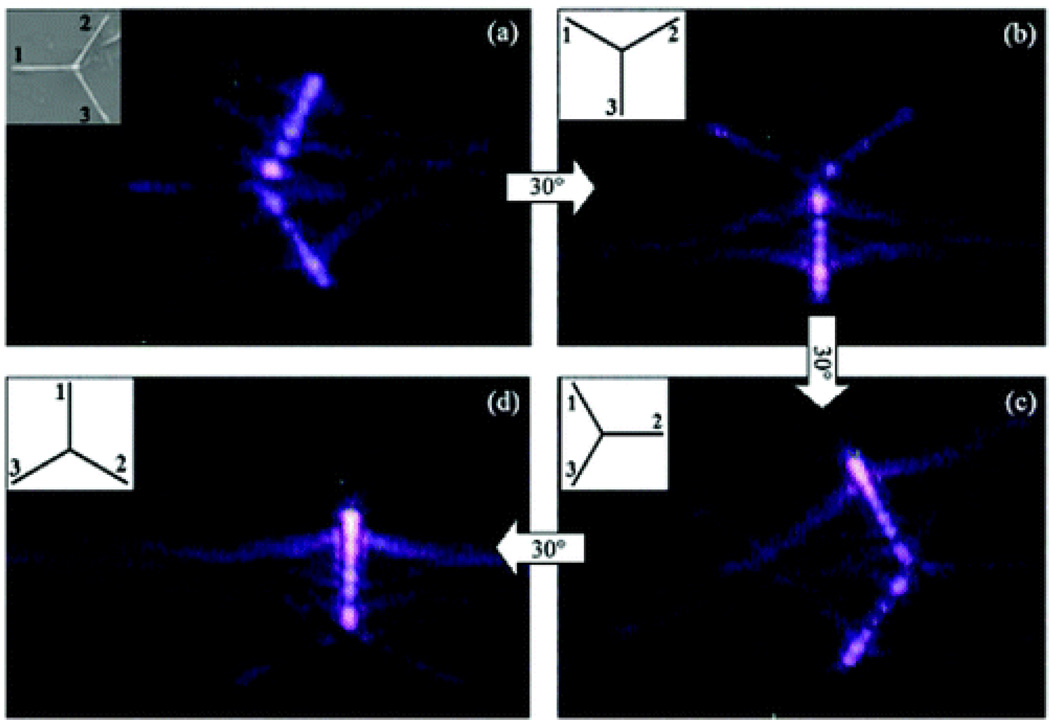
Zhang et. al. 172 reported the observation of SH whispering-gallery modes (WGMs) in the hexagonal cross-sections of the tapered ZnO nanotetrapod legs. Their result demonstrated that (as shown in Figure 22), due to the continuously changing diameter in the leg, several orders of the WGMs at different SH wavelengths could be on resonance simultaneously at different locations along the leg. The strongest SH WGMs occur when the polarization of the fundamental excitation beam is parallel to the c-axis of the crystal along the leg. Observed SH WGMs in ZnO nanostructure can be very useful for nanophotonic devices, such as UV-blue light emitters, nanosensors, and wavelength conversion for nanoscale optical circuitry.
Figure 22.
SH images of the tetrapod with different orientations relative to the polarization of the fundamental excitation. The polarization of the fundamental wave is kept vertical. The tetrapod is rotated 30° clockwise per step from (a) to (d). The orientation of leg 1 starts to be perpendicular to the fundamental wave’s polarization and ends parallel to that (reprinted with permission from Ref. 172, Copyright 2009, American Chemical Society).
4.4. NLO Properties of Single Nanoparticle
SH response from colloidal solutions obscures deeper insights due to the inevitable inhomogeneity of particle shape and size. These ensemble measurements provide information averaged over the nanoparticle size and morphology distributions, and thus, the precise structure-property relationship of individual nanoparticles is obscured. As a result, measurements on a single-particle level are necessary to gain a more complete understanding of the optical properties of nanocrystal and it will permits correlation of SH activity with nanoparticle morphology.
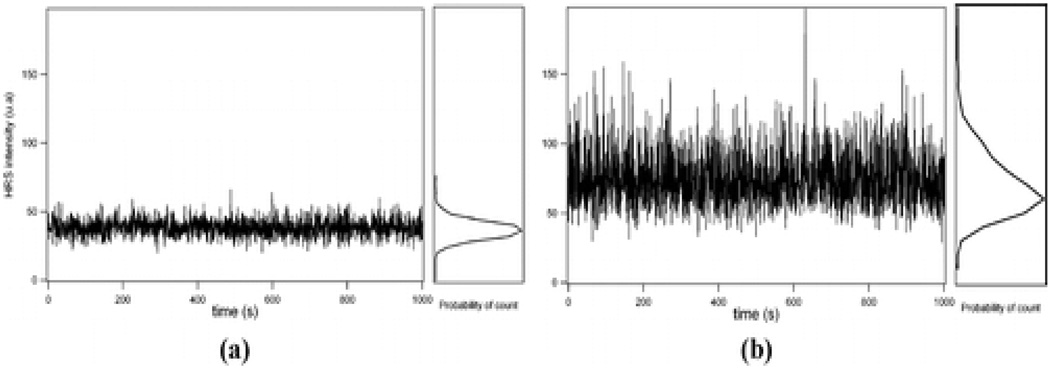
Recently, Duboisset et. al. 62 reported HRS experiment with single metallic nanoparticle detection limit. They have demonstrated that HRS is sensitive enough to be used at the single particle level. In their experiment, a detection limit corresponding to a concentration of 29 fM for 80 nm diameter silver nanoparticles was achieved, corresponding to the detection of a single particle at most present in the volume sampled (as shown in Figure 23). Using an adjustment procedure between the experimental data and the model, the quadratic hyperpolarizability of an 80 nm diameter silver nanoparticle was determined and found to be <β> = (206 ± 20) × 10−25 esu at 800 nm. The value was slightly higher than the ensemble measurements which shows that <β> = (170 ± 20) × 10−25 esu found with the internal reference method.
Figure 23.
(a) (left) HRS counts for 0.5 s periods as a function of time recorded for a bare water cell. (right) Histogram of the counts. (b) (left) HRS counts for 0.5 s periods as a function of time recorded for a 31 fM concentration of 80 nm diameter silver nanoparticles. (right) Histogram of the photon counts (reprinted with permission from Ref. 62, Copyright 2009, American Chemical Society).
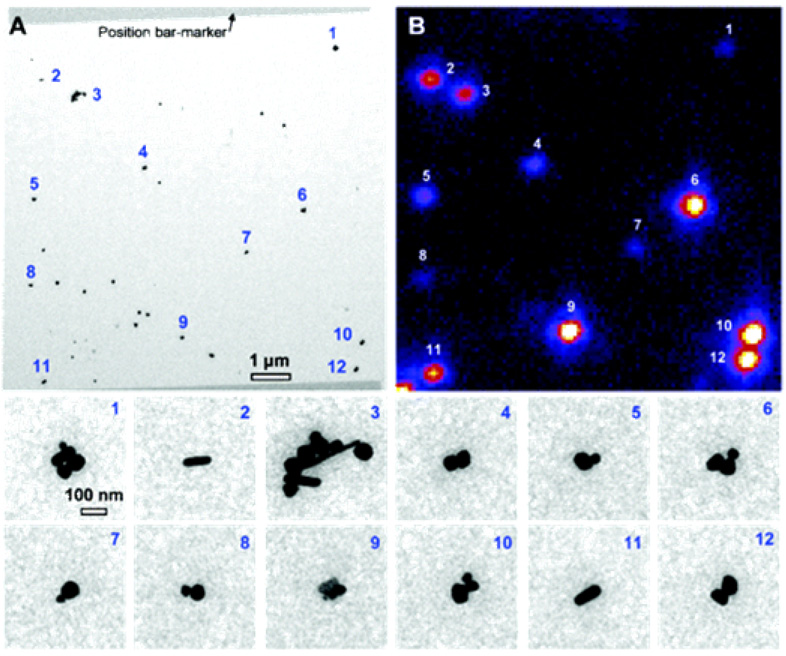
Jin et. al. 87 reported SH activity from single Ag nanoparticles. SH single-particle measurements was achieved by creating position markers on an optical and electron transparent substrate (Si3N4 thin film, ~100 nm), which allows both optical measurements and TEM imaging of the identical nanoparticle. They compared the SH activity of single Ag nanospheres versus single Ag nanorods and how SH activities vary with cluster structures, for dimers and trimers. The direct correlation of single-particle structures and SH activity, spectral and power dependence, strongly suggests one-photon resonant driven nonlinear oscillator response mechanism.
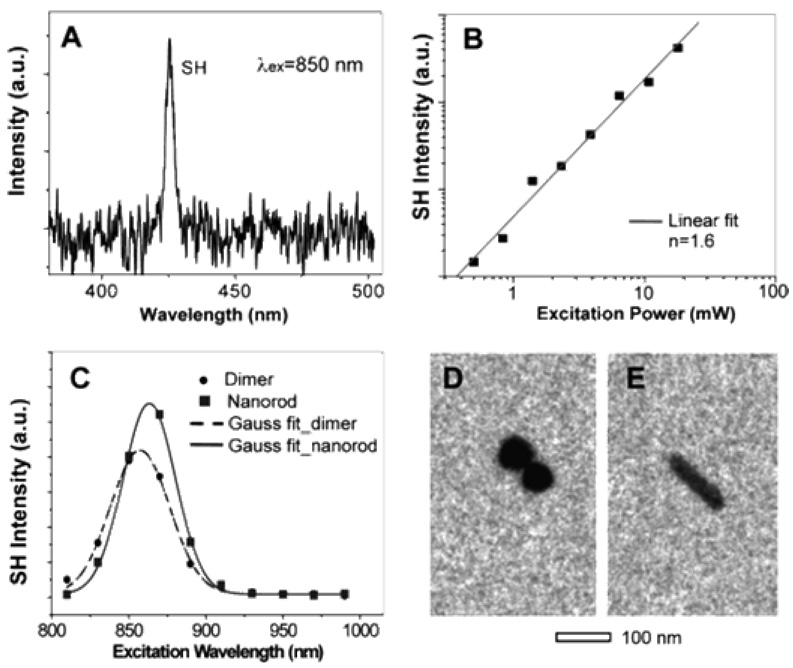
Their results show that Ag nanoparticle clusters and nanorods yield a signal at the SH wavelength (415 nm) when excited with femtosecond pulses (830 nm) (as shown in Figure 24). The trimer structures are most SH responsive, and as a result, SHG signal could be observed at the least optical power, where the SH activity from dimers was less. Their results point out that if the shape of a particle within dimers deviates from spherical, then the dimers can show activity comparable to that of trimers. They are not able to detect SH signal from single spherical Ag particles at 40 GW/cm2 peak power but their experimental results show that it can be detected using higher excitation power (>400 GW/cm2). Interestingly, their results demonstrated that with respect to single spherical Ag particles, nanorods show much greater SH activity (as shown in Figure 25) and it is striking to have to observe how the largest intensities (2, 9, 10, 12) come from the most symmetrical particles, while the clearly non-centrosymmetrical 5, 7, 8 show quite weak signal.
Figure 24.
(A) TEM image of Ag nanoparticles. (B) SHG map (false color image, with white showing the most intense 415-nm signal) of the same area (λex = 830 nm, 3 mW average power, 40 GW/cm2 peak power). The bottom panel shows the zoomed-in images of the labeled particles (reprinted with permission from Ref. 87, Copyright 2005, American Chemical Society).
Figure 25.
SH emission spectrum; (B) the excitation power dependence and fit (λex = 830 nm); (C) excitation spectra of a Ag dimer (TEM image: D) and a nanorod (TEM image: E) (reprinted with permission from Ref. 87, Copyright 2005, American Chemical Society).
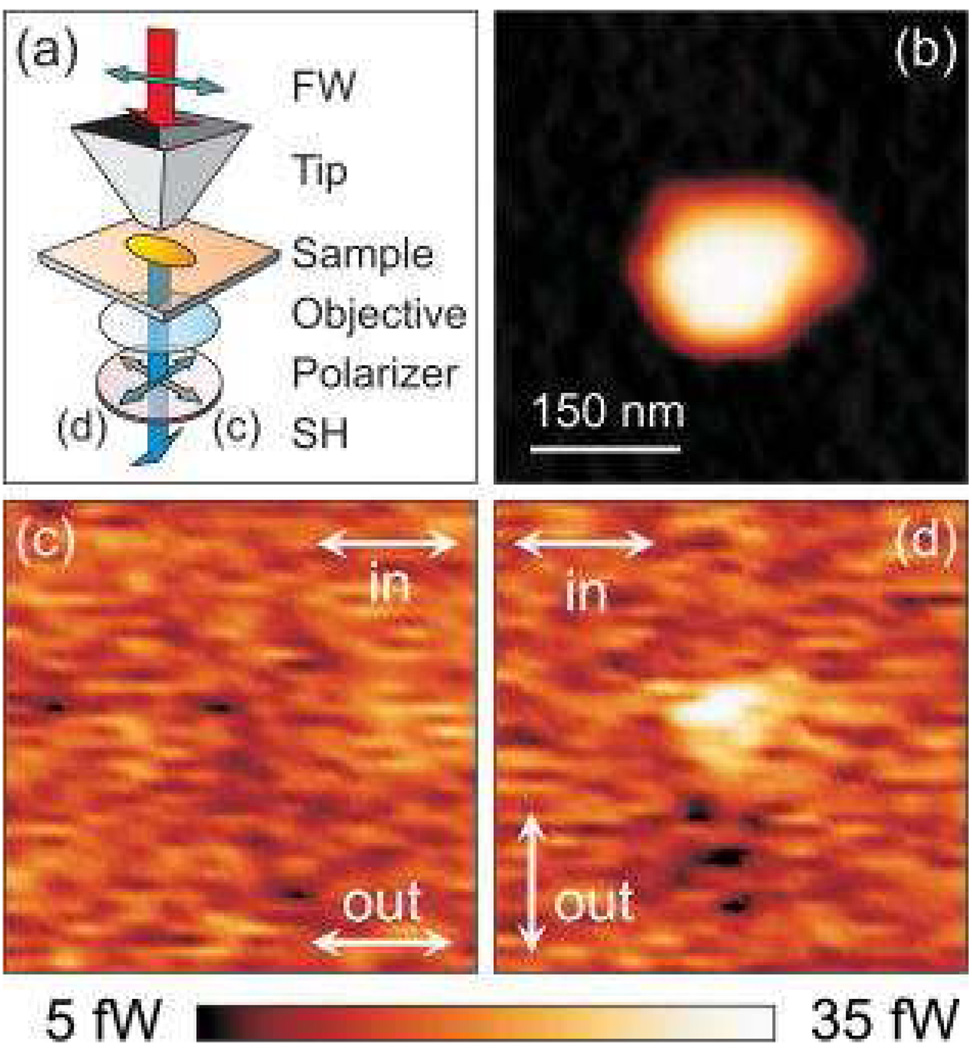
Rossi et. al. 158 have demonstrated SHG from single gold nanoparticles, using a nonlinear aperture scanning near-field optical microscopy and polarized high-peak-intensity femtosecond light pulses. The polarization state of the SH light emitted by the gold nanoparticles was analyzed by a polarizer on detection. Figure 26 shows two typical SH maps of a 150 nm particle.
Figure 26.
(Color online) Polarization of the SH generated by nanoparticles with 150 nm major axis: (a) experimental geometry (the FW light is polarized parallel to the particle major axis), (b) topography, [(c) and (d)] SH emission map with a polarizer on detection parallel (c), and perpendicular (d) to the particle major axis. Image size: 0.45×0.45 µm2 (reprinted with permission from Ref. 158, Copyright 2008, American Institute of Physics).
As shown in Figure 26, their results clearly show that near-field SHG is very sensitive to LSP resonances as well as to the morphology of the nanostructures. Finally, analysis of the polarization state of the emitted SH gives a clear signature of SH emission modes peculiar to near-field excitation.
5. Nonlinear Optical Properties of Nanoparticle Aggregates and Self Assembly
Assembling metal nanoparticles into spatially well-defined architectures is important because new properties often emerge from the aggregates that are distinctly different from the corresponding isolated nanoparticles 43–48. For example, collective nanoparticle behaviors are responsible for large SERS from hot spot and the red–blue color change for gold nanoparticle due to the aggregation 90–129, which are currently being exploited in a number of colorimetric assays and will be discussed in detail in later section of this review. The performance of many emerging nanoscale electronics technologies highly depends on the ability to organize nanoparticles and optimize capacitive or dipole coupling in the resulting assembly.
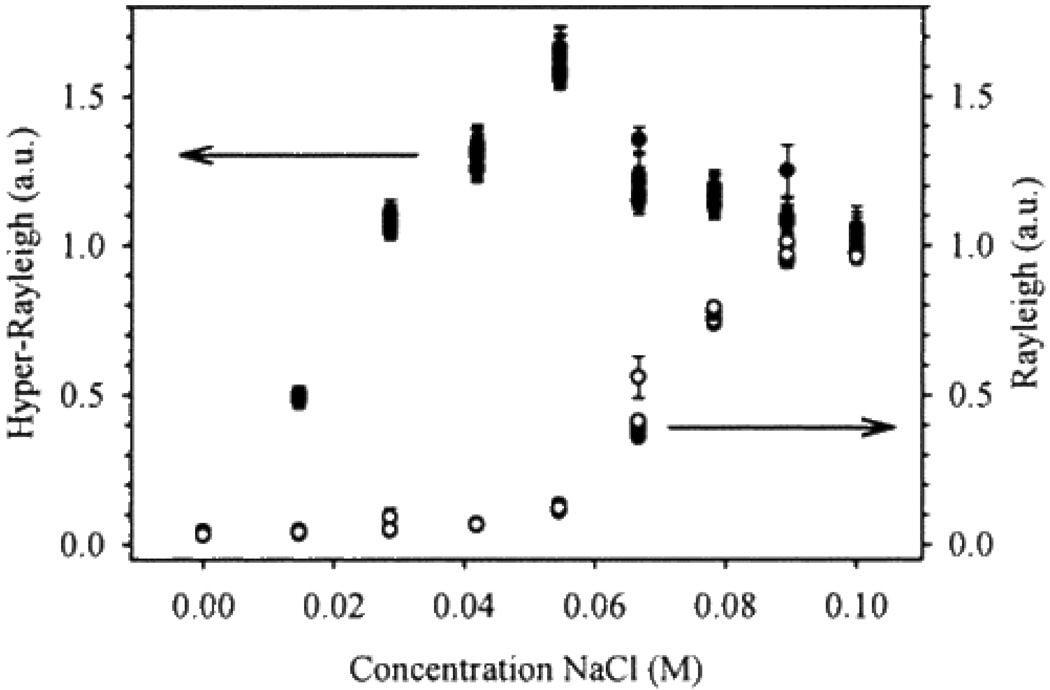
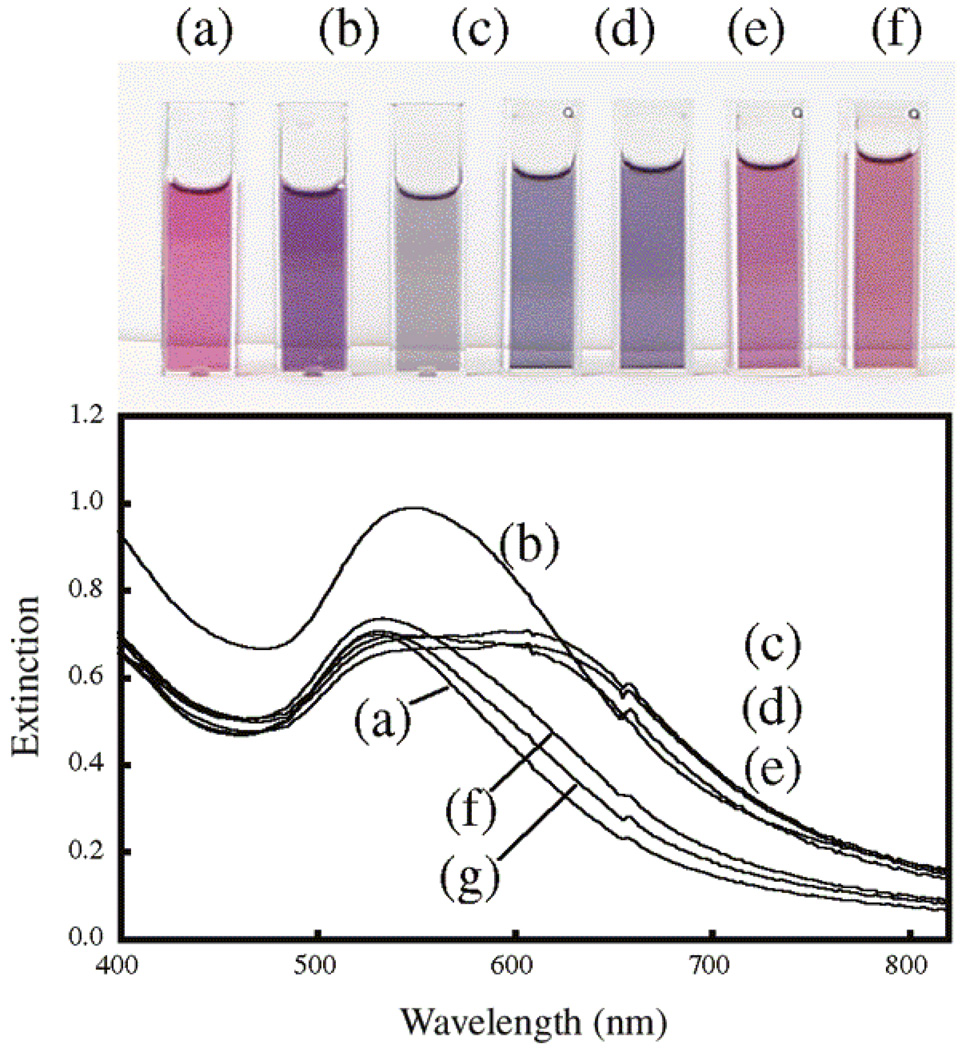
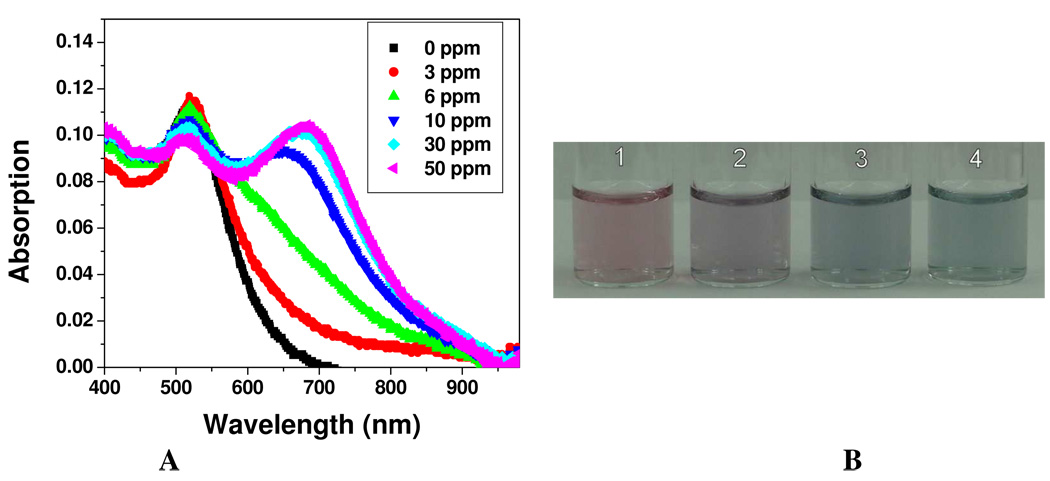
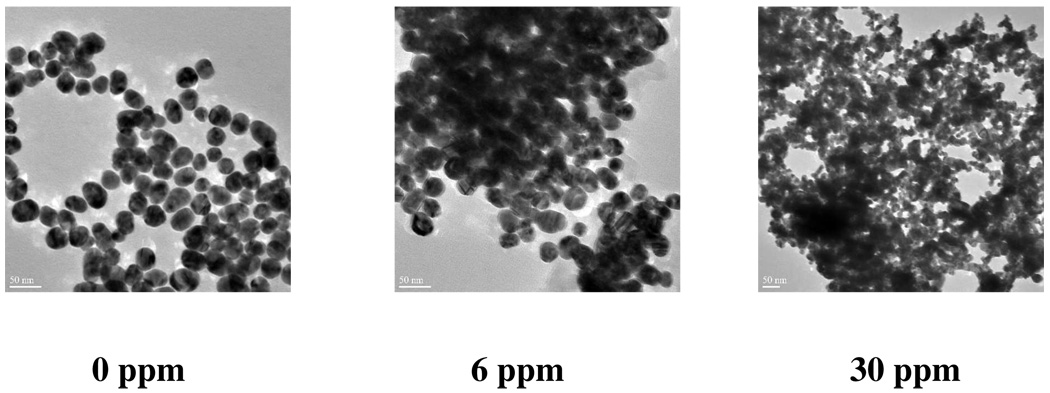
Collective nanocluster behaviors can be assessed using (i) salt-induced aggregation, (ii) Langmuir techniques and (iii) surface assembly. Vance et. al. 43 have reported for the first time that β increased more than 10-fold upon the addition of salt (as shown in Figure 27), likely due to the formation of non-centrosymmetric particle aggregates. Their experimental observation using 800 nm incident light clearly shows that after certain amount of salt addition, the color of the gold nanoparticle changes from red to blue colloid color. The change is mainly due to large aggregate formation. As shown in Figure 27, the expected increase in Rayleigh scattering is almost unobservable when only small amounts of electrolytes (≤30 mM) are added.
Figure 27.
Effect of NaCl addition upon Rayleigh and hyper-Rayleigh scattering signal intensities. The scattering scales are arbitrary (reprinted with permission from Ref. 43, Copyright 1998, American Chemical Society).
In contrast, their results clearly demonstrate that the intensity of HRS increases by at least an order of magnitude in response to the same solution compositional changes, which indicated that two-photon Rayleigh scattering is more sensitive for finding nanoparticle aggregation than the single photon Rayleigh scattering.
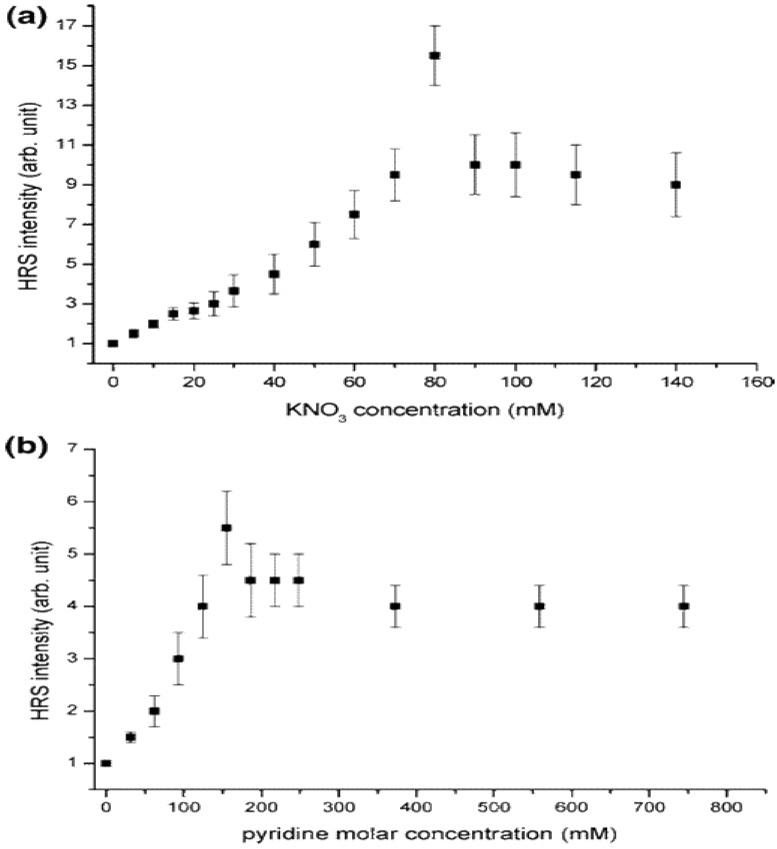
Wang et. al. 72 showed how SH response varies for silver colloids with the addition of KNO3 and pyridine (as shown in Figure 28) using 1064 nm incident light. Their results show strongly enhanced HRS signals by 15× and 6× times, upon the addition of KNO3 and pyridine, respectively. TEM measurements demonstrated that the morphology of aggregated silver nanoparticles is like a chain. The dramatically enhanced second-order nonlinearity was explained by the enhanced EM field near the surface of the silver nanoparticles. The different enhancement between aggregates formed by KNO3 and pyridine was explained due to the diversity of separated distance between silver nanoparticles. Their experimental results also show that there is an optimum size for the aggregates to yield the maximum HRS signal.
Figure 28.
HRS intensity as a function of KNO3 concentration. (b) HRS intensity as a function of pyridine concentration (reprinted with permission from Ref. 72, Copyright 2005, American Chemical Society).
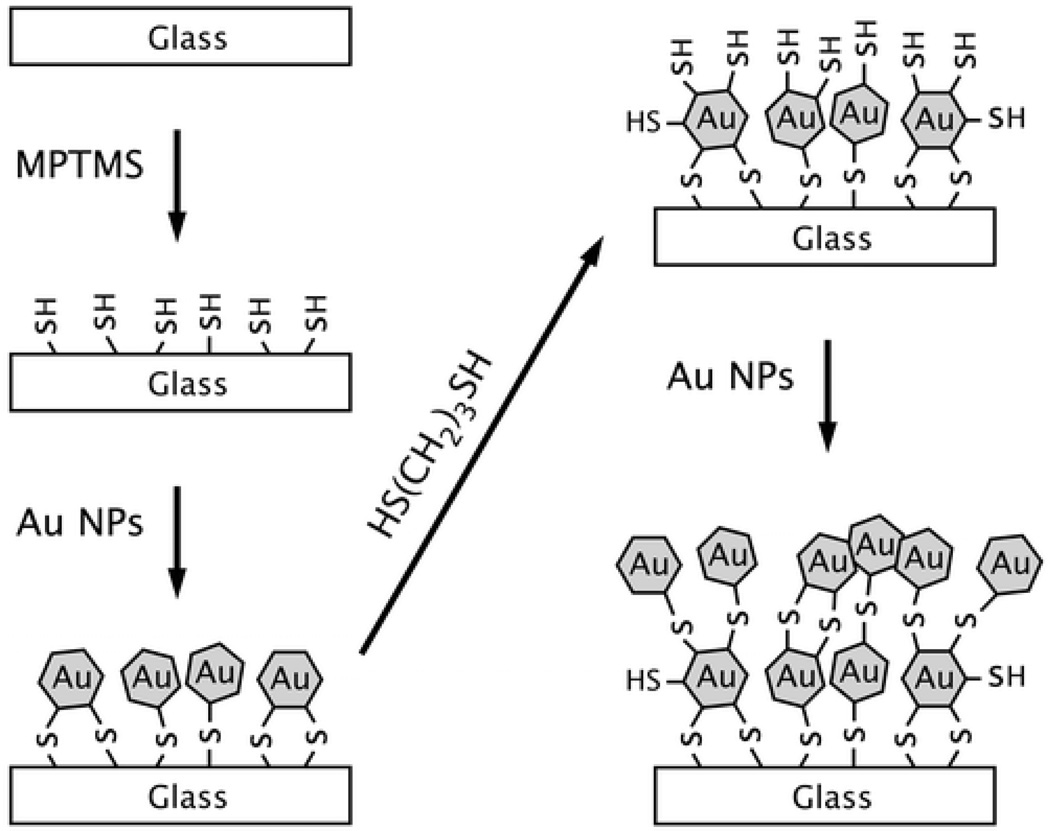
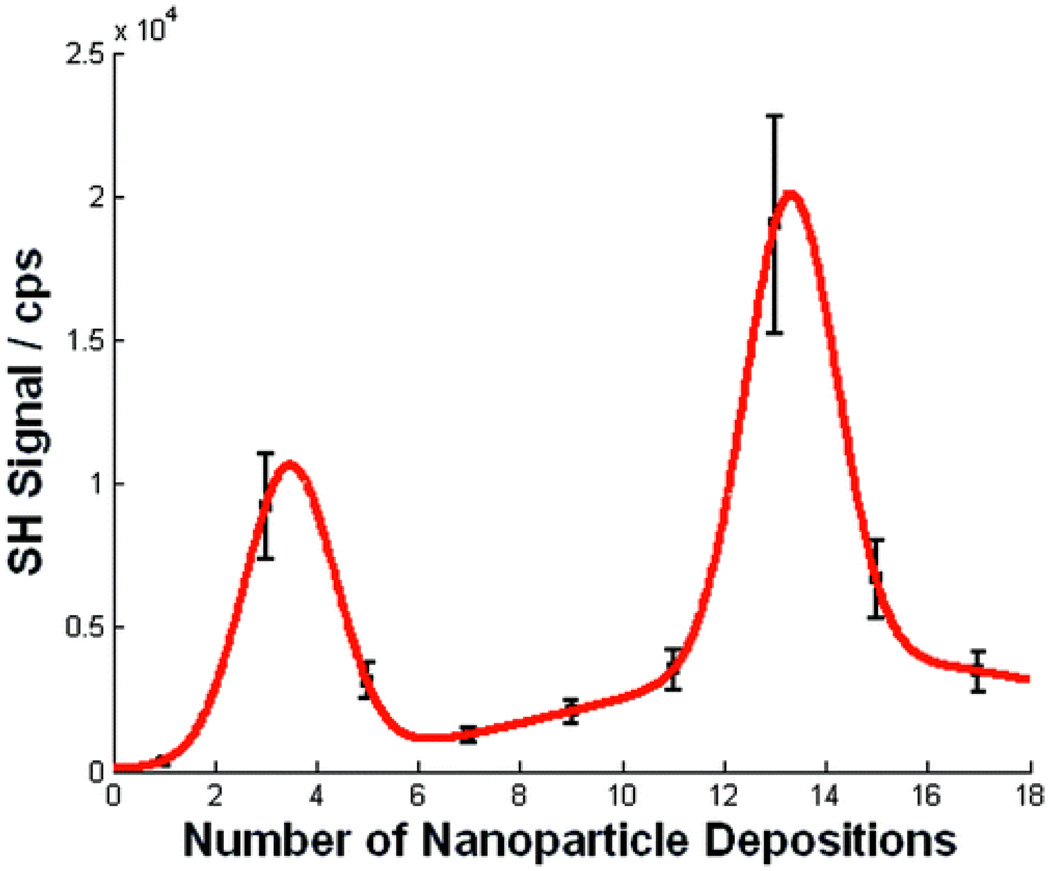
Novak et.al. 45 reported exceptionally large collective SH responses from gold nanoparticle arrays connected by molecular bridges. The extraordinary values are mainly due to the two-photon resonance interactions with the colloids' intense plasmon band. Their experimental values no doubt would be smaller under conditions of pre-resonance with the plasmon absorption band. Addison et. al. 159 demonstrated that NLO enhancement factor can be tailored by varying the Au NP layers deposited on glass. The SH signal was measured for substrates with different numbers of Au NP deposition (as shown in Figure 29 and 30). Their experimental observation point out that maximum enhancement can be observed for 13 nanoparticle layers. When a substrate with 3 Au NP depositions was tested, SH signal near 10000 cps was obtained. However, their result shows that 5–11 Au NPs deposition steps decrease the SH signal to the 1500–3000 cps range. Upon further deposition steps, the SH signal increases again to a maximum of 19000 cps obtained for 13 Au NP depositions. Substrates prepared with 15 and 17 Au NP layers yield SH signals of 6500 and 3500 cps, respectively. The increase in the efficiency of the nonlinear effect was attributed to an increase in the local field due to SP excitations at frequencies that match at least one of the fields involved in the nonlinear phenomenon. Their result clearly shows that one can tune the nanostructure substrates to yield maximum NLO response based on the number of nanoparticle depositions that are performed.
Figure 29.
Schematic showing the construction of the nanoparticle substrates using the alternate immersion of solutions of gold nanoparticles and a dithiol linker molecule (reprinted with permission from Ref. 159, Copyright 2009, American Chemical Society).
Figure 30.
SHG signal of NP-containing substrates obtained using 820 nm fundamental radiation with 200 fs pulse duration and 10 nJ pulse energy at a 5 MHz repetition rate. Data was collected at a 45° incidence angle. p-Polarized radiation was used exclusively for the fundamental and the second harmonic. The maximum SHG signal is observed for 13 NP depositions (reprinted with permission from Ref. 159, Copyright 2009, American Chemical Society).
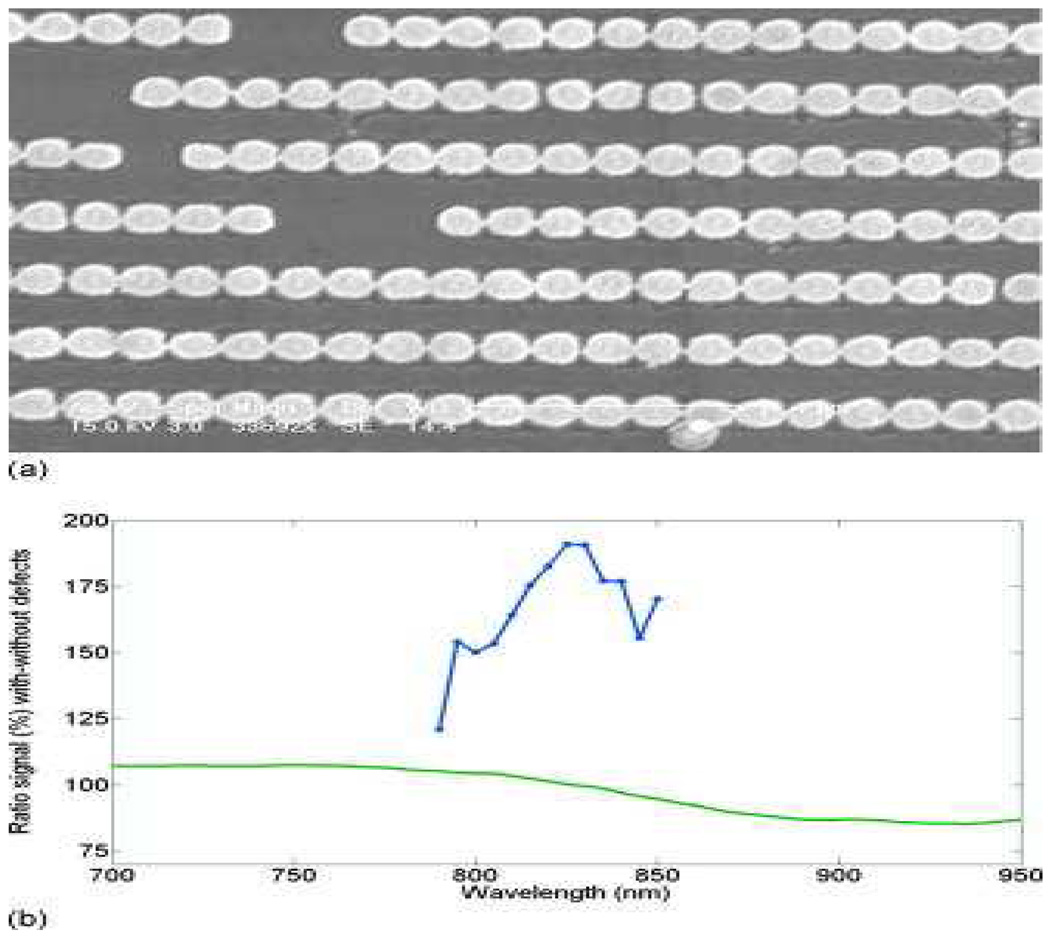
Lesuffleur et. al 160 reported SHG from chains of gold nanoparticles interconnected with metallic bridges. Their experimental results indicate that there was 30 times SHG enhancement when a surface plasmon resonance was excited in the chains of nanoparticles, which was influenced by coupling due to the electrical connectivity of the bridges. This enhancement was also confirmed theoretically by rigorous coupled wave method calculations and came from high localization of the electric field at the bridge.
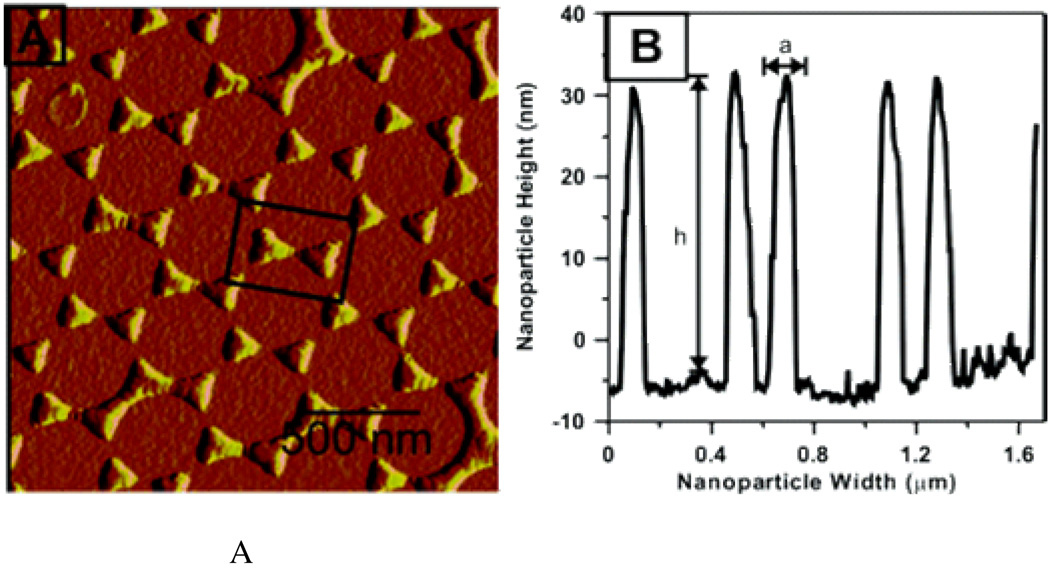
Figure 31 shows the spectral variation in the ratio between the optical signal from the arrays with and without defects for both SHG and the linear measurements with the polarization of the electric field along the chains. Their report clearly shows that while the linear signal varies slightly around a factor of 100%, SHG ratio reaches a maximum value of 190% for the fundamental beam at 830 nm to be compared with the sample with defects. It is also interesting to note that the ratio depends on the fundamental wavelength, suggesting that it is related to a specific resonance of the chain. Moran et. al. 68 reported NLO properties of silver nanoparticle arrays fabricated by nanosphere lithography, as shown in Figure 32. In their report, the extinction spectra and SHG were measured for various orientations and polarizations using a tunable femtosecond laser.
Figure 31.
(a): SEM image of the array with 10% random defects. (b) Ratio of the SHG and linear optical reflectivity between the array without and with defects (reprinted with permission from Ref. 160, Copyright 2008, American Institute of Physics).
Figure 32.
AFM image of a sample prepared with a nanosphere diameter of 390 nm. The perpendicular bisector, a, of the triangular base is 100 nm, and the interparticle distance is 294 nm. The box depicts the centrosymmetry of particle pairs present in the sample. (B) A line scan of the sample in (A) verifies the theoretical calculations with a = 104 nm and a height = 52 nm (reprinted with permission from Ref. 68, Copyright 2005, American Chemical Society).
A Single-layer nanoparticle arrays were prepared with the nanosphere lithography technique. Particle height (25–50 nm) was achieved during the first deposition. After that, the height of the Ag film was increased to 50 nm. The nanoparticle portion of the cover slip was masked with Al foil during the second deposition. During optical measurements, the nanosphere masks were removed by sonication in absolute ethanol for approximately 5 min.
Figure 33 shows the SHG excitation profile, measured for p:p polarization conditions at incidence angles of 10 and 45° for four different particle arrays. The enhancement factor is the ratio of the SH signal from the array divided by SH from the silver film. Their polarization and orientation dependent measurement results show that SHG is enhanced by a LSPR mode polarized out-of-plane, which was not observed in the linear spectrum because of its weak extinction. Their finding also indicates that absolute signals for 10° were 7–15 times weaker than those at 45°. The absolute integrated SH count for p:p polarization at 45° was 2000 counts/s.
Figure 33.
SHG enhancement for nanoparticle arrays (NP) divided by SHG from the Ag film (Film) (connected points) measured for (a and b) p-in/p-out at 45° incidence and (c and d) p-in/p-out at 10° incidence. The extinction spectrum (continuous curve) is shown for comparison. All profiles are on different samples (reprinted with permission from Ref. 68, Copyright 2005, American Chemical Society).
6. Nonlinear optical properties of Nanocomposites
Polymer composites have been extensively studied due to their large optical nonlinearities, low dielectric constants, ease of preparation, and low cost. With the advent of nanocrystal (NC) technology, several efforts are undergoing for establishing a novel class of inorganic–organic hybrid photoconductive materials 30,162–168. Hybrid nanomaterials made of organic and inorganic nanomaterials are expected to produce noble and innovative functions that might not be achieved from either component alone. Construction of hybrid nanoassemblies requires well-ordered and uniform accumulation of hybrid nanomaterials at the nanointerface. Ishifuji et. al. reported 30 that the hybrid polymer nanoassemblies of NLO polymer nanosheets with Au NPs provide enormous SH light enhancement derived from a coupled LSPR.
They have fabricated hybrid polymer nanoassemblies consisting of NLO polymer nanosheets and gold nanoparticles (Au NPs) using, LB technique and immersion method: a single-layer structure and a sandwich structure (as shown in Figure 34). Their results clearly show that localized surface plasmon (LSP) coupling from adjacent Au NPs enhanced the SH light intensity efficiently. They have investigated the distance-dependence of SH signal by inserting a pDDA spacer between NLO polymer nanosheets. As shown in Figure 35, they have shown that the SH light intensity decreased exponentially. From fitting with a single exponential function, they have shown that effective LSP coupling for SH light enhancement occurred within a distance of 8.4 nm from the Au NP monolayer. Their distance dependent results demonstrate that dipole-like LSP coupling at the fundamental frequency dominates SHG enhancement from hybrid polymer nanoassemblies. Their results show the tremendous possibilities of hybrid polymer nanoassemblies for opening up new scientific fields related to nano-optics and nanophotonics based on bottom-up approaches.
Figure 34.
Schematic illustration of hybrid polymer nanoassembly fabrication (reprinted with permission from Ref. 30, Copyright 2009, American Chemical Society).
Figure 35.
SH light intensity from a single-layer structure as a function of the separation distance between Au NPs (30 nm) and a p(DDA/DR28) nanosheet (inset) (reprinted with permission from Ref. 30, Copyright 2009, American Chemical Society).
Kulyk et. al. 162 reported SHG properties of the ZnO/PMMA nanocomposite films. They have measured the SHG properties by rotational Maker fringe technique for the s-polarized fundamental beam. Figure 36 shows the dependences of SH intensity from ZnO/PMMA nanocomposite films of both types on its ZnO NCs concentrations and ZnO equivalent thickness. The nanoparticles of ZnO embedded into PMMA show quite high second order nonlinearity at low ZnO NCs concentration and their results show that SHG signal increases with ZnO NCs concentration. Films with higher concentration of ZnO nanocrystals show stronger second harmonic signal for the identical input intensities and it is mainly due to the larger interaction thickness of the nonlinear medium. Their results also indicate that even for input intensities in the range of 23 GW/cm2, no structural change or damage of the samples occurred.
Figure 36.
SH intensity per square of input laser intensity in ZnO/PMMA nanocomposite films on its ZnO NCs weight concentrations and ZnO equivalent thickness (reprinted with permission from Ref. 30, Copyright 2009, American Chemical Society).
Ding et. al. 161 reported NLO properties from a novel multifunctional inorganic–organic photorefractive (PR) poly(N-vinyl)-3-[p-nitrophenylazo]carbazolyl-CdS nanocomposites with different molar ratios of CdS to poly(N-vinyl)-3-[p-nitrophenylazo]carbazolyl (PVNPAK). Their results show that PVNPAK matrix possesses a highest-occupied molecular orbital value of about −5.36 eV determined from cyclic voltammetry. SHG was observed in PVNPAK film without any poling procedure and 4.7 pm/V of effective second-order nonlinear optical susceptibility was obtained. The CdS particles as photosensitizers had a nanoscale size in PVNPAK obtained using transmission electron microscopy, as shown in Figure 37.
Figure 37.
TEM images of PVNPAK-5-CdS (a) and PVNPAK-15-CdS (b) nanocomposites. The chemically hybridized CdS-PVNPAK nanocomposite samples were prepared by the sulfonation of PVNPAK, the preparation of the precursor PVNPAK(SO3)2Cd, and the in situ formation of CdS-PVNPAK nanocomposite (reprinted with permission from Ref. 161, Copyright 2008, American Chemical Society).
The estimated average size of CdS nanoparticles was ~5 nm in PVNPAK-5-CdS nanocomposite as shown in Figure 37. The significant enhancement of photoconductivity in chemically hybridized PVNPAK-CdS nanocomposites was obtained due to the charge carrier transport through the interface between PVNPAK and CdS nanoparticles. Their results show that the NLO chromophore possesses strong mobility and orientation, which allowed them to perform the photorefractive experiments without applying an external electric field if the Tg of materials is sufficiently low. Lambert et. al.165 developed LiIO3/laponite nanocomposite thin films to form waveguides with quadratic nonlinear optical properties. Films were dip-coated and annealed to induce LiIO3 crystallization. Their result indicates that SHG signal depends on the nanocrystal orientation distribution and structure. Jeremie et. al. 166 synthesized transparent SiO2-based nanocomposites (50–200 nm size) with LiIO3 nanocrystals using the sol–gel method. It has been shown that since LiIO3 crystallizes in the matrix with α hexagonal structure, it exhibits NLO properties. Their result shows that second harmonic signal can be observed in both bulk samples and thin layers and SHG intensity depends clearly on LiIO3 concentration. Their experiments confirm the feasibility of a composite material based on LiIO3 exhibiting non-linear optical properties.
7. Application in Chemical and Biological Monitoring
Metal nanoparticles have attracted great scientific and technological interest in biomolecular detection and clinical diagnostic application due to their specific physical and chemical characteristics. Several recently reported experimental results illustrated that nanomaterial based NLO assay can be used for monitoring chemical processes, biological and chemical toxins with excellent sensitivity and selectivity 46, 58–63, 67–68, 75, 81. Several articles demonstrated that NLO based assay is rapid and it can be three orders of magnitude more sensitive than the usual colorimetric technique. Assay equipment consists of three main parts, a laser source, a light path, and a detector (photomultiplier tube), so it is easy to set up and is simple to use.
7.1. Application in Chemical Process Monitoring
The observation of significant hyperpolarizability associated with nanoparticles suggested that SHG could be used to monitor the formation and growth of these particles. Using the size-dependent hyperpolarizabilities, Segets et. al. 58 demonstrated quantitative determination of nucleation, growth, and ripening rates via in situ HRS measurements during synthesis of sub-10 nm ZnO nanoparticles. Using millisecond time-resolved investigation of the ripening process, they found an increase in the particle hyperpolarizability, βZnO, due to the increase particle size during growth process. Figure 38 shows the temporal evolution of the HRS signal for three different time resolutions of 20, 50, and 100 ms, respectively. In region I, solvent and zinc acetate signals were observed.
Figure 38.
HRS signals during the early stages of precipitation monitored for three different time resolutions (circles, 100 ms; squares, 50 ms; crosses, 20 ms). Four different regions can be discerned: (I) only one reactant, (II) nucleation, (III) growth, (IV) ripening. Note that the absence of data points (100 ms resolution) between 11 and 13 s was due to drop-out of the laser (reprinted with permission from Ref. 58, Copyright 2009, American Chemical Society).
Region III is related to particle growth in the supersaturated solution, leading to a signal increase with increasing particle diameter. Region IV is due to the fact that the super saturation is continuously reduced and as a result, particle growth slows down. Due to this, HRS signal remains almost unchanged. So their results clearly demonstrated the capability of nanoparticle based NLO technique to study chemical growth processes. Sahyun et. al. 73 have shown that size dependent hyperpolarizability associated with TiO2 nanoparticles can be used to monitor the formation and growth of TiO2 nanoparticles‥ Figure 39, shows how the HRS intensity change during the growth of TiO2 nanoparticles. By fitting the data with pseudo-first order kinetics, a formation constant of 0.025 min−1 was estimated. This rate of formation of the nanoparticles measured by them is consistent with a standard reaction time of ca. 2 h, as reported in the literature.
Figure 39.
Kinetics of formation of TiO2 nanoparticles as monitored by HRS of 800 nm radiation (reprinted with permission from Ref. 73, Copyright 2002, Elsevier).
Yagi et. al. 173 demonstrated that the SHG method can be used to monitor surface phenomena even when the bulk SHG signal is significant. They have shown that in situ optical SHG technique can be employed to investigate the shape and density of Cu nanoclusters, formed on p-GaAs(001) electrode surfaces electrochemically. Both in situ SHG and ex situ AFM methods were used to characterize Cu nanoclusters electrochemically deposited on n-GaAs(001) electrodes in the initial stages of Cu film formation. Their result shows that, while bulk SHG signals from p-GaAs(001) monotonically decreased with the amount of electrodeposited Cu on the surface, increase in surface SHG was observed only when discontinuous flattened Cu nanoclusters with relatively large volume (diameter>30 nm, height >5 nm) were formed on the GaAs(001) surface. Figure 40, shows the time-dependent p-in/p-out SH intensities at the azimuthal angle of 90° during Cu deposition at various deposition potentials. In their experimental arrangement, only the surface SHG can be monitored. Their results demonstrated that the SHG signal is very sensitive to the number of oblate or flattened Cu nanoclusters with lateral diameter larger than 30 nm and they have shown that the SHG enhancement occurred because of resonant coupling between the surface plasmon induced in the flattened Cu nanoclusters and the near-infrared fundamental light.
Figure 40.
Three-dimensional plot of time-dependent p-in/p-out SHG intensity transients at p-GaAs(001) electrode in 0.1 M H2SO4 solution containing 1 mM of CuSO4. Azimuthal angle was fixed at 90°. The electrode potential was stepped from +100 mV to each deposition potential at t = 0 s (reprinted with permission from Ref. 173, Copyright 2005, American Chemical Society).
7.2 Application in Biological Sensing
In the last two decades, the field of biosensors using nanomaterial has witnessed an explosion of interest in the use of nanomaterials in assays for DNA/RNA, protein and cell markers for many diseases as well as the detection of virus and bacteria from environmental samples 96–110. Intense research has been fueled by the need for practical, robust, and highly sensitive and selective detection agents that can address the deficiencies of conventional technologies. In the coming decade, the ability to sense and detect the state of biological systems and living organisms optically, electrically and magnetically will be radically transformed by developments in material physics and chemistry 96–110. The emerging ability to control the patterns of matter on the nanometer length scale can be expected to lead to entirely new types of biological sensors. These new systems will be capable of sensing at the single-molecule level in living cells, and capable of parallel integration for the detection of multiple signals, enabling a diversity of simultaneous experiments, as well as better crosschecks and controls. Due to the lack of toxicity, scientists have shown great interest to use gold nanosystems for sensing and imaging 97–110. Most ultra sensitive assays identify specific analyte after the target has been modified with a covalently linked label such as a fluorescent or Raman dye 97–107. Problem of photobleaching of fluorescent and Raman dyes as biological labels and has been common over the last few decades. Recently, several groups have demonstrated that gold nanomaterial NLO properties based assay could achieve the ultra-sensitive detection of biological and chemical toxins using HRS technique 46, 58–63, 67–68, 75,81. Unlike dyes, metal nanoparticles are photostable and do not undergo photobleaching, allowing higher light excitation energies and longer probing times. Also HRS technique can be easily applied to study a very wide range of materials, because electrostatic fields and phase matching are not required. Several articles 46,58–63,67–68,75,81 have also demonstrated that HRS technique is 1–2 orders of magnitude more sensitive than the usual colorimetric technique and the onset of HRS enhancement can be observed much before any visible color change occurs.
Ray 67 has demonstrated a gold nanoparticle based nonlinear optical assay for ss-DNA/RNA sequence recognition in sub nanomolar to picomolar level based on the difference in electrostatic properties between ss-DNA/RNA and ds-DNA/RNA. Their detection is based on the fact that double and single-stranded oligonucleotides have different electrostatic properties as shown in Figure 41. When ss-DNA/RNA is adsorbed onto the nanoparticle, due to conformationally flexible backbone of a single-stranded DNA/RNA, a favorable conformation for the adsorbed oligos is an arch-like structure, in which both the 3'- and 5'-ends are attached to the particle.
Figure 41.
Schematic representation of the DNA/RNA hybridization process. The circle represents colloidal gold nanoparticles. Dots in SS-DNA/RNA represent one base pair mismatch (reprinted with permission from Ref. 67, Copyright 2006, Willey -VCH).
Upon target binding, due to the duplex structure, the double-strand (ds) RNA does not adsorb onto gold and as a result, gold nanoparticle undergoes aggregation (as shown in Figure 42).
Figure 42.
Plot of HRS intensity change vs. target RNA {exact complementary of 75 base pair HCV genome RNA and one base pair mismatch} concentration in pico molar level (reprinted with permission from Ref. 75, Copyright 2009, Willey -VCH).
Figure 42 shows how the HRS intensity varies after the addition of target RNA into probe HCV-RNA. A very distinct HRS intensity change has been observed after hybridization even at the concentration of 100 pico-molar probe ss-RNA. The HRS intensity changes only 7% when they added the target RNA with one base-pair mismatch with respect to probe DNA (as shown in Figure 42).
Since the ds-RNA cannot uncoil sufficiently like ss-RNA to expose its bases toward the gold nanoparticles, repulsion between the charged phosphate backbone of ds-RNA and negatively charged ions from the gold nanoparticles surface dominates the electrostatic interaction, which does not allow ds-RNA to adsorb onto gold nanoparticles. As soon as the ds-RNA separated from gold nanoparticle, a second effect, aggregation of gold nanoparticle has been observed as evidenced by TEM image (Figure 43), which has been further confirmed by colorimetric studies (Figure 43). This is due to the screening effect of the salt, which minimizes electrostatic repulsion between the oligonucleotide-modified particles, allowing more hybridization events to take place, leading to more linked particles and hence larger damping of the surface plasmon absorption of Au nanoparticle surfaces.
Figure 43.
A) Photograph showing colorimetric change upon addition of 1) 40 nM complimentary RNA, 2) 10 nM complementary RNA, 3) 3 nM complementary RNA, 4) 1 nM complementary RNA, 5) 40 nM complementary RNA with one base pair mismatch and 6) only gold nanoparticle. 43B) TEM image of gold nanoparticles after hybridization. 43C) Absorption profile of RNA coated Au nanoparticles before and after hybridization with 10 nM concentration of probe RNA (reprinted with permission from Ref. 75, Copyright 2009, Willey -VCH).
After hybridization, the HRS intensity change can be due to several factors and these are as follows. (1) Since after hybridization, aggregation takes place, nanoparticles lose the center of symmetry and as a result, one can expect significant amount of electric-dipole contribution to the HRS intensity. (2) The second contribution is multipolar contribution like electric-quadrupole contribution. This contribution is very important when aggregation occurs due to the addition of complementary DNA/RNA. Since after aggregation, the size of the particle is no longer negligible compared to the wavelength, one cannot neglect multipolar contribution, as we and others reported before 67,75. As a result, after aggregation one can expect very high multipolar contribution. 3) When target RNA with complementary sequence is added to the probe RNA, a clear colorimetric change is observed due to the aggregation. As a result, absorption spectrum shifted 150 nm far, as shown in Figure 43 C. Now this new absorption band can influence the HRS intensity very highly due to single photon resonance. According to the two-state model, 142
| (20) |
where ω is the fundamental energy of the incident light, μeg is the transition dipole moment and ωeg is the transition energy between the ground state |g> and the charge-excited state |e>, Δμeg is the difference in dipole moment between |e> and |g> states. Since ωeg ∝ 1/λmax, β should change tremendously upon the addition of complementary DNA/RNA and as a result, the two-photon scattering intensity should change tremendously with the addition of complementary RNA/DNA. (4) Since size increases tremendously with aggregation, the HRS intensity should increase with the increase in particle size. Several authors have shown 47,59,75,174–175 that this nonlinear optical assay will have several advantages and these are: a) one can detect RNA sequence with only metal nanoparticle labeling.; b) it can be two orders of magnitude more sensitive than the usual colorimetric technique; c) single base-pair mismatches are easily detected.
Zhang et. al. 174 reported nonlinear optical scattering based a potential immunoassay technique for antigen detection using antibody-modified gold nanoparticles (as shown in Figure 44).
Figure 44.
Graphical scheme of gold–IgG conjugation and gold–IgG aggregation induced by antigen. Gold nanoparticles were combined with IgG to form the conjugates; then the conjugates were aggregated through antigen (reprinted with permission from Ref. 174, Copyright 2003, Elsevier).
Their experimental results show that the HRS signals from the IgG-coated gold nanoparticles greatly increased when the antigen was added due to gold nanoparticle aggregation. When they added human IgG into the goat-anti-human IgG–gold nanoparticles solution, HRS intensity increases tremendously (as shown in Figure 45). It is due to the fact that in the presence of human IgG, IgG–gold nanoparticles undergo aggregations due to antigen-antibody interaction. Their experimental results clearly show that when the concentration of the antigen is 10 µg/ml, the HRS intensity shows a measurable variation, while in the colorimetric assay, the extinction scale changed little until the antigen concentration is 100 µg/ml (as shown in Figure 45). Their result also demonstrated that the HRS signal of the nonlinear optical effect would be more sensitive than the colorimetric signal of the linear optical phenomenon in detecting the aggregation states of the nanogold particles. Therefore, the HRS system could be a potentially sensitive method to determine the antigen in aqueous samples on the basis of the aggregation interaction between antigen–gold bioconjugate and antigen.
Figure 45.
HRS signals and extinction of gold–IgG conjugates vs. antigen concentration (reprinted with permission from Ref. 174, Copyright 2003, Elsevier).
Singh et. al. 63 demonstrated a fast and highly sensitive assay for Escherichia coli bacteria detection using antibody-conjugated gold nanorod based two-photon scattering technique. They have shown that when anti E. coli antibody-conjugated nanorods were mixed with various concentrations of Escherichia coli O157:H7 bacterium, two-photon scattering intensity increases by about 40 times. This detection is based on the fact that 1) anti E. coli antibody-conjugated nanorods can readily and specifically identify Escherichia coli O157:H7 bacterium, through antibody–antigen recognition (as shown in Figure 46) and 2) when anti E. coli antibody-conjugated nanorods (as shown in Figure 46) were mixed with various concentrations of Escherichia coli O157:H7 bacterium, two-photon scattering intensity increases by about 40 times.
Figure 46.
A) Plot demonstrating two-photon scattering intensity change (by 40 times) due to the addition of E. coli bacteria to anti E. coli antibody conjugated gold nanorods. Two-photon scattering intensity changes very little upon addition of salmonella bacteria. 46B) Absorption profile variation of anti E. coli antibody conjugated Au nanorods due to the addition of different concentrations of E. coli bacteria (102 to 107 colony forming units (cfu) /ml). The strong long wavelength band in the near-infrared region (λLPR = 680 nm) is due to the longitudinal oscillation of the conduction band electrons. The short wavelength peak (λ ≈ 520 nm) is from the nanorods' transverse plasmon mode. New band appearing around 950 nm, due to the addition of E. coli bacteria, demonstrates the aggregation of gold nanorods. 46C) TEM image of E. coli bacteria before addition of nanorod. 46D) TEM image after addition of 102 cfu/mL E. coli bacteria. 46E) TEM image demonstrating aggregation of gold nanorods after the addition of 8 × 10⁴ cfu/mL E. coli bacteria. 46F) TEM image demonstrating aggregation of gold nanorods after the addition of 107 cfu/mL E. coli bacteria (reprinted with permission from Ref. 63, Copyright 2009, American Chemical Society).
This increment is due to the fact that since E. coli bacteria is more than an order of magnitude larger in size (1–3 micro meter (µm)) than the anti E. coli antibody-conjugated gold nanorods, in the presence of E. coli bacteria, several gold nanorods conjugate with one E. coli bacteria. As a result, anti E. coli antibody-conjugated gold nanorods undergo aggregation (as shown in Figure 46D). Due to the aggregation, a new broad band appears around 200 nm far from their longitudinal plasmon absorption band and color change takes place (as shown in Figure 46C). This bioassay is rapid, takes less than 15 min from bacterium binding to detection and analysis, convenient, and highly selective. Their experimental results clearly show that E. coli bacteria can be detected quickly and accurately without any amplification or enrichment in 50 cfu/mL level with excellent discrimination against any other bacteria. Their results point out that our antibody-conjugated gold nanorod based two-photon scattering assay can provide a quantitative measurement of E. coli bacteria concentration.
Antoine et. al. 175 demonstrated that HRS technique is capable to probe the interaction between bovine serum albumin coated gold nanoparticles and StreptAvidin. In their experiments, the aggregation of the biotinylated BSA coated gold particles was induced by introduction of small amounts of StreptAvidin. This increase in intensity is attributed to the aggregation of the gold nanoparticles through the binding of biotin and StreptAvidin. The HRS intensity was corrected to remove photoluminescence contribution and the absorbance by biotinylated BSA coated gold nanoparticles. Figure 47 shows how the HRS intensity varies as a function of the StreptAvidin concentration. Their experimental evidence indicates that like absorbance, the HRS intensity is able to detect the aggregation of the gold nanoparticles. They have demonstrated that HRS intensity increases, even at the concentration of 2 ng/µl of StreptAvidin.
Figure 47.
HRS intensity and absorbance (at 395 nm) of BSA-biotin-Au40 nm conjugates as a function of StreptAvidin concentration (reprinted with permission from Ref. 175, Copyright 2008, Elsevier).
Neely et. al. 59 have demonstrated fast and highly sensitive monoclonal anti-tau antibody (tau-mab) coated gold nanoparticle based two-photon scattering assay for the selective detection of Alzheimer's tau protein in 1 pg/mL level. This two-photon scattering approach for the detection of selective AD biomarker is based on the fact that, the monoclonal anti-tau antibody conjugated gold nanoparticles can readily and specifically identify Tau protein, through antibody–antigen interaction and recognition (as shown in Figure 48). For a Tau protein, there are many surface antigens available for specific recognition with monoclonal anti-tau antibody-conjugated nanoparticles. Therefore, in the presence of Tau protein, several nanoparticles can bind to each protein, thereby producing nanoparticle aggregates (as shown in Figure 48).
Figure 48.
First two steps show schematic representation of the synthesis of monoclonal anti-tau antibody-conjugated gold nanoparticles. Third step shows schematic representation of monoclonal anti-tau antibody-conjugated gold nanoparticle based sensing of tau protein (reprinted with permission from Ref. 59, Copyright 2009, American Chemical Society).
As a result, a colorimetric change has been observed from red to bluish color (as shown in Figure 49) and a new broad band appears around 150 nm far from their plasmon absorption band, as shown in Figure 49B. They have demonstrated that the detection limit of this assay is about two orders of magnitude lower than cut-off values (195 pg/mL) for tau protein in cerebrospinal fluid (CSF). Their experimental results points out that when anti-tau antibody coated gold nanoparticle were mixed with 20 pg/ml concentrations of tau protein, two-photon scattering intensity increases by about 16 times. Interestingly, their experimental data with serum albumin (BSA) protein as well as IgG protein with anti-tau-antibody conjugated gold nanoparticles clearly demonstrated that our TPRS assay is highly sensitive to Tau protein and it can distinguish from BSA, which is one of the most abundant protein components in CSF.
Figure 49.
A) Photograph showing colorimetric change upon addition of 1) 200 ng/ml Tau, 2) 2.8 ng/ml of Tau, 3) 3000 ng /ml BSA protein, 4) 800 mg/ml heme protein. 49B) Absorption profile variation of monoclonal anti-tau antibody conjugated gold nanoparticle due to the addition Tau protein (200 ng / ml Tau). The strong long wavelength band in the visible region (λPR = 520 nm) is due to the oscillation of the conduction band electrons. New band appearing around 670 nm, due to the addition of Tau protein, demonstrates the aggregation of gold nanoparticles. 49C) Plot demonstrating two-photon scattering intensity changes (by 16 times) due to the addition of Tau protein to anti-tau antibody conjugated gold nanoparticle. Two-photon scattering intensity changes very little upon addition of BSA and heme protein. 49D) TEM image after addition of 800 ng/ml BSA protein. 49E) TEM image demonstrating aggregation of anti-tau antibody conjugated gold nanoparticle after the addition of 350 pg/ml Tau (reprinted with permission from Ref. 59, Copyright 2009, American Chemical Society).
7.3 Application in Chemical Sensing
Kim et. al. 46 reported that appropriately functionalized gold nanoparticles based HRS studies can be used for sensing of ion contaminants in water via an ion-chelation-induced aggregation process. The ion-driven aggregation elicits enhanced HRS response from the nanoparticles.
Their results show (Figure 50) the colorimetric response to Pb2+ of a 2.4 nM suspension of functionalized Au particles in water containing 1.0% poly(vinyl alcohol) (PVA) as a stabilizer. As shown in Figure 50, the red-to-blue color change can be reversed by the addition of EDTA, a good Pb2+ extracting agent. Similar responses were obtained with Hg2+- and Cd2+-containing solutions, but not from Zn2+, and it is due to the much lower affinity of simple carboxylic acids for aqueous zinc. They attributed the response in Figure 51 to reversible aggregation induced by MUA coordination of Pb2+. Their interpretation was also supported by TEM measurements indicating aggregate formation of Au-MUA colloid containing lead.
Figure 50.
Colorimetric responses (top panel) and corresponding spectral traces (bottom panel) from: (a) Au–MUA, (b) Au–MUA/Pb2+, and (c) – (g) Au–MUA/Pb2+ and increasing amounts of EDTA. Pb2+ concentration in sample (b) is 0.67 mM; EDTA concentrations in samples (c) – (g) are 0.191, 0.284, 0.376, 0.467, and 0.556 mM (reprinted with permission from Ref. 46, Copyright 2001, American Chemical Society).
Figure 51.
Effect of successive Pb2+ and EDTA additions upon HRS signal intensities. The scattering scales are arbitary (reprinted with permission from Ref. 46, Copyright 2001, American Chemical Society).
They have also examined the ability of HRS to report on heavy-metal ion contamination and their result clearly shows that the HRS detection limit is much higher than that of linear spectroscopy. Figure 51 demonstrated the response of a 2.4 nM Au–MUA particle suspension to the sequential addition of Pb2+ followed by EDTA. Notably, an increase in HRS intensity was readily evident with the addition of as little as 25 µM Pb2+, a concentration too low to yield a visible color change. Darbha et. al. 71 demonstrated that NLO properties of MPA-HCys-PDCA modified gold nanoparticles can be used for rapid, easy and reliable screening of Hg(II) ions in aqueous solution, with high detection limit (5 ppb) and selectivity over competing analytes. To detect Hg(II) ion selectively, they modified the surface of the gold nanoparticle with mercaptopropionic acid (MPA) and homocystine (bound to the gold nanoparticle surface through Au-S bond) and added a chelating ligand 2,6-pyridinedicarboxylic acid (PDCA), to the solution.
To understand how the HRS intensity changes with the addition of different concentrations of Hg ions, they have also performed absorption and TEM studies before and after the addition of mercury ions of different concentrations. Their experimental results clearly show the shift in the plasmon band energy to longer wavelength (about 150–200 nm, as shown in Figure 52) after the addition of Hg (II) ions to MPA-gold-nanoparticle-PDCA solution, which indicated strong aggregation of gold nanoparticles (as shown in Figure 53).
Figure 52.
A) Absorption profile of modified gold nanoparticles before and after the addition of different concentrations of Hg (II) ions, b) Photographic images of color of MPA-PDCA modified gold nanoparticles (13 nM) in the presence of different concentrations of Hg (II) ion, 1) 3 ppm, 2) 6 ppm, 3) 10 ppm, 4) 50 ppm (reprinted with permission from Ref. 71, Copyright 2008, American Chemical Society).
Figure 53.
TEM images of MPA-PDCA modified gold nanoparticle solution a) in the presence and absence of Hg (II) ions (reprinted with permission from Ref. 71, Copyright 2008, American Chemical Society).
Their experimental result clearly shows excellent selectivity over alkali, alkaline earth (Li+, Na+, K+, Mg2+, Ca2+) and transition heavy metal ions (Pb2+, Pb+, Mn2+, Fe2+, Cu2+, Ni2+, Zn2+, Cd2+). Figure 54A shows the colorimetric response and Figure 54B shows the HRS response in the presence of various environmentally relevant metal ions. Their concentration dependent studies clearly demonstrated that, the HRS intensity is highly sensitive to the concentration of Hg(II) ions and after the concentration of 40 ppm Hg(II) ions, the HRS intensity remains unchanged. Linear correlation was shown between the HRS intensity and concentration of Hg(II) ions over the range of 5 ppb–100 ppb. The environmental protection agency (EPA) standard for the maximum allowable level of Hg(II) in drinking water is 2 ppb., which is same orders of magnitude as their HRS assay detection limit.
Figure 54.
A) Photographic images of color of MPA-HCys-PDCA modified gold nanoparticles in the presence of different metal ions of 40 ppm concentration. 54B) HRS intensity change upon the addition of 40 ppm of different metal ions to gold nanoparticle-MPA-HCys-PDCA solution (5 nM) (reprinted with permission from Ref. 71, Copyright 2008, American Chemical Society).
7.4 Prospect of TPS Based Sensor
In this review, we have summarized how the combination of non-linear photonics discipline with biology is very promising for future biomolecular manipulations and applications such as labeling and detection. Although still in its early stages with only a handful of successfully demonstrated cases, the continued development of such nanomaterial based TPS probes is increasingly important for advancing this exciting and rapidly changing research field. We believe that the performance of TPS biosensor assay will continue to evolve and that advanced TPS sensor platforms combined with novel biospecific surfaces will benefit numerous important sectors such as medical diagnostics, environmental monitoring, food safety and security. We envision, in the 5–10 year time frame, that increased collaboration between practitioners in the fields of biology, medicine, nanoscience, and nanotechnology will yield new fundamental insights into biological systems.
Though, in this review, we have discussed mainly the merits of nanostructure based TPS assay for biological and chemical diagnosis, in this section, we will compare the merits of nanostructure-based TPS assays with that of other nano and conventional assays that have been developed. As shown in Table 1, the detection limit of real-time polymerase chain reaction (RT-PCR) is better than most of the nanostructured based assays for DNA/RNA sensing. But PCR has significant drawbacks including complexity, sensitivity to contamination and major challenges with respect to multiplexing. Many researchers believe that these limitations as some of the biggest challenges for moving nucleic-acid-based detection to point-of-care settings in doctor's office as well as bioterrorism defense. Metal nanoparticles can be conjugated with biomolecular targeting or chemical toxin recognition ligands very easily for achieving molecular specificity. Nanomaterials are attractive probe candidates because of their small size and correspondingly large surface-to-volume ratio. Since nanoparticles can be of the same size as the biomolecules attached to them, it may provide minimum disturbance to chemical and biological processes and benefit from decreased diffusion. The sizes, shapes and compositions of metal nanoparticles can be systematically varied to produce materials with specific absorption and light-scattering properties, which makes these materials ideal for multiplexed analyte detection. Additionally, techniques for surface modification and patterning have advanced and as a result, generation of nanoscale arrays of biomacromolecules and small molecules on surfaces are highly visible. PCR also relies on fluorophore labeling. Problem of photobleaching of fluorescent dyes as biological labels and stains has been common over the last few decades. On the other hand, nanostructure based TPS assays uses metal nanoparticle labeling. Unlike dyes, metal nanoparticles are photostable and do not undergo photobleaching, allowing higher light excitation energies and longer probing times. For nanomaterials based TPS assays to compete in the area of nucleic-acid detection, they may have to increase detection limit to make a compelling case with PCR.
Table 1.
Comparison of detection limits of NLO based assays with that of different nanostructure based sensing assays for biological and chemical toxins
| Analyte | Detection Technique | Detection Limit | References |
|---|---|---|---|
| Escherichia Coli | SPR | 105 CFU/ml | 176 |
| Fluorescence Probe With Magnetic Nanomaterial |
101 CFU/ml | 177 | |
| HRS | 50 CFU/ml | 63 | |
| SERS | 103 CFU/ml | 178 | |
| Electrochemical Amplification |
5×10³ CFU/ml | 179 | |
| Gold Nanoparticle Based Piezoelectric Sensor |
2.67×10² CFU/ml | 180 | |
| RT-PCR | 103 CFU/ml | 181 | |
| ELISA | 104 CFU/ml | 182 | |
| Tau Protein | LSPR | 10 pg/ml | 183 |
| HRS | 1pg/ml | 59 | |
| Silver Staining | 650pg/ml | 184 | |
| ELISA | 15ng/ml | 185 | |
| DNA/RNA | Colorimetric | 10nM | 186 |
| Electrochemical | 15pM | 187 | |
| SPR | 10pM | 188 | |
| HRS | 60pM | 75 | |
| SERS | 1fM | 189 | |
| RT-PCR | 0.01 fM | 190 | |
| Molecular Beacons | 1.1 nM | 191 | |
| Mercury | Colorimetric | 500nM | 192 |
| SPR | 10nM | 193 | |
| NSET | 10pM | 112 | |
| HRS | 20nM | 71 | |
| Electrochemical | 75pM | 194 | |
| SERS | 1nM | 195 | |
| ICPMS | 10nM | 196 | |
| Rhodamine Based Fluorescence |
2nM | 197 |
Now enzyme-linked immunosorbent assay (ELISA) for bacteria and protein detection offers significantly less detection limit than the nanostructure based TPS and other assays, as shown in Table 1. So, the current protein detection methods only allow detection after protein levels reach critical threshold concentrations. At these concentrations, the cancer or Alzheimer disease is often significantly advanced. As a result, more sensitive methods that allow for early detection of protein markers could be highly useful for physician treatment of various cancers and other diseases. This will increase patient survival rates, where we believe that nanostructure based TPS assay can play an important role.
On the other hand, in case of chemical toxin detection, nanostructural based TPS assay promises better detection limit than the conventional inductively coupled plasma (ICP) technqiue as well as conventional fluorescence based technique (shown in Table 1). Due to surface plasmon enhancement, optical cross-sections of metal nanoparticles (10–100 nm) are at least 5–7 orders of magnitude larger than those of dye molecules. As a result, each metal nanoparticle can be considered as an optical probe equivalent to up to a million dye molecules, which provides a huge margin for enhancing the probing detection limit. Also metal nanoparticles can be conjugated with small molecule or biomolecular targeting or recognition ligands very easily for achieving molecular specificity. TPS assay using HRS technique is fairly simple, and in fact, this technique is more accurate when the molecules do not absorb or emit near the fundamental or the second harmonic wavelengths. The choice of the wavelength of measurement in HRS experiments is flexible. Any light source with sufficient power available in the laboratory can be used. Assay equipment consists of three main parts, a laser source, a light path, and a detector (photomultiplier tube), so it is easy to set up and is simple to use.
Due to the surface plasmon band, nanoparticles provide outstanding optical properties that can be used with a variety of techniques for labeling, imaging, sensing and diagnostics. Plasmonic-based biological and chemical sensing technologies are being successfully applied and commercialized. In this section, now different nanostructure based optical and electrochemical techniques including colorimetric, surface plasmon resonance (SPR), surface enhanced Resonance Raman (SRES), nanoparticle based fluorescence energy transfer (NSET) and nanoparticle based electrochemical assay have been compared in the context of chemical and biological toxins detection. As we have shown in Table 1, detection limits of nanoparticle label techniques such as SPR, HRS, electrochemical enhancement are almost similar orders of magnitude and also they are several orders of magnitude more sensitive than nanoparticle based colorimetric assays. There as several advantages of using nanoparterial based TPS assays over nanomaterial based colorimetric assays and these are as follows.
The relative contribution of scattering increases rapidly with increase in the nanostructure volume. 80-nm gold nanoparticle offers scattering several orders of magnitude larger than the typical absorption. Such highly enhanced cross-sections offer sensitive and highly contrasted imaging. As we discussed before, several articles demonstrated that NLO based assay can be three orders of magnitude more sensitive than the usual colorimetric technique.
HRS signal change is quite high even from monomer to the aggregates containing as few as three nanoparticles. In contrast, substantive changes in the linear spectroscopic response appear to require aggregation of as many as a few hundred to a few thousand nanoparticles. As a result, the onset of HRS enhancement can be observed much before any visible color change occurs.
On the other hand, though SERS and NSET are highly promising technologies to detect biological and chemical analytes at very low concentrations, problem of photobleaching of Raman and fluorescent dyes as biological labels and stains has been common over the last few decades. Nanoparticle labeling, which is necessary for TPS assay, is more universal and robust. Unlike dyes, metal nanoparticles are photostable and do not undergo photobleaching, allowing higher light excitation energies and longer probing times. Also, a big challenge in SERS technique is that huge signals can be obtained only in ideal conditions, which can be difficult to obtain reproducibly and quantitatively in media such as biological fluids.
Though there are several advantages of using TPS based assays instead of conventional assays, there still remains a number of challenges related to the biological and chemical sensing which have been discussed here. It is quite hard to precisely control the number of functional molecules on the surface of nanoparticles. As a result, we need to develop better strategies for uniform surface modification as well as reproducible functionalization. Other important problem is that the properties of nanomaterials synthesized by different research groups often vary because of the lack of commonly accepted synthetic protocols. Minor variations of the reaction parameters have led to the situation in which samples prepared by different research groups are different from one another. We need to have a list of experimental conditions and characterization techniques, sufficient for quantitative reproducibility of properties for every important type of nanomaterials. Also, TPS technique requires sophisticated and expensive lasers, optical components, and detectors. As a result, miniaturized systems that completely integrate various processes for specific biomolecular and chemical detection are needed to be highly achievable. Then only TPS will be qualified for point-of-care or in-field testing. Similarly, advancement in theoretical studies of interfaces would be of great value and will probably need to grow rapidly as new and challenging experimental results are reported. Technology advances in laser and detection apparatus will improve the detection limit of these nonlinear measurements and it may be possible to investigate phenomena and systems that are presently beyond our reach. As a result, development of new programs will be invaluable in improved modeling of the data from interfacial experiments.
Continued optimization of different parameters is necessary to determine the applicability of these assays in point-of-care settings. The ability of an assay for chemical and biological sensing in complex environments with high background and competing targets requires exquisite selectivity and sensitivity, which often adds complexity and affects ultimate assay performance. In parallel, and for each study, toxicity and side effects need to be thoroughly examined as a function of nanoparticle size, shape, and surface coating. Toxicity concerns need to be addressed in a serious and systematic way. Therefore an understanding of biological response, and environmental remediation is necessary. Future advances will require continued innovations by chemists in close collaboration with experts in medical and biological fields. Further challenges in this emerging field include mimicking other aspects of biology in making biomaterials. For example, materials made in biology have highly ordered hierarchy structures. In addition, biological systems respond to the chemical stimuli not only passively but also progressively in such a way to change the environment. For example, an enzyme expression is turned on in response to the presence of a substrate to digest the substrate. It would be desirable to have nanomaterials made to possess similar properties such that the materials can be used not only for sensing but also for autonomous repair and renewal. No matter what the methods are to meet these challenges, biology will always remain the biggest inspiration.
8. Summary and Outlook
In conclusion, in this review, an overview of the emergence of second order NLO nanomaterials for the development of nanomaterial based optical technology and how the NLO properties of nanomaterials vary with different sizes, symmetry as well as shape, are highlighted. Advances have been made during the last 10 years in the design of nanomaterials of different sizes and shapes for NLO, which provide useful examples to illustrate the new features of the NLO response in comparison to the more thoroughly investigated donor-acceptor based one dimensional compounds. Several studies demonstrated that SHG from metal nanoparticles is typically attributed to electric dipole excitations at their surfaces, but nonlinearities involving higher multipole effects, such as magnetic dipole interactions, electric quadrupoles, etc., may also be significant due to strong nanoscale gradients in the local material properties and fields. Strong polarization dependence of the response can modify the relative strengths of the interfering terms, thereby allowing electric-dipole and higher-multipole contributions to the overall SHG response. With the advent of nanocrystal (NC) technology, several efforts are undergoing for establishing a novel class of hybrid NLO materials. This review also summarizes recent progress on the development of nanomaterials based NLO assay for monitoring chemical processes and sensing biomolecules and toxic metals. Several publications demonstrated that the NLO assay could be more sensitive than the colorimetric signal of the linear optical phenomenon in detecting the biological and chemical species. Therefore, NLO assay has capability to improve the analytical figures of merit, such as detection limits, sensitivity, selectivity, and dynamic range, relative to the commercial systems. Hopefully, the current review has demonstrated the power of nanomaterial based HRS assay to investigate the chemical processes and for biological and chemical sensing with several advantages. It is really impressive to see the development of a new research area within the time span of about 10 years and their possible applications. The chemistry, physics and engineering of these small particle interfaces, are likely to offer an abundance of surprises. An increase in theoretical studies of interfaces would be of great value and will probably grow rapidly as new and challenging experimental results are reported. Advances in computer technology and the development and availability of new software and programs will be invaluable in improved modeling of the data from interfacial experiments. I believe that technology advances will improve the sensitivity of these nonlinear assay measurements and make it possible to investigate phenomena and systems that are presently beyond our imagination. May be, if we look back 10 years, we might ask what were the unexpected developments. I leave this to the future reader to speculate.
Figure 2.
A) TEM image of gold nanorods of average aspect ratios (σ) ≈ 2.0, 2.8, 4.0 and 5.2, and B) Extinction profile of Au nanorods with aspect ratios varying from 2.0 to 5.7. The strong long wavelength band in the near-infrared region (λLPR = 600–950 nm) is due to the longitudinal oscillation of the conduction band electrons. The short wavelength peak (λ ≈ 520 nm) is from the nanorods' transverse plasmon mode (reprinted with permission from Ref. 81, Copyright 2008, Willey- VCH).
Acknowledgements
Dr. Ray thanks NSF-PREM grant # DMR-0611539, NSF-CREST grant # HRD-0833178, and NIH-SCORE grant # S06GM 008047 for their generous funding. I also thank reviewers whose valuable suggestion improved the quality of the manuscript.
Abbreviations
- AD
Alzheimer's disease
- AFM
atomic force microscopy
- AuNP
gold nanoparticle
- BSA
Bovine serum albumin
- CL
chemiluminescence
- CSF
cerebrospinal spinal fluid
- CTAB
cetyltrimethylammonium bromide
- CT
charge transfer
- CV
crystal violet
- Cys
cysteine
- DNA
deoxyribonucleic acid
- c DNA
complementary DNA
- ds DNA
double-stranded DNA
- ss DNA
single-stranded DNA
- DSEH
Dadap, Shan, Eisenthal, and Heinz
- ECL
electrochemiluminescence
- EDTA
ethylene-diamine-tetra-acetic acid
- EPA
environmental protection agency
- EFISHG
electric field induced second-harmonic generation
- ELISA
enzyme-linked immunosorbent assay
- EM
electromagnetic
- EO
electro optic
- ESA
electrostatic self-assembly
- FRET
fluorescence resonance energy transfer
- FTIR
Fourier transform infrared
- GW
giga watt
- HCV
hepatitis C virus
- HCys
homocysteine
- HIV
human immunodeficiency virus
- HRS
hyper-Rayleigh scattering
- HRTEM
high-resolution transmission electron microscopy
- ICP
Inductively coupled plasma
- ICT
intermolecular charge transfer
- IgG
Immunoglobulin
- KDP
potassium dihydrogen phosphate
- LB
Langmuir–Blodgett
- LED
light-emitting diode
- LOD
limit of detection
- LSPR
localized surface plasmon resonance
- MALDI-TOF
matrix-assisted laser desorption/ionization time-of-flight mass spectrometry
- MPA
3-mercaptopropanoic acid
- MUA
11-mercaptoundecanoic acid
- NC
nanocrystal
- NLO
nonlinear optics
- NP
nanoparticle
- NPP
N-(4-nitrophenyl)–(s)-prolinol
- NSET
nanoparticle based surface energy transfer
- PCR
polymerase chain reaction
- PDCA
2,6-pyridinedicarboxylic acid
- PR
photorefractive
- PSS
poly(styrenesulfonate)
- PVC
poly(vinyl chloride)
- PVK
poly N-vinylcarbazole
- PVNPAK
poly(N-vinyl)-3-[p-nitrophenylazo]carbazolyl
- QCM
quartz crystal microbalance
- QD
quantum dot
- RNA
ribonucleic acid
- dsRNA
double-stranded RNA
- ssRNA
single-stranded RNA
- RT-PCR
real-time polymerase chain reaction
- SERS
surface-enhanced Raman scattering
- SH
second harmonic
- SHG
second-harmonic generation
- SNP
single-nucleotide polymorphism
- SP
surface plasmon
- SPR
surface plasmon resonance
- SWNT
single-walled carbon nanotube
- TCP
tritolyl phosphate
- TEM
transmission electron microscopy
- THG
third harmonic generation
- TPA
two-photon absorption
- TPRS
two-photon Rayleigh scattering
- TPA
two-photon scattering
- UV
ultraviolet
- YAG
Yttrium aluminium garnet
- WGM
whispering-gallery modes
- WDM
wavelength division multiplexing
Biography

Dr. Paresh Ray is an Associate Professor in the Department of Chemistry and Biochemistry, Jackson State University, Jackson, Mississippi. Dr. Paresh Ray received his BS in Chemistry from Vidyasagar University, India and MS in Physical Chemistry from Kalyani University, India, in 1989 and 1992, respectively; and a Ph.D. in Physical Chemistry from Indian Institute of Science in 1997. Before joining JSU, he was appointed in several positions including postdoctoral fellow at the University of Chicago, Ohio State University, and Columbia University, New York.
The development of new scientific concepts and technologies in emerging interdisciplinary fields is the career goal of Dr. Paresh Ray. His group research activities include size and shape-controlled synthesis of metal nanostructures, which can be ideal building blocks for future nanodevices. Understanding NLO properties of these nanostructured materials, which have high ability for applications in photonics and bio-imaging. Over the last 5 years, he has focused his attention on research at the interface of chemistry and biology that include exploring new chemical strategies for the control of DNA/RNA hybridization, creating new nanobased biosensor for the detection of food pathogens and cancer cells, enhancing our understanding of biomolecular interaction with nanosurface and assessing nanoparticle toxicity. Dr. Paresh Ray has published over 120 scientific publications in peer-reviewed manuscripts, review articles and book chapters. He has presented over 100 seminars, lectures and courses on various topics of nonlinear optics, nanomaterials and biosensor.
References
- 1.Boyd RW. Nonlinear Optics. San Diego, CA: Academic Press; 1992. [Google Scholar]
- 2.Zyss J, editor. MolecularNonlinear Optics: Materials, Physics and Devices. New York: Academic Press; 1994. [Google Scholar]
- 3.Saleh BEA, Teich MC. Fundamentals of Photonics. New York: Wiley; 1991. [Google Scholar]
- 4.Chemla DS, Zyss J, editors. Nonlinear Optical Properties of Organic Molecules and Crystals. Vols. 1 and 2. Orlando, FL: Academic Press; 1987. [Google Scholar]
- 5.Prasad PN, Williams D, editors. Introduction to Nonlinear Effects in Molecules and Polymers. New York: J. Wiley; 1991. [Google Scholar]
- 6.Nalwa HS, Miyata S, editors. Nonlinear Optics of Organic Molecules and Polymers. Boca Raton, FL: CRC Press; 1997. [Google Scholar]
- 7.Kanis DR, Ratner MA, Marks TJ. Chem. Rev. 1994;94:195. [Google Scholar]
- 8.Zyss J, Ledoux I. 1994;94:77. [Google Scholar]
- 9.Torre G, Vázquez P, López FA, Torres T. Chem. Rev. 2004;104:3723. doi: 10.1021/cr030206t. [DOI] [PubMed] [Google Scholar]
- 10.Ostroverkhova O, Moerner WE. Chem. Rev. 2004;104:3267. doi: 10.1021/cr960055c. [DOI] [PubMed] [Google Scholar]
- 11.Burland DM, Miller RD, Walsh CA. Chem. Rev. 1994;94:31. [Google Scholar]
- 12.Eisenthal KB. Chem. Rev. 2006;106:1462. doi: 10.1021/cr0403685. [DOI] [PubMed] [Google Scholar]
- 13.Papadopoulos MG, Leszczynski J, Sadlej AJ, editors. Nonlinear Optical Properties of Matter: From Molecules to Condensed Phases. Dordrecht: Kluwer; 2006. [Google Scholar]
- 14.Asselberghs I, Clays K, Persoons A, Ward MD, McCleverty JA. J. Mater. Chem. 2004;14:2831. [Google Scholar]
- 15.Coe BJ. Acc. Chem. Res. 2006;39:383. doi: 10.1021/ar050225k. [DOI] [PubMed] [Google Scholar]
- 16.Dalton LR, Sullivan PA, Bale DH. Chem. Rev. 2010;110:25. doi: 10.1021/cr9000429. [DOI] [PubMed] [Google Scholar]
- 17.Radhakrishnan TP. Acc. Chem. Res. 2008;41:367. doi: 10.1021/ar7002072. [DOI] [PubMed] [Google Scholar]
- 18.Willets KA, Nishimura SY, Schuck PJ, Twieg RJ, Moerner WE. Acc. Chem. Res. 2005;38:549. doi: 10.1021/ar0401294. [DOI] [PubMed] [Google Scholar]
- 19.Dalton LR. In: Handbook of Conducting Polymers. Skotheim TA, Reynolds JR, editors. Boca Raton, FL: CRC Press LLC; 2007. [Google Scholar]
- 20.Franken PA, Hill AE, Peters CW, Weinreich G. Phys. Rev. Lett. 1961;7:118. [Google Scholar]
- 21.Goirdmaine A, Miller RC. Phys. Rev. Lett. 1965;14:973. [Google Scholar]
- 22.Rentzepis PM, Poa YH. Appl. Phys. Lett. 1964;5:156. [Google Scholar]
- 23.Heilmeier GH, Ockman N, Braunstein N, Kramer DA. Appl. Phys. Lett. 1964;5:229. [Google Scholar]
- 24.Gott JR. J. Phys. B. 1971;4:116. [Google Scholar]
- 25. science.thomsonreuters.com/
- 26. www.cas.org/SCIFINDER/SCHOLAR.
- 27. http://info.scopus.com/overview/
- 28.Lecaque LB, Coe BJ, Clays K, Foerier S, Verbiest T, Asselberghs I. J. Am. Chem. Soc. 2008;130:33286. doi: 10.1021/ja711170q. [DOI] [PubMed] [Google Scholar]
- 29.Sun CF, Hu CL, Xu X, Ling JB, Hu T, Kong F, Long XF, Mao JG. J. Am. Chem. Soc. 2009;131:9486. doi: 10.1021/ja9030566. [DOI] [PubMed] [Google Scholar]
- 30.Ishifuji M, Mitsuishi M, Miyashita T. J. Am. Chem. Soc. 2009;131:4418. doi: 10.1021/ja808749h. [DOI] [PubMed] [Google Scholar]
- 31.DiBenedetto SA, Frattarelli DL, Facchetti A, Ratner MA, Marks TJ. J. Am. Chem. Soc. 2009;131:11080. doi: 10.1021/ja902751e. [DOI] [PubMed] [Google Scholar]
- 32.Reeve JE, Collins HA, Mey KD, Kohl MM, Thorley KJ, Paulsen O, Clays K, Anderson HL. J. Am. Chem. Soc. 2009;131:2758. doi: 10.1021/ja8061369. [DOI] [PubMed] [Google Scholar]
- 33.Cariati E, Macchi R, Roberto D, Ugo R, Galli S, Casati N, Macchi P, Sironi A, Bogani L, Caneschi A, Gatteschi D. J. Am. Chem. Soc. 2007;129:9410. doi: 10.1021/ja0710712. [DOI] [PubMed] [Google Scholar]
- 34.Frattarelli D, Schiavo M, Facchetti A, Ratner MA, Marks TJ. J. Am. Chem. Soc. 2009;131:12595. doi: 10.1021/ja900131y. [DOI] [PubMed] [Google Scholar]
- 35.Asselberghs I, Flors C, Ferrighi L, Botek E, Champagne B, Mizuno H, Ando R, Miyawaki A, Hofkens J, Van der Auweraer M, Clays K. J. Am. Chem. Soc. 2008;130:15713. doi: 10.1021/ja805171q. [DOI] [PubMed] [Google Scholar]
- 36.Babgi B, Rigamonti L, Cifuentes MP, Corkery TC, Randles MD, Schwich T, Petrie S, Stranger R, Teshome A, Asselberghs I, Clays K, Samoc M, Humphrey MG. J. Am. Chem. Soc. 2009;131:10293. doi: 10.1021/ja902793z. [DOI] [PubMed] [Google Scholar]
- 37.Kim TD, Kang JW, Luo J, Jang SH, Ka JW, Tucker N, Benedict JB, Dalton LR, Gray T, Overney RM, Park DH, Herman WN, Alex K-YJen. J. Am. Chem. Soc. 2007;129:488. doi: 10.1021/ja067970s. [DOI] [PubMed] [Google Scholar]
- 38.Sullivan PA, Rommel H, Liao Y, Olbricht BC, Akelaitis AJP, Firestone KA, Kang JW, Luo J, Davies JA, Choi DH, Eichinger BE, Reid PJ, Chen A, Jen AKY, Robinson BH, Dalton LR. J. Am. Chem. Soc. 2007;129:7523. doi: 10.1021/ja068322b. [DOI] [PubMed] [Google Scholar]
- 39.Sullivan PA, Akelaitis AJP, Lee SK, McGrew G, Lee SK, Choi DH, Dalton LR. Chem. Mater. 2006;18:344. [Google Scholar]
- 40.Agarwal GS, Jha SS. Solid State Commun. 1982;41:499. [Google Scholar]
- 41.Hua XM, Gersten JI. Phys. Rev. B. 1986;33:3756. doi: 10.1103/physrevb.33.3756. [DOI] [PubMed] [Google Scholar]
- 42.Dadap JI, Shan J, Eisenthal KB, Heinz TF. Phys. Rev. Lett. 1999;80:4045. [Google Scholar]
- 43.Vance FW, Lemon BI, Hupp JT. J. Phys. Chem. B. 1998;102:10091. [Google Scholar]
- 44.Galletto P, Brevet PF, Girault HH, Antoine R, Broyer M. J. Phys. Chem. B. 1999;103:8706. [Google Scholar]
- 45.Novak JP, Brousseau LC, Vance FW, Johnson RC, Lemon BI, Hupp JT, Feldheim DL. J. Am. Chem. Soc. 2000;122:12029. [Google Scholar]
- 46.Kim Y, Johnson RC, Hupp JT. Nano Lett. 2001;1:165. [Google Scholar]
- 47.Das S, Gersten JI. Phys. Rev. B. 1988;37:6063. doi: 10.1103/physrevb.37.6063. [DOI] [PubMed] [Google Scholar]
- 48.Johnson RC, Li J, Hupp JT, Schatz GC. Chem. Phys. Lett. 2002;356:534. [Google Scholar]
- 49.Hao EC, Schatz GC, Johnson RC, Hupp JT. J. Chem. Phys. 2002;117:5963. [Google Scholar]
- 50.Kujala S, Canfield KB, Kauranen M, Svirko Y, Turunen J. Phys. Rev. Lett. 2007;98:167403. doi: 10.1103/PhysRevLett.98.167403. [DOI] [PubMed] [Google Scholar]
- 51.Chandra M, Indi SS, Das PK. Chem. Phys. Lett. 2006;422:262. [Google Scholar]
- 52.Dadap JI, Shan J, Heinz TF. J. Opt. Soc. Am. B. 2004;21:1328. [Google Scholar]
- 53.Nappa J, Revillod G, Russier-Antoine I, Benichou E, Jonin C, Brevet PF. Phys. Rev. B. 2005;71:165407. [Google Scholar]
- 54.Nappa J, Revillod G, Russier-Antoine I, Benichou E, Jonin C, Brevet PF. Chem. Phys. Lett. 2005;415:246. [Google Scholar]
- 55.Russier-Antoine I, Benichou E, Bachelier G, Jonin C, Brevet PF. J. Phys. Chem. C. 2007;111:9044. [Google Scholar]
- 56.Chandra M, Indi SS, Das PK. J. Phys. Chem. C. 2007;111:1065. [Google Scholar]
- 57.Nappa J, Russier-Antoine I, Benichou E, Jonin C, Brevet PF. J. Chem. Phys. 2006;125:184712. doi: 10.1063/1.2375095. [DOI] [PubMed] [Google Scholar]
- 58.Segets D, Tomalino LM, Gradl J, Peukert WJ. Phys. Chem. C. 2009;113:11995. [Google Scholar]
- 59.Neely A, Perry C, Varisli B, Singh A, Arbneshi T, Senapati D, Kalluri JR, Ray PC. ACS Nano. 2009;3:2834. doi: 10.1021/nn900813b. [DOI] [PMC free article] [PubMed] [Google Scholar]
- 60.Wang G, Sun W. J. Phys. Chem. B. 2006;110:20901. doi: 10.1021/jp0638843. [DOI] [PubMed] [Google Scholar]
- 61.Kneipp J, Kneipp H, Wittig B, Kneipp K. Nano Lett. 2007;7:2819. doi: 10.1021/nl071418z. [DOI] [PubMed] [Google Scholar]
- 62.Duboisset I, Russier-Antoine E, Benichou G, Jonin BC, Brevet PF. J. Phys. Chem. C. 2009;113:13477. [Google Scholar]
- 63.Singh AK, Senapati D, Wang S, Griffin J, Neely A, Candice P, Naylor KM, Varisli B, Kalluri JR, Ray PC. ACS Nano. 2009;3:1906. doi: 10.1021/nn9005494. [DOI] [PMC free article] [PubMed] [Google Scholar]
- 64.Russier-Antoine I, Bachelier G, Sablonière V, Duboisset J, Benichou E, Jonin C, Bertorelle F, Brevet PF. Phys. Rev. B. 2008;78:35436. [Google Scholar]
- 65.Bachelier G, Russier-Antoine I, Benichou E, Jonin C, Brevet PF. J. Opt. Soc. Am. B. 2008;25:955. [Google Scholar]
- 66.Lippitz M, van Dijk MA, Orrit M. Nano Lett. 2005;5:799. doi: 10.1021/nl0502571. [DOI] [PubMed] [Google Scholar]
- 67.Ray PC. Angew. Chem. Int. Ed. 2006;45:1151. doi: 10.1002/anie.200503114. [DOI] [PubMed] [Google Scholar]
- 68.Moran AM, Sung J, Hicks EM, Van Duyne RP, Spears KG. J. Phys. Chem. B. 2005;109:4501. doi: 10.1021/jp0467604. [DOI] [PubMed] [Google Scholar]
- 69.Chandra M, Das PK. Chem. Phys. Lett. 2009;476:62. [Google Scholar]
- 70.Chandra M, Das PK. Chem. Phys. 2009;358:203. [Google Scholar]
- 71.Darbha GK, Singh AK, Rai US, Yu E, Yu H, Ray PC. J. Am. Chem. Soc. 2008;130:8038. doi: 10.1021/ja801412b. [DOI] [PMC free article] [PubMed] [Google Scholar]
- 72.Wang G, Zhang Y, Cui Y, Duan M, Liu M. J. Phys. Chem. B. 2005;109:1067. doi: 10.1021/jp0472919. [DOI] [PubMed] [Google Scholar]
- 73.Sahyun MRV. Spectrochim. Acta, Part A. 2002;58:3149. doi: 10.1016/s1386-1425(02)00107-5. [DOI] [PubMed] [Google Scholar]
- 74.D’Arrigo MC, Cruickshank FR, Pugh D, Sherwood JN, Wallis JD, Mackenzie C, Hayward D. Phys. Chem. Chem. Phys. 2006;8:3761. doi: 10.1039/b517388d. [DOI] [PubMed] [Google Scholar]
- 75.Griffin J, Singh AK, Senapati D, Lee E, Gaylor K, Jones-Boone J, Ray PC. Small. 2009;5:839. doi: 10.1002/smll.200801334. [DOI] [PubMed] [Google Scholar]
- 76.Jacobson M, Banin U. J. Phys. Chem. B. 2000;104:1. [Google Scholar]
- 77.Son DH, Wittenberg JS, Banin U, Alivisatos P. J. Phys. Chem. B. 2006;110:19884. doi: 10.1021/jp062028o. [DOI] [PubMed] [Google Scholar]
- 78.Zhang Y, Ma M, Wang X, Fu D, Zhang H, Gu N, Liu J, Lu Z, Xu L, Chen K. Inorg. Chem. Commun. 2003;6:427. [Google Scholar]
- 79.Santos BS, Pereira GAL, Petrov DV, de Mello Donega C. Opt. Commun. 2000;178:187. [Google Scholar]
- 80.Jacobsohn M, Banin U. J. Phys. Chem. B. 2000;104:1. [Google Scholar]
- 81.Darbha GK, Rai US, Singh AK, Ray PC. Chem. Eur. J. 2008;14:3896. doi: 10.1002/chem.200701850. [DOI] [PubMed] [Google Scholar]
- 82.Petrov DV, Santos BS, Pereira GAL, de Mello Donegá C. J. Phys. Chem.B. 2002;106:5325. [Google Scholar]
- 83.Zhang Y, Wang X, Fu D, Cheng J, Shen Y, Liu J, Lu Z. J. Phys. Chem. Solids. 2001;62:903. [Google Scholar]
- 84.Zhang Y, Ming M, Xin W, Degang F, Ning G, Juzheng L, Zuhong L, Ma Yi, Xu Ling, Chen Kunji. J. Phys. Chem. Solids. 2002;63:2115. [Google Scholar]
- 85.Hao L, Qiming L, Mingliang W, Xiujian Z. J. Phys. Chem. Solids. 2007;68:963. [Google Scholar]
- 86.Fajian Z, Liangmin Z, You-Xiong W, Richard C. App. Opt. 2005;44:3969. doi: 10.1364/ao.44.003969. [DOI] [PubMed] [Google Scholar]
- 87.Jin RJ, Justin JE, Hee KY, Norbert SF. J. Amer. Chem. Soc. 2005;127:12482. [Google Scholar]
- 88.Zhang H, Banfield JF. J. Phys. Chem. C. 2009;113:9681. [Google Scholar]
- 89.Yu Z, Xin W, Ming M, Degang F, Ning G, Zuhong L, Jun X, Ling X, Kunji C. J. Coll. Inter. Sci. 2003;266:377. [Google Scholar]
- 90.Thantu N, Schley RS, Justus BL. Opt. Comm. 2003;220:203. [Google Scholar]
- 91.Landes C, Braun M, El-Sayed MA. Chem. Phys. Lett. 2002;363:465. [Google Scholar]
- 92.Justin C, Haoquan Y, Richard SD, Poul PB, Peidong Y, Richard SJ. Nano Lett. 2002;2:279. [Google Scholar]
- 93.Rodriguez EV, Cid BDA, Antonio MBS, Ivanenko VI, Lipovskii AA. Chem. Phys. Lett. 2009;467:335. [Google Scholar]
- 94.Parikshit M, Manas G. Physica B: Condensed Matter. 2008;403:2967. [Google Scholar]
- 95.Xiao D, Bulat FA, Yang W, Beratan DN. Nano Lett. 2008;8:2814. doi: 10.1021/nl801388z. [DOI] [PubMed] [Google Scholar]
- 96.Zhang L, Fajian Z, Yongqiang W, Richard CO. J. Chem. Phys. 2002;116:6297. [Google Scholar]
- 97.Ghosh SK, Pal T. Chem. Rev. 2007;107:4797. doi: 10.1021/cr0680282. [DOI] [PubMed] [Google Scholar]
- 98.Stewart ME, Anderton CR, Thompson LB, Maria J, Gray SK, Rogers JA, Nuzzo RG. Chem. Rev. 2008;108:494. doi: 10.1021/cr068126n. [DOI] [PubMed] [Google Scholar]
- 99.Dadge JW, Kanade KG, Kale BB, Amalnerkar DP, Aiyer RC. J. Optoelec. Adv. Mat. 2007;9:2200. [Google Scholar]
- 100.Rosi NL, Mirkin CA. Chem. Rev. 2005;105:154. doi: 10.1021/cr030067f. [DOI] [PubMed] [Google Scholar]
- 101.Murray RW. Chem. Rev. 2008;108:2688. doi: 10.1021/cr068077e. [DOI] [PubMed] [Google Scholar]
- 102.Daniel MC, Astruc D. Chem. Rev. 2004;104:293. doi: 10.1021/cr030698+. [DOI] [PubMed] [Google Scholar]
- 103.Sassolas A, Leca-Bouvier BD, Blum LJ. Chem. Rev. 2008;108:109. doi: 10.1021/cr0684467. [DOI] [PubMed] [Google Scholar]
- 104.Griffin J, Singh AK, Senapati D, Rhodes P, Mitchell K, Robinson B, Yu E, Ray PC. Chem. Eur. J. 2009;15:342. doi: 10.1002/chem.200801812. [DOI] [PubMed] [Google Scholar]
- 105.LaFratta CN, Walt DR. Chem. Rev. 2008;108:614. doi: 10.1021/cr0681142. [DOI] [PubMed] [Google Scholar]
- 106.Li D, Song S, Fan C. Acc. Chem. Res. 2010 doi: 10.1021/ar900245u. Articles ASAP. [DOI] [PubMed] [Google Scholar]
- 107.Burda C, Chen X, Narayanan R, El-Sayed MA. Chem. Rev. 2005;105:1025. doi: 10.1021/cr030063a. [DOI] [PubMed] [Google Scholar]
- 108.Griffin J, Ray PC. J. Phys. Chem. B. 2008;112:11198. doi: 10.1021/jp8059322. [DOI] [PubMed] [Google Scholar]
- 109.Friedrich H, de Jongh PE, Verkleij AJ, de Jong KP. Chem. Rev. 2009;109:1613. doi: 10.1021/cr800434t. [DOI] [PubMed] [Google Scholar]
- 110.Liu J, Cao Z, Lu Y. Chem. Rev. 2009;109:1948. doi: 10.1021/cr030183i. [DOI] [PMC free article] [PubMed] [Google Scholar]
- 111.Kumbhar AS, Kinnan MK, Chumanov G. J. Am. Chem. Soc. 2005;127:12444. doi: 10.1021/ja053242d. [DOI] [PubMed] [Google Scholar]
- 112.Darbha GK, Ray A, Ray PC. ACS Nano. 2007;1:208. doi: 10.1021/nn7001954. [DOI] [PubMed] [Google Scholar]
- 113.Wang H, Brandl DW, Nordlander P, Ha NJ. Acc. Chem. Res. 2007;40:53. doi: 10.1021/ar0401045. [DOI] [PubMed] [Google Scholar]
- 114.Lim SI, Zhong CJ. Acc. Chem. Res. 2009;42:798. doi: 10.1021/ar8002688. [DOI] [PubMed] [Google Scholar]
- 115.Jain PK, Huang X, El-Sayed IH, El-Sayed MA. Acc. Chem. Res. 2008;41:1578. doi: 10.1021/ar7002804. [DOI] [PubMed] [Google Scholar]
- 116.Jun YW, Seo JW, Cheon J. Acc. Chem. Res. 2008;41:179. doi: 10.1021/ar700121f. [DOI] [PubMed] [Google Scholar]
- 117.Dasary SSR, Singh AK, Senapati D, Yu H, Ray PC. J. Am. Chem. Soc. 2009;131:13806. doi: 10.1021/ja905134d. [DOI] [PubMed] [Google Scholar]
- 118.Camden JP, Dieringer JA, Zhao J, Van Duyne RP. Acc. Chem. Res. 2008;41:1653. doi: 10.1021/ar800041s. [DOI] [PubMed] [Google Scholar]
- 119.Willem JM, Strijkers GJ, van Tilborg GAF, Cormode DP, Fayad ZA, Nicolay K. Acc. Chem. Res. 2009;42:904. doi: 10.1021/ar800223c. [DOI] [PMC free article] [PubMed] [Google Scholar]
- 120.Gordon R, Sinton D, Kavanagh KL, Brolo AG. Acc. Chem. Res. 2008;41:1049. doi: 10.1021/ar800074d. [DOI] [PubMed] [Google Scholar]
- 121.Ho HA, Najari A, Leclerc M. Acc. Chem. Res. 2008;41:168. doi: 10.1021/ar700115t. [DOI] [PubMed] [Google Scholar]
- 122.Haes AJ, Van Duyne RP. J. Am. Chem. Soc. 2002;124:10596. doi: 10.1021/ja020393x. [DOI] [PubMed] [Google Scholar]
- 123.Haes AJ, Chang L, Klein WL, Van Duyne RPJ. Am. Chem. Soc. 2005;127:2264. doi: 10.1021/ja044087q. [DOI] [PubMed] [Google Scholar]
- 124.Wang H, Kim Y, Liu H, Zhu Z, Bamrungsap S, Tan W. J. Am. Chem. Soc. 2009;131:8221. doi: 10.1021/ja901132y. [DOI] [PubMed] [Google Scholar]
- 125.Zheng D, Seferos DS, Giljohann DA, Patel PC, Mirkin CA. Nano Lett. 2009;9:3258. doi: 10.1021/nl901517b. [DOI] [PMC free article] [PubMed] [Google Scholar]
- 126.Wu YR, Phillips JA, Liu HP, Yang RH, Tan WH. ACS Nano. 2008;2:2023. doi: 10.1021/nn800325a. [DOI] [PMC free article] [PubMed] [Google Scholar]
- 127.Seferos DS, Prigodich AE, Giljohann DA, Patel PC, Mirkin CA. Nano Lett. 2009;9:308. doi: 10.1021/nl802958f. [DOI] [PMC free article] [PubMed] [Google Scholar]
- 128.Park SY, Lytton-Jean AKR, Lee B, Weigand S, Schatz GC, Mirkin CA. Nature. 2008;451:553. doi: 10.1038/nature06508. [DOI] [PubMed] [Google Scholar]
- 129.Fu A, Micheel CM, Cha J, Chang H, Yang H, Alivisatos P. J. Am. Chem. Soc. 2004;126:10832. doi: 10.1021/ja046747x. [DOI] [PubMed] [Google Scholar]
- 130.Christian GC, David GR, Tomás T, Martín G, Fernando A-L, Ledoux I, Zyss J, Ferro VR, García JM. J. Phys. Chem. B. 2005;109:3800. doi: 10.1021/jp045322u. [DOI] [PubMed] [Google Scholar]
- 131.Keinan S, Ratner MA, Marks TJ. Chem. Mater. 2004;16:1848. [Google Scholar]
- 132.Flipse MC, de Jonge R, Woudenberg RH, Marsman AH, van Walree CA, Jenneskens LW. Chem. Phys. Lett. 1995;245:297. [Google Scholar]
- 133.Jensen L, Astrand P-O, Osted A, Kongsted J, Mikkelsen KV. J. Chem. Phys. 2002;116:4001. [Google Scholar]
- 134.Song OK, Woodford JN, Wang CH. J. Phys. Chem. A. 1997;101:3222–3226. [Google Scholar]
- 135.Olbrechts G, Strobbe R, Clays K, Persoons A. Rev. Sci. Instrum. 1998;69:2233. [Google Scholar]
- 136.Sainudeen Z, Ray PC. J. Phys. Chem. A. 2005;109:9095. doi: 10.1021/jp052820+. [DOI] [PubMed] [Google Scholar]
- 137.Ray PC, Sainudeen Z. J. Phys. Chem. A. 2006;110:12342. doi: 10.1021/jp063930z. [DOI] [PubMed] [Google Scholar]
- 138.Stadler S, Bourhill G, Brauchle C. J. Phys. Chem. 1996;100:6927. doi: 10.1364/ol.21.000251. [DOI] [PubMed] [Google Scholar]
- 139.Liao Y, Firestone KA, Bhattacharjee S, Luo J, Haller M, Hau S, Anderson CA, Lao D, Eichinger BE, Robinson BH, Reid PJ, Jen AKY, Dalton LR. J. Phys. Chem. B. 2006;110:5434. doi: 10.1021/jp060233y. [DOI] [PubMed] [Google Scholar]
- 140.Liao Y, Bhattacharjee S, Firestone KA, Eichinger BE, Paranji R, Anderson CA, Robinson BH, Reid PJ, Dalton LR. J. Am. Chem. Soc. 2006;128:6847. doi: 10.1021/ja057903i. [DOI] [PubMed] [Google Scholar]
- 141.Gao J, Cui Y, Yu J, Wang Z, Wang M, Qiu J, Qian G. Macromolecules. 2009;42:2198. [Google Scholar]
- 142.Levine BF, Bethea CG. J.Chem.Phys. 1975;63:2666. [Google Scholar]
- 143.Xing-Hua Z, Jingdong L, Su H, Tae-Dong K, Zhengwei S, Yen-Ju, Sei-Hum J, Daniel KB, Jr, Overney ReneM, Jen AlexK-Y. Adv. Mater. 2009;21:1976. [Google Scholar]
- 144.Hendrickx E, Clays K, Persoons A. Acc. Chem. Res. 1998;31:675. [Google Scholar]
- 145.Clays K, Persoons A. Phys. Rev. Lett. 1991;66:2980. doi: 10.1103/PhysRevLett.66.2980. [DOI] [PubMed] [Google Scholar]
- 146.Clays K, Persoons A, De Maeyer L. Advances in Chemical Physics. In: Prigogine I, Rice SA, editors. Modern Nonlinear Optics. Vol. 85. New York: John Wiley & Sons; 1994. [Google Scholar]
- 147.Terhune RW, Maker PD, Savage CM. Phys. Rev. Lett. 1965;14:681. [Google Scholar]
- 148.Cyvin SJ, Rauch JE, Decius JC. J. Chem. Phys. 1965;43:4083. [Google Scholar]
- 149.Bersohn R, Pao Y-H, Frisch HJ. J. Chem. Phys. 1966;45:3184. [Google Scholar]
- 150.Ray PC, Das PK. J. Phys. Chem. 1995;99:14414. [Google Scholar]
- 151.Ray PC. Chem. Phys. Lett. 1996;248:27. [Google Scholar]
- 152.Ray PC, Das PK. J. Phys. Chem. 1996;100:15631. [Google Scholar]
- 153.Das PK. J. Phys. Chem. B. 2006;110:7621. doi: 10.1021/jp0562983. [DOI] [PubMed] [Google Scholar]
- 154.Mie G. Ann. Phys. 1908;25:377. [Google Scholar]
- 155.Kelly L, Coronado E, Zhao LL, Schatz GC. J. Phys. Chem. B. 2003;107:668. [Google Scholar]
- 156.Hubert C, Billot L, Adam PM, Bachelot R, Royer P, Grand J, Gindre D, Dorkenoo KD, Fort A. Appl. Phys. Lett. 2007;90:11805. [Google Scholar]
- 157.Singh AK, Senapati D, Neely A, Kolawole G, Ray PC. Chem. Phys. Lett. 2009;481:94. [Google Scholar]
- 158.Rossi ZM, Celebrano M, Biagioni P, Polli D, Finazzi M, Duò L, Cerullo G, Labardi M, Allegrini M, Grand J, Adam P-M. Appl. Phys. Lett. 2008;92:093119. doi: 10.1111/j.1365-2818.2008.01892.x. [DOI] [PubMed] [Google Scholar]
- 159.Addison CJ, Konorov SO, Brolo AG, Blades MW, Turner RFB. J. Phys. Chem. C. 2009;113:3586. [Google Scholar]
- 160.Lesuffleur A, Kumar L, Gordon R. Appl. Phys. Lett. 2006;88:2611104. [Google Scholar]
- 161.Ding L, DeSheng J, Jun H, Erdan G, Liren L, Zhifang; C, De'an L. J. Phys. Chem. C. 2008;112:10266. [Google Scholar]
- 162.Kulyk B, Sahraoui BO, Krupka V, Kapustianyk V, Rudyk E, Berdowska S, Tkaczyk KI. J. Appl. Phys. 2009;106:093102. [Google Scholar]
- 163.Aslam F, Brinks DJ, Rahn MD, West DP, O’Brien P, Pickett N, Daniels S. J. Chem. Phys. 2005;122:184713. doi: 10.1063/1.1896350. [DOI] [PubMed] [Google Scholar]
- 164.Canek FH, Suh DJ, Kippelen B, Marder SR. Appl. Phys. Lett. 2004;85:534. [Google Scholar]
- 165.Lambert RD, Yannick M, Christine G, Jean-Claude P, Jacques B, Hiromitsu; H, Yoshiaki U. Japn. J. Appl. Phys. 2006;45:7525. [Google Scholar]
- 166.Jeremie T, Ronan LD, Christine G, Yannick M, Jacques B, Jean-Claude P. J. Non-Cryst. Sol. 2004;341:152. [Google Scholar]
- 167.Chaieb A, Halimi O, Bensouici A, Boudine B, Sahraoui B. J. Optoelec. Adv. Mater. 2009;11:104. [Google Scholar]
- 168.Chan Z, Yuhong D, Miao F, Hongbing Z. Appl. Phys. Lett. 2008;93:143108. [Google Scholar]
- 169.Zhang Y, Ming M, Wang X, Fu D, Zhang H, Liu JN, Lu Z, Xu K, Chen J. Phys. Chem. Solids. 2003;64:927. [Google Scholar]
- 170.Petrov DV, Santos BS, Pereira GAL, de Mello Donega C. J. Phys. Chem. B. 2002;106:5325. [Google Scholar]
- 171.Cole JJ, Wang X, Knuesel RJ, Jacobs HO. Nano Lett. 2008;8:1477. doi: 10.1021/nl0804809. [DOI] [PubMed] [Google Scholar]
- 172.Zhang Y, Zhou H, Liu SW, Tian R, Xiao M. Nano Lett. 2009;9:2109. doi: 10.1021/nl900622q. [DOI] [PubMed] [Google Scholar]
- 173.Yagi I, Idojiri S, Awatani T, Uosaki K. J. Phys. Chem. B. 2005;109:5021. doi: 10.1021/jp045458s. [DOI] [PubMed] [Google Scholar]
- 174.Zhang CX, Zhang Y, Wang X, Tang ZM, Lu ZH. Anal. Biochem. 2003;320:136. doi: 10.1016/s0003-2697(03)00353-1. [DOI] [PubMed] [Google Scholar]
- 175.Antoine RI, Huang J, Benichou E, Bachelier G, Jonin C, Brevet P-F. Chem. Phys. Lett. 2008;450:345. [Google Scholar]
- 176.Subramanian A, Irudayaraj J, Ryan T. Biosens. Bioelectron. 2006;21:998. doi: 10.1016/j.bios.2005.03.007. [DOI] [PubMed] [Google Scholar]
- 177.Gao JH, Li L, Ho PL, Mak GC, Gu HW, Xu B. Adv. Mater. 2006;18:3145. [Google Scholar]
- 178.Sengupta A, Mujacic M, James Davis E. Anal. Bioanal. Chem. 2006:1379. doi: 10.1007/s00216-006-0711-z. [DOI] [PubMed] [Google Scholar]
- 179.Pöhlmann C, Wang Y, Humenik M, Heidenreich B, Gareis M, Sprinzl M. Biosensors and Bioelectronics. 2009;24:2766. doi: 10.1016/j.bios.2009.01.042. [DOI] [PubMed] [Google Scholar]
- 180.Mao X, Yang L, Su XL, Li Y. Biosensors and Bioelectronics. 2006;21:1178. doi: 10.1016/j.bios.2005.04.021. [DOI] [PubMed] [Google Scholar]
- 181.Sharma VKJ. Food Prot. 2002;65:1371. doi: 10.4315/0362-028x-65.9.1371. [DOI] [PubMed] [Google Scholar]
- 182.Laczka O, Baldrich E, Muňoz FX, del Campo FJ. Anal. Chem. 2008;80:7239. doi: 10.1021/ac800643k. [DOI] [PubMed] [Google Scholar]
- 183.Vestergaarn M, Kerman K, Kim DK, Hiep HM, Tamiya E. Talanta. 2008;74:1038. doi: 10.1016/j.talanta.2007.06.009. [DOI] [PubMed] [Google Scholar]
- 184.Czasch S, Paul S, Baumgärtner W. Neurobiology of Aging. 2006;27:293. doi: 10.1016/j.neurobiolaging.2005.02.017. [DOI] [PubMed] [Google Scholar]
- 185.Yamamori H, Khatoon S, Iqbal IG, Blennow K, Ewers M, Hampel H, Iqbal K. Nurosci Lett. 2007;418:186. doi: 10.1016/j.neulet.2007.03.022. [DOI] [PMC free article] [PubMed] [Google Scholar]
- 186.Elghanian R, Storhoff JJ, Mucic RC, Letsinger RL, Mirkin CA. Science. 1997;277:1078. doi: 10.1126/science.277.5329.1078. [DOI] [PubMed] [Google Scholar]
- 187.Wu Y, Liu S, He L. Ananl. Chem. 2009;81:7015. doi: 10.1021/ac9011254. [DOI] [PubMed] [Google Scholar]
- 188.He L, Musick MD, Nicewarner SR, Salinas FG, Benkovic SJ, Natan MJ, Keating CD. J. Am. Chem. Soc. 2000;122:9071. [Google Scholar]
- 189.Cao YWC, Jin RC, Mirkin CA. Science. 2002;297:1536. doi: 10.1126/science.297.5586.1536. [DOI] [PubMed] [Google Scholar]
- 190.Abe A, Inoue K, Tanaka T, Kato J, Kajiyama N, Kawaguchi R, Tanaka S, Yoshiba M, Kohara M. J. Clin. Microbio. 1999;37:2899. doi: 10.1128/jcm.37.9.2899-2903.1999. [DOI] [PMC free article] [PubMed] [Google Scholar]
- 191.Liu X, Tan W. Anal. Chem. 1999;71:5054. doi: 10.1021/ac990561c. [DOI] [PubMed] [Google Scholar]
- 192.Yu CJ, Tseng WL. Langmuir. 2008;24:12717. doi: 10.1021/la802105b. [DOI] [PubMed] [Google Scholar]
- 193.Yi CY, Zare RN. Surface plasmon resonance analysis of aqueous mercuric ions. Sens. Actuators B Chem. 2004;99:216. [Google Scholar]
- 194.Jena BK, Raj CR. Ananlyt. Chem. 2008;80:4836. doi: 10.1021/ac071064w. [DOI] [PubMed] [Google Scholar]
- 195.Wang G, Lim C, Chen L, Chon H, Choo J, Hong J, deMello AJ. Anal. Bioanal. Chem. 2009;394:1827. doi: 10.1007/s00216-009-2832-7. [DOI] [PubMed] [Google Scholar]
- 196.Horvath MZ, Barnes RM. Appl. Spectrosc. 1985;39:558. [Google Scholar]
- 197.Yang YK, Yook KJ, Tae J. J. Am. Chem. Soc. 2005;127:16760. doi: 10.1021/ja054855t. [DOI] [PubMed] [Google Scholar]


