

Abstract
Background and purpose:
There is high interindividual variability in the activity of drug-metabolizing enzymes catalysing the oxidation of oxycodone [cytochrome P450 (CYP) 2D6 and 3A], due to genetic polymorphisms and/or drug–drug interactions. The effects of CYP2D6 and/or CYP3A activity modulation on the pharmacokinetics of oxycodone remains poorly explored.
Experimental approach:
A randomized crossover double-blind placebo-controlled study was performed with 10 healthy volunteers genotyped for CYP2D6 [six extensive (EM), two deficient (PM/IM) and two ultrarapid metabolizers (UM)]. The volunteers randomly received on five different occasions: oxycodone 0.2 mg·kg−1 and placebo; oxycodone and quinidine (CYP2D6 inhibitor); oxycodone and ketoconazole (CYP3A inhibitor); oxycodone and quinidine+ketoconazole; placebo. Blood samples for plasma concentrations of oxycodone and metabolites (oxymorphone, noroxycodone and noroxymorphone) were collected for 24 h after dosing. Phenotyping for CYP2D6 (with dextromethorphan) and CYP3A (with midazolam) were assessed at each session.
Key results:
CYP2D6 activity was correlated with oxymorphone and noroxymorphone AUCs and Cmax (−0.71 < Spearman correlation coefficient ρs < −0.92). Oxymorphone Cmax was 62% and 75% lower in PM than EM and UM. Noroxymorphone Cmax reduction was even more pronounced (90%). In UM, oxymorphone and noroxymorphone concentrations increased whereas noroxycodone exposure was halved. Blocking CYP2D6 (with quinidine) reduced oxymorphone and noroxymorphone Cmax by 40% and 80%, and increased noroxycodone AUC∞ by 70%. Blocking CYP3A4 (with ketoconazole) tripled oxymorphone AUC∞ and reduced noroxycodone and noroxymorphone AUCs by 80%. Shunting to CYP2D6 pathway was observed after CYP3A4 inhibition.
Conclusions and implications:
Drug–drug interactions via CYP2D6 and CYP3A affected oxycodone pharmacokinetics and its magnitude depended on CYP2D6 genotype.
Keywords: oxycodone, oxymorphone, pharmacokinetics, phenotypes, CYP2D6, CYP3A, drug–drug interactions
Introduction
Oxycodone is a potent semi-synthetic µ opioid agonist analgesic in clinical use since 1916 (Falk, 1917). It has therefore bypassed the now conventional pharmacological studies assessing specifically its pharmacokinetics and pharmacodynamics. A high interindividual variability in the activity of cytochrome P450 (CYP) 2D6 and CYP3A, the major drug-metabolizing enzymes responsible for oxycodone oxidation, has been extensively described and is due to drug–drug interactions and/or genetic polymorphisms for CYP2D6 (Samer et al., 2005). The activity of CYP2D6 may also influence risks for substance dependence (Tyndale et al., 1997). The possible role of an active metabolite in the pharmacodynamics of oxycodone has been questioned, but whether CYP2D6 genetic polymorphism results in phenotypic differences in the antinociceptive response has not been fully investigated (Kaiko et al., 1996; Heiskanen et al., 1998; Lalovic et al., 2006; Samer et al., 2006). The importance of CYP3A mediated effects on the pharmacokinetics and pharmacodynamics of oxycodone needs further investigation.
In vitro and in vivo studies have demonstrated that oxycodone metabolism proceeds through four metabolic pathways: N-demethylation, O-demethylation, 6-ketoreduction and glucurono-conjugation (Cone et al., 1983). CYP3A catalyses the N-demethylation to the major (80%) circulating metabolite, noroxycodone whereas CYP2D6 catalyses the O-demethylation to oxymorphone which accounts for 10% of oxycodone metabolites (Lalovic et al., 2004). The additional O-demethylation of noroxycodone to the didemethylated metabolite, noroxymorphone, is also catalysed by CYP2D6 (Lalovic et al., 2004) (Figure 1). These metabolites have varying potencies and affinities for the µ opioid receptor (MOR; nomenclature follows Alexander et al., 2009). Oxymorphone is 14 times more potent than oxycodone (Chen et al., 1991). Its affinity for the MOR is 40- and threefold higher than oxycodone and morphine respectively. The affinity of noroxymorphone at the MOR is three- and 10-fold higher than oxycodone and noroxycodone respectively. MOR affinities for each oxycodone metabolite can be therefore summarized, in order of highest to lowest, as oxymorphone>morphine>noroxymorphone>oxycodone>noroxycodone.
Figure 1.
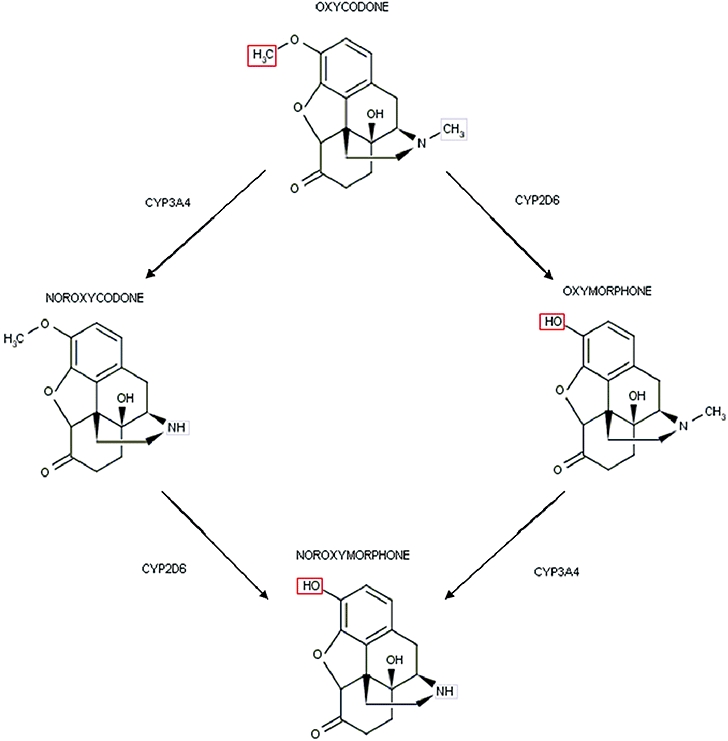
CYP2D6-mediated O-demethylation and CYP3A-mediated N-demethylation of oxycodone and metabolites. CYP3A catalyses the N-demethylation to the major (80%) circulating metabolite noroxycodone whereas CYP2D6 catalyses the O-demethylation to oxymorphone which accounts for 10% of oxycodone metabolites. The additional O-demethylation of noroxycodone to the didemethylated metabolite noroxymorphone is also catalysed by CYP2D6. CYP, cytochrome P450.
Literature on the significance of the CYP3A pathway on the pharmacokinetics of oxycodone is sparse. Co-administration of the CYP3A inducer rifampicin has been associated with negative urine oxycodone screening (Lee et al., 2006) and a dramatic reduction in oxycodone exposure in healthy volunteers (Nieminen et al., 2009). The consequences of CYP3A inhibition have not been extensively described. In healthy volunteers, it was recently shown that voriconazole leads to increased oxycodone exposure (Hagelberg et al., 2009). In the case of codeine, Caraco et al. (1996) suggested that CYP3A inhibition results in a shunt to the CYP2D6 pathway. Further, inhibition of CYP3A by drugs, in the context of CYP2D6 genetic polymorphism, can result in serious clinical consequences even after small codeine doses (Gasche et al., 2004). Therefore, the role of CYP3A in oxycodone metabolism needs to be further investigated.
We demonstrate in this exploratory study with 10 healthy volunteers that both CYP2D6 and CYP3A activities (modulated by selective inhibition) influenced the pharmacokinetics of oxycodone and its metabolites and that the magnitude of the effect was modulated by the CYP2D6 genotype.
Methods
This five-arm randomized double-blind double-dummy crossover placebo-controlled study was approved by the institutional ethical committee of the Anaesthesiology, Pharmacology and Intensive care Department, Geneva University Hospitals, notified to the Swiss Agency for therapeutic products (Swissmedic) and performed according to Good Clinical Practices.
Ten healthy non-smoking male volunteers were included who had no history of illicit drugs consumption or opioid contraindications, had normal medical examination, ECG, liver and kidney functions and were not taking any medications.
The Latin squares method was used for randomization. The five crossover phases were separated by at least 1 week, as a washout period. The fasting volunteers received a single oral dose of the CYP2D6 blocker quinidine (100 mg), the CYP3A4 blocker ketoconazole (400 mg) or matching placebos. Microdoses of midazolam (75 µg) and dextromethorphan (2.5 mg) were given orally 1 h later. A single oral dose of oxycodone hydrochloride (Oxynorm®, Mundipharma) (0.2 mg·kg−1; drops) or matching placebo was given 1 h later. Naloxone (0.8 mg) was injected intravenously 1.5 h after oxycodone or placebo.
Pharmacokinetic measurements
Blood samples (8 mL) for plasma concentration of oxycodone, oxymorphone, noroxycodone and noroxymorphone were drawn from an indwelling catheter in a left forearm vein before oxycodone administration and 0.5, 1, 1.5, 2, 3, 6 and 24 h after dosing. Blood samples were divided in two ethylenediamine-tetraacetic acid (EDTA) tubes, centrifuged at 3350×g for 10 min at 6°C and frozen at −20°C until analysis. Plasma concentrations of the analytes were determined by a validated assay using online column-switching liquid chromatography coupled to tandem mass spectrometric detection (CS-LC-MS/MS). Shortly, plasma proteins were precipitated by adding to 250 µL of plasma sample 500 µL of an acetonitrile/ethanol 1/1 solution containing the internal standard ISTD (oxycodone-d3, 2.5 ng·mL−1). The mixture was vortexed and then centrifuged (15 min at 4°C, 15 000×g). 550 µL of the supernatant were transferred into a 1.5 mL Eppendorf-tube, and evaporated to dryness. The solid residue was reconstituted with 50 µL of 0.1% formic acid in water/acetonitrile 90/10 (v·v−1) and injected on the CS-LC-MS/MS system. The online column-switching was performed with a Prospekt 2 system (Spark, Emmen, the Netherlands). First, the analytes were trapped on a Hysphere Resin GP – 10−12 µm, cartridge. Then they were transferred from the trapping column to the analytical column (XTerra MS 4.6 × 50 mm, 3.5 µm, Waters) and separated in gradient mode (water/acetonitrile/0.1% formic acid) at 1 mL·min−1. Mass spectrometric detection was performed on an 4000 Q TRAP (AB/MDS Sciex, Concord, ON) mass spectrometer in the selected reaction monitoring mode (dwell time = 75 ms). The following transitions and collision energies were selected: oxycodone m/z 316.1→m/z 241.1, 37 eV, oxymorphone m/z 302.3→m/z 198.2, 57 eV, noroxycodone: m/z 302.3→m/z 187.0, 30e, noroxymorphone m/z 288.1→m/z 213.2, 37 eV, oxycodone d3 m/z 319.3→m/z 244.3, 31 eV. Precision and accuracy of quality control samples was found to be better than 15%. The lower limit of quantification (LLOQ) using a plasma aliquot of 0.25 mL were found to be 100 pg·mL−1 for oxycodone and oxymorphone, and 50 pg·mL−1 for noroxycodone and noroxymorphone respectively.
Phenotyping
During the (pre-study) screening visit, a conventional dose (25 mg) of dextromethorphan was given to determine CYP2D6 activity. Microdoses of dextromethorphan (2.5 mg) and midazolam (75 µg) were given to determine CYP2D6 and CYP3A activities, respectively, during the five study sessions to avoid any pharmacodynamic interaction with oxycodone. For CYP2D6, deconjugated dextromethorphan and metabolites were assayed in urine collected during 8 h as described by Daali et al. (2008) and metabolic ratio between deconjugated dextromethorphan and dextrorphan was calculated. CYP3A phenotypes were measured using a previously validated method (Eap et al., 2004). The 30 min total (unconjugated+conjugated) 1-OH- midazolam/midazolam ratios were determined in a single plasma sample using gas chromatography-negative chemical ionization mass spectrometry (GC-NCIMS).
Genotyping
Genomic DNA was extracted from whole blood and genetic variants of CYP2D6 (32 alleles) were identified by the gene AmpliChip™ CYP450 DNA microarray (Roche) as previously described (Rebsamen et al., 2009). CYP2D6 alleles are associated with normal, absent, decreased or increased enzyme activity (http://www.imm.ke.se/CYPalleles). In our study, the following CYP2D6 alleles were identified: *1,*2,*35 associated with normal enzyme activity; *41 displaying decreased enzyme activity; *4,*5,*6 associated with the absence of activity and the *2xN gene duplication resulting in increased enzyme activity. According to the alleles' combinations observed, the CYP2D6 phenotype of each individual was predicted as follows: poor metabolizer (PM) if carrying two non-functional alleles; intermediate (IM), if carrying one non-functional allele and one associated with reduced activity; extensive (EM) if carrying at least one functional allele; ultra rapid (UM) if carrying at least three copies of a functional allele (see detailed predicted phenotype in Table 1).
Table 1.
CYP2D6 genotype and measured CYP2D6 phenotype by dextromethorphan/dextrorphan (DEM/DOR) metabolic ratio, and CYP3A activity measured by 1-OH-midazolam/midazolam (1-OH MID/MID) metabolic ratio, according to the session/pretreatment with placebo, quinidine and/or ketoconazole
| Volunteer | CYP2D6 genotype | Predicted phenotype |
DEM/DOR metabolic ratio |
1-OH MID/MID metabolic ratio |
|||||||||
|---|---|---|---|---|---|---|---|---|---|---|---|---|---|
| Pre-study | Oxy# | Pbo# | Keto# | Quin# | Keto+Quin# | Oxy | Pbo | Keto | Quin | Keto+Quin | |||
| 1 | *5/*35 | EM | 0.0165 | 0.0166 | 0.0042 | 0.0094 | 0.6040 | 0.1120 | 2.85 | 3.6 | 0.04 | 2.37 | 0.06 |
| 2 | *41/*41xN | n.d. | 0.0013 | 0.0008 | 0.0022 | 0.0018 | 0.0291 | 0.0267 | 3.86 | 2.61 | 0.20 | 2.82 | 0.16 |
| 3 | *1/*41 | EM | 0.0017 | 0.0047 | 0.0006 | 0.0022 | 0.3971 | 0.4878 | 1.05 | 2.75 | 0.06 | 0.51 | 0.08 |
| 4 | *5/*41 | IM | 0.22 | 0.0950 | 0.0898 | 0.0561 | 1.7437 | 3.3063 | 0.17 | 1.41 | 0.10 | 0.61 | 0.07 |
| 5 | *4/*35 | EM | 0.031 | 0.0171 | 0.0123 | 0.0378 | 1.7918 | 0.7285 | 0.78 | 0.46 | 0.18 | 1.05 | 0.12 |
| 6 | *2/*41 | EM | 0.0066 | 0.0044 | 0.0058 | 0.0105 | 0.1507 | 0.6122 | 3.12 | 3.78 | 0.12 | 3.95 | 0.08 |
| 7 | *1/*4 | EM | 0.0065 | 0.0031 | 0.0054 | 0.0070 | 0.3915 | 1.2133 | 3.69 | 3.23 | 0.14 | 4.14 | 0.10 |
| 8 | *1/*2xN | UM | 0.0012 | 0.0006 | 0.0089 | 0.0027 | 0.0553 | 0.0458 | 4.25 | 3.55 | 0.14 | 3.15 | 0.07 |
| 9 | *1/*6 | EM | 0.013 | 0.0081 | 0.0039 | 0.0039 | 0.8485 | 0.1502 | 3.90 | 3.24 | 0.06 | 2.73 | 0.22 |
| 10 | *4/*4 | PM | 1.84 | 6.3962 | 4.5134 | 7.5278 | 6.3407 | 1.1127 | 5.81 | 2.64 | 0.07 | 4.14 | 0.08 |
| Median | 0.0098 | 0.0064 | 0.0056 | 0.0082 | 0.3943** | 0.670** | 3.404 | 2.993 | 0.107*** | 2.55 | 0.08** | ||
| IQ25 | 0.0029 | 0.0034 | 0.0040 | 0.0030 | 0.1501 | 0.205 | 1.498 | 2.615 | 0.063 | 0.719 | 0.073 | ||
| IQ75 | 0.0274 | 0.0170 | 0.0115 | 0.0310 | 0.7874 | 1.185 | 3.894 | 3.475 | 0.145 | 3.070 | 0.115 | ||
Using microdoses of dextromethorphan 2.5 mg.
Oxy, oxycodone with placebo; Pbo, placebo with placebo; Keto, oxycodone with ketoconazole; Quin, oxycodone with quinidine; Keto+Quin, oxycodone with ketoconazole and quinidine.
DEM/DOR, dextromethorphan/dextrorphan; 1-OH MID/MID, 1-hydroxy-midazolam/midazolam; n.d. not determined.
CYP2D6 phenotype according to DEM/DOR: PM > 0.3, 0.3 > IM > 0.03, 0.03 > EM > 0.003, 0.003 > UM.
Pairwise comparisons with Oxy:
P < 0.05,
P < 0.01,
P < 0.001.
Data analysis
Pharmacokinetic analysis
The maximum concentration (Cmax), time to Cmax (Tmax), terminal elimination half-life (T1/2z), area under the concentration curve (AUC) extrapolated to infinity AUC∞ (using linear trapezoidal method), AUC/dose and partial areas (AUC90, AUC360, AUC1440) of oxycodone, oxymorphone, noroxycodone and noroxymorphone were estimated from their plasma concentration/time values, by use of non-compartmental methods (WinNonLin 4.01, Pharsight, Mountainview, California).
The software package SPSS 15 for Windows (Chicago, Illinois) was used for the statistical analysis. The normality of the data was assessed by a descriptive analysis and data were normalized by log transformation to allow the use of parametric tests if necessary. Mean values and standard deviations (SD) were used to summarize continuous variables. Multiple repeated analyses of variance (anova) were used to test treatment differences depending on genotype whereas one-way anova was used to test the impact of genotype on oxycodone treatment. Spearman correlation coefficients were used for the correlations between the pharmacokinetics and CYP2D6/3A activities. Two-tailed tests with a significance level of 5% were used in all statistical analyses.
Results
Descriptive population data
Ten healthy male volunteers were enrolled and completed the study (mean age 26 years) with a weight of 76.4 ± 8.1 kg and height of 181.2 ± 5.4 cm. The mean oral oxycodone dose was 15.3 mg (range 13–18 mg).
CYP2D6 phenotyping/genotyping
No difference was observed between the dextromethorphan/dextrorphan metabolic ratio after 25 mg of dextromethorphan and after 2.5 mg of dextromethorphan during the placebo study session. Consistent correlations between genotype and phenotype were observed after conventional doses (25 mg) and microdoses (2.5 mg) of dextromethorphan (Table 1). One subject (#10) was genotyped and phenotyped as a CYP2D6 poor metabolizer (PM). He was homozygous for the deficient allele CYP2D6*4 and had a dextromethorphan/dextrorphan metabolic ratio above 0.3. One heterozygous CYP2D6*5/*41 subject (#4) had a dextromethorphan/dextrorphan of 0.22 and should be considered as IM. Nevertheless, we considered these two individuals as closely related deficient CYP2D6 metabolizers and called them PM for simplification. Two healthy volunteers (#2 and #8) carried gene duplications (CYP2D6*2xN, *41xN) and were phenotyped as UM (dextromethorphan/dextrorphan < 0.003). All other individuals were considered as EM, including #3, who was predicted EM from his genotype (CYP2D6*1/*41), but had slightly increased CYP2D6 activity in pre-study phenotyping.
CYP3A phenotyping
Mean 1-OH-midazolam/midazolam ratio (MR) was 2.727; SD 1.052. The administration of oxycodone alone did not statistically modify CYP3A phenotypes (MR 2.947; SD 1.771). Two volunteers (#4 and #5) had a repeated low CYP3A activity (Table 1).
Effect of drug blockage on CYP2D6 and CYP3A phenotypes
CYP2D6 phenotypes
The extent of phenocopying after oral quinidine varied according to CYP2D6 genotypes as demonstrated by a significant interaction between treatment and genotype in the analysis of variance (P= 0.0009).
As expected in PM for CYP2D6, no statistically significant differences were demonstrated within and between all treatment sessions. All but one EM (#6) were phenotyped as PM for CYP2D6 after quinidine (Table 1). The co-administration of quinidine with ketoconazole had no further significant effect on dextromethorphan/dextrorphan MR values as compared with quinidine alone (P= 0.567) in EM. As expected, quinidine and quinidine+ketoconazole, significantly increased dextromethorphan/dextrorphan as compared with the other sessions, whereas no significant phenotypic differences were demonstrated between oxycodone and placebo (placebo) (P= 0.1921), and between oxycodone and ketoconazole (P= 0.845). In contrast, quinidine was unable to completely block CYP2D6 activity in UM who were phenotyped as EM and IM for CYP2D6 after quinidine (Table 1).
CYP3A4 phenotypes
After ketoconazole, CYP3A blockade was effective in all 10 volunteers, as demonstrated by the 1-OH-midazolam/midazolam MR values, all below 0.22 (Table 1). No differences between quinidine+ketoconazole and ketoconazole alone were demonstrated (0.104 vs. 0.112, P= 0.374). After both sessions, CYP3A activities were significantly lower than after oxycodone (P= 0.0007 and 0.004), quinidine (P= 0.002 and 0.017) and placebo (P= 3.10−5 and 0.001), whereas no difference between oxycodone, quinidine and placebo were observed.
Comparisons of oxycodone and metabolite concentrations in plasma, without CYP inhibitors
The mean plasma concentration versus time curves of oxycodone and metabolites (n= 10) are presented in Figure 2A. Mean oxycodone plasma concentrations were higher than noroxycodone for the first 10 h after dosing (20 h in UM) and mean oxycodone Cmax was 2.5-fold higher than noroxycodone (P < 0.0001). Oxycodone AUC∞ was twice the size of the noroxycodone AUC∞ in UM (10123 vs. 5008 min·ng·mL−1) but only slightly higher in EM and PM. Noroxycodone T1/2 was twice that for oxycodone. Noroxymorphone and oxymorphone AUC∞ were eight and 38 times lower than oxycodone AUC∞ in UM, and six and 51 times lower in EM. In PM, oxymorphone and noroxymorphone plasma concentrations were extremely low. Oxymorphone AUC∞ was 97 times lower than oxycodone.
Figure 2.
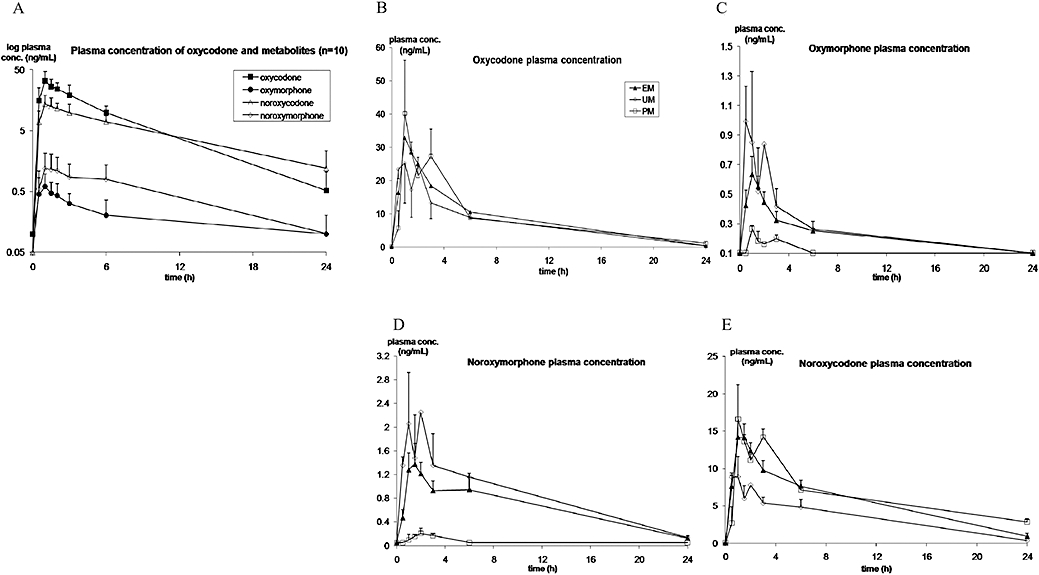
Mean (SD) plasma concentration-time profile of oxycodone and metabolites in 10 healthy volunteers and according to genotype in EM, UM and PM for CYP2D6, after a single 0.2 mg·kg−1 oral dose of immediate release oxycodone. The mean plasma concentration versus time curves of oxycodone and metabolites (n= 10) are presented in panel A (note the concentrations are shown on a log scale), where mean oxycodone plasma concentrations were higher than those of noroxycodone, in turn higher than noroxymorphone and oxymorphone. CYP2D6 phenotypic differences in the plasma concentrations of oxycodone, oxymorphone, noroxymorphone and noroxycodone are presented in panels B–E (concentrations on a linear scale). CYP, cytochrome P450; EM, extensive metabolizer; PM, poor metabolizer; UM, ultrarapid metabolizers.
Impact of CYP2D6 genetic polymorphism on the pharmacokinetics of oxycodone and its metabolites
A moderate inter-individual variability was demonstrated in the pharmacokinetics of oxycodone and noroxycodone (coefficient of variation CV 25–35%) whereas the variability was considerably higher in the pharmacokinetics of the two CYP2D6-dependent metabolites oxymorphone and noroxymorphone (CV 35–105%). Oxycodone and metabolites exhibited CYP2D6 phenotypic-based differences in their pharmacokinetics (Table 2). The mean plasma concentration versus time curves of oxycodone and metabolites in CYP2D6 EM, UM and PM are presented in Figure 2B–E and the derived pharmacokinetic parameters in Table 2.
Table 2.
Mean (SD) estimates of pharmacokinetic parameters for oxycodone and its metabolites according to CYP2D6 genotype
| T1/2 (h) | Tmax (h) | Cmax (ng·mL−1) | AUC90 (min·ng·mL−1) | AUC1440 (min·ng·mL−1) | |
|---|---|---|---|---|---|
| Oxycodone | 4.1 (0.8) | 1.1 (0.3) | 36 (11.2) | 1882 (653) | 12 079 (3121) |
| UM | 3.9 (0.5) | 0.7 (0.3)* | 29 (11.9) | 1740 (823) | 10 033 (1952) |
| EM | 3.8 (0.8) | 1.2 (0.3) | 37 (8.6) | 1946 (647) | 12 486 (3169) |
| PM | 5.2 (0.2) | 1.2 (0.3) | 41 (21.7) | 1833 (1000) | 12 905 (4788) |
| Metabolites | T1/2 (h) | Tmax (h) | Cmax (ng·mL−1) | AUC90 metabolite/parent drug | AUC1440 metabolite/parent drug |
| Oxymorphone | 4.5 (2.1) | 1.0 (0.3) | 0.7 (0.3) | 0.021 | 0.019 |
| UM | 4.4 (2.5) | 0.7 (0.3) | 1 (0.4) | 0.036 | 0.031 |
| EM | 3.3 (1.7) | 1.1 (0.4) | 0.7 (0.3) | 0.021 | 0.021 |
| PM | 6.8 (2.1) | 1.0 (0.1) | 0.3 (0.03)* | 0.006** | 0.003*** |
| Noroxycodone | 6.8 (2.8) | 1.2 (0.4) | 15(4.2) | 0.435 | 0.642 |
| UM | 5.3 (0.3) | 0.7 (0.3)* | 11 (1.5) | 0.361 | 0.484* |
| EM | 5.0 (2.1) | 1.4 (0.4) | 16 (3.8) | 0.456 | 0.653 |
| PM | 11.1(0.3)* | 1.2 (0.3) | 18 (4.7) | 0.439 | 0.732 |
| Noroxymorphone | 12.3 (8.8) | 1.7 (0.9) | 1.4 (0.98) | 0.038 | 0.066 |
| UM | 6.4 (0.8) | 0.7 (0.3)* | 2.2 (1) | 0.073 | 0.117 |
| EM | 12.2 (9.5) | 1.6 (0.8) | 1.6 (0.8) | 0.039 | 0.074 |
| PM | - | 2.6 (0.5)* | 0.2 (0.1)** | 0.003** | 0.003*** |
Mean values (SD). UM, ultrarapid metabolizers; EM, extensive metabolizers; PM, deficient metabolizers for cytochrome P450 (CYP)2D6.
CV, coefficient of variation; Tmax, time to maximum concentration; Cmax, maximum concentration; AUC90, area under the plasma concentration curve (AUC) after 90 min; AUC1440, area under the plasma concentration curve (AUC) after 1440 min; T1/2, half-life.
Comparisons with EM:
P < 0.05,
P < 0.01,
P < 0.001.
Oxycodone T1/2 was prolonged (1.5-fold) in PM compared with EM and UM (P= 0.042 and P= 0.17 respectively) and oxycodone AUC∞ increased by 35% in PM compared with UM.
Oxymorphone exposure was markedly decreased in PM compared with EM and UM. Oxymorphone AUC90 was 83% lower in PM than UM (P= 0.007) and 73% lower than EM (P= 0.013). Oxymorphone Cmax was 75% lower in PM than UM (P= 0.007) and 63% lower than EM (P= 0.015).
Noroxymorphone plasma concentrations were extremely low in PM. Cmax decreased by 85% compared with EM (P= 0.003) and 90% to UM (P= 0.004), whereas noroxymorphone AUC1440 decrease was 25- and 30-fold respectively (P= 1.3.10−5 and P= 2.8.10−5). The opposite was true in UM where Cmax increased by 39% and Tmax decreased by 55% versus EM (P= 0.058) and PM (P= 0.015). Noroxymorphone T1/2 was reduced by 50% in UM compared with EM.
A reduction in noroxycodone exposure was observed in UM compared with EM and PM. Indeed noroxycodone Cmax was reduced by 36% (P= 0.07) and AUC∞ by 43% in comparison with EM (P= 0.032). Conversely, noroxycodone AUC∞ was more than twice as high in PM compared with UM (P= 0.012). However, no significant differences were observed between EM and PM in oxycodone pharmacokinetics.
The phenotypic differences in the pharmacokinetics of oxycodone and metabolites were confirmed by Spearman's rank correlations (Table 3). Strong significant relationships were demonstrated between CYP2D6 activities and the AUCs and Cmax of CYP2D6-dependent metabolites, oxymorphone and noroxymorphone (0.71 < Spearman's correlation coefficient ρS < 0.83, P < 0.05) whereas no correlation between CYP3A activity and the pharmacokinetic parameters of oxymorphone and noroxymorphone were demonstrated. Strong negative correlations between noroxycodone AUC∞, Cmax and T1/2, and CYP2D6 activities were also demonstrated (P < 0.05).
Table 3.
Spearman rank correlation (ρS) between CYP2D6 and CYP3A phenotypes* and the pharmacokinetic parameters of oxycodone and its metabolites according to pretreatment with placebo, ketoconazole or/and quinidine
| PK parameters |
Oxy |
Keto |
Quin |
Keto+Quin |
|||||||||||||
|---|---|---|---|---|---|---|---|---|---|---|---|---|---|---|---|---|---|
|
CYP2D6 |
CYP3A |
CYP2D6 |
CYP3A |
CYP2D6 |
CYP3A |
CYP2D6 |
CYP3A |
||||||||||
| ρS | P-value | ρS | P-value | ρS | P-value | ρS | P-value | ρS | P-value | ρS | P-value | ρS | P-value | ρS | P-value | ||
| Oxycodone | AUC90 | 0.079 | 0.829 | 0.297 | 0.405 | −0.188 | 0.603 | 0.467 | 0.174 | −0.430 | 0.215 | −0.273 | 0.446 | 0.285 | 0.425 | −0.031 | 0.933 |
| Cmax | −0.309 | 0.385 | 0.382 | 0.276 | −0.818 | 0.004 | 0.115 | 0.751 | 0.176 | 0.627 | −0.176 | 0.627 | 0.273 | 0.446 | 0.720 | 0.019 | |
| Noroxycodone | AUC90 | −0.152 | 0.676 | 0.309 | 0.385 | −0.333 | 0.347 | 0.042 | 0.907 | −0.636 | 0.048 | −0.115 | 0.751 | −0.164 | 0.652 | −0.579 | 0.080 |
| Cmax | −0.648 | 0.043 | 0.467 | 0.174 | −0.943 | 0.005 | 0.543 | 0.266 | −0.224 | 0.533 | −0.139 | 0.701 | 0.536 | 0.215 | 0.432 | 0.333 | |
| Oxymorphone | AUC90 | 0.782 | 0.008 | −0.321 | 0.365 | 0.758 | 0.011 | −0.176 | 0.627 | 0.030 | 0.934 | −0.103 | 0.777 | 0.237 | 0.509 | −0.429 | 0.216 |
| Cmax | 0.830 | 0.003 | −0.333 | 0.347 | −0.583 | 0.099 | −0.233 | 0.546 | 0.406 | 0.244 | −0.503 | 0.138 | −0.595 | 0.119 | −0.293 | 0.482 | |
| Noroxymorphone | AUC90 | 0.758 | 0.011 | −0.273 | 0.446 | 0.733 | 0.016 | −0.515 | 0.128 | 0.248 | 0.489 | −0.588 | 0.074 | −0.325 | 0.359 | −0.724 | 0.018 |
| Cmax | 0.806 | 0.005 | −0.309 | 0.385 | −0.829 | 0.042 | 0.143 | 0.787 | 0.576 | 0.081 | −0.770 | 0.009 | −0.252 | 0.482 | −0.713 | 0.021 | |
Cmax, maximum concentration; AUC ∞/D, area under the plasma concentration curve (AUC) extrapolated to infinity under dose; T1/2, half-life.
Sessions: Oxy, oxycodone+placebo; Keto, oxycodone+ketoconazole; Quin, oxycodone+quinidine; Keto+Quin, oxycodone+ketoconazole+quinidine.
Statistically significant results are shown in bold.
CYP2D6 and CYP3A phenotypes, respectively, measured by dextromethorphan/dextrorphan and 1-OH-midazolam/midazolam metabolic ratios.
Effect of CYP2D6 and CYP3A4 blockade on the pharmacokinetics of oxycodone and metabolites
The effects of quinidine and/or ketoconazole pretreatment on the plasma concentrations of oxycodone and metabolites are described in Figure 3A–D and individual pharmacokinetic parameters are presented in Table 4.
Figure 3.
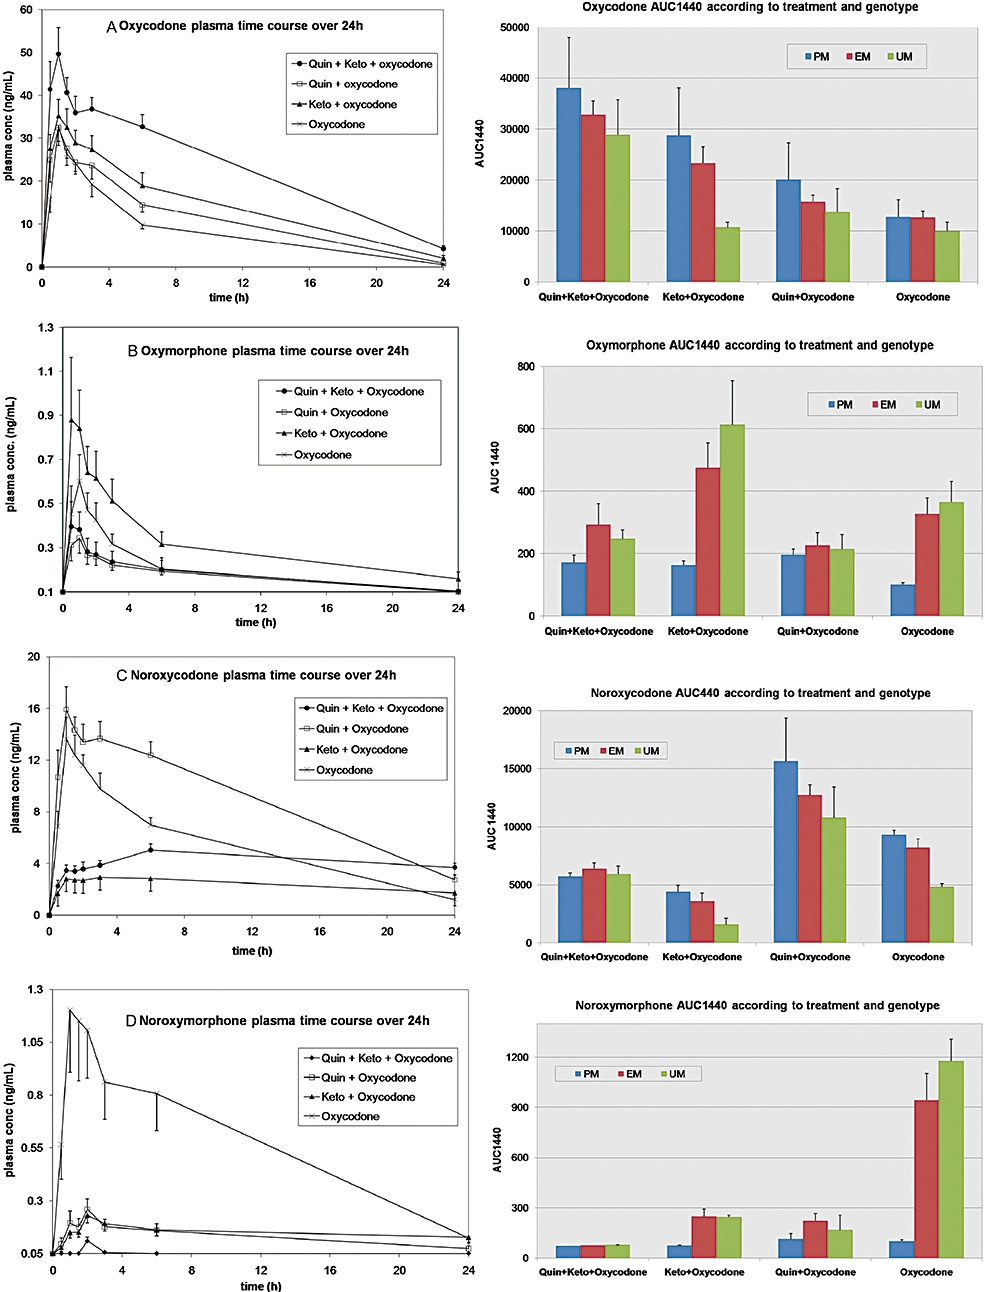
Mean (SEM) plasma concentration-time profile and AUC1440 (SEM) of oxycodone and metabolites in 10 healthy volunteers after a single 0.2 mg·kg−1 oral dose of immediate release oxycodone±quinidine±ketoconazole, according to CYP2D6 genotype. The effect of CYP2D6 and/or CYP3A inhibition by quinidine (Quin) or ketoconazole (K or Keto), as well as CYP2D6 genotype, on the plasma concentration-time profile and AUC1440 of oxycodone, oxymorphone, noroxymorphone and noroxycodone are presented. AUC, area under the concentration curve; CYP, cytochrome P450.
Table 4.
Mean (SD) pharmacokinetic parameters of oxycodone and its metabolites after inhibition of CYP2D6 (with quinidine) and CYP3A (with ketoconazole) in healthy male volunteers
| Session | T1/2 (h) | Tmax (min) | Cmax (ng·mL−1) | AUC∞ (min·ng·mL−1) | AUC90 (min·ng·mL−1) | |
|---|---|---|---|---|---|---|
| Oxycodone | Quin | 4.3 (0.5) | 82 (54) | 36.4 (7.2) | 16 461 (5324)*** | 16 126 (5102)*** |
| Keto | 5.5 (1.3)** | 86 (57) | 39.2 (12.4) | 21 391 (9410)** | 2 383 (799) | |
| Keto+Quin | 6.5 (1.4)** | 62 (47) | 56.9 (17.6)** | 35 998 (9915)*** | 3 442 (1014)*** | |
| Oxy | 4.1 (0.8) | 66 (19) | 36 (11.2) | 11 633 (3102) | 1 882 (653) | |
| Oxymorphone | Quin | 6.6 (3.3) | 91 (62) | 0.4 (0.2)** | 196 (59) | 22 (16)* |
| Keto | 20.8 (24)** | 46 (17) | 1.0 (0.8) | 755 (380)** | 60 (47)* | |
| Keto+Quin | 12.8 (12.7)* | 37 (15) | 0.4 (0.3)** | 347 (201) | 34 (18) | |
| Oxy | 4.5 (2.1) | 58 (20) | 0.7 (0.3) | 218 (113) | 39 (25) | |
| Noroxycodone | Quin | 8.6 (1.4) | 94 (59) | 18 (4.4) | 15 028 (4274)** | 1 024 (356) |
| Keto | 19.9 (16.5)* | 309 (412)** | 3.4 (1.1)** | 7 510 (9236) | 179 (80)** | |
| Keto+Quin | 49.7 (54.6)* | 681 (562)** | 5.4 (1.1)** | 24 208 (25 329)* | 232 (96)** | |
| Oxy | 6.8 (2.8) | 73 (25) | 15 (4.2) | 8 726 (30) | 819 (252) | |
| Noroxymorphone | Quin | 10.4 (4.4)* | 134 (85)* | 0.3 (0.2)*** | 320 (187)* | 12 (12)** |
| Keto | 43.3 (33.1) | 121 (29) | 0.2 (0.1)*** | 966 (629)*** | 8.4 (6.2)** | |
| Keto+Quin | – | 130 (27)* | 0.1 (0.1)*** | –*** | 0.03 (0.01)*** | |
| Oxy | 12.3 (8.8) | 99 (53) | 1.4 (1) | 1681 (1765) | 72 (55) |
Sessions: Oxy, oxycodone+placebo; Keto, oxycodone+ketoconazole; Quin, oxycodone+quinidine; Keto+Quin, oxycodone+ketoconazole+quinidine. T1/2, half-life; Tmax, time to maximum concentration; Cmax, maximum concentration; AUC∞, area under the plasma concentration curve (AUC) extrapolated to infinity; AUC90, AUC for 90 min after dosing.
Comparisons with Oxy:
P < 0.05,
P < 0.01,
P < 0.001.
Effect of quinidine
Overall, quinidine dramatically decreased oxymorphone Cmax and AUC360 by 40% (P= 0.01 and 0.044) as compared with oxycodone alone. This effect was even more pronounced (80% decrease) on noroxymorphone Cmax and AUC360 (P= 0.0009 and 0.0006). However, the blockade was not complete as oxymorphone and noroxymorphone were still detectable in the samples. A 1.5- and 8.5-fold increase in oxycodone AUC∞ (P= 0.0004) and AUC90 (P= 5.10−8) were, respectively, observed after quinidine, and a 20–30% decrease in the clearance CL/F (P= 0.0003) and volume of distribution Vz/F (P= 0.009). An apparent compensatory 70% increase in noroxycodone AUC∞ was observed (P= 0.0004).
Differences among CYP2D6 genotypic groups were observed. The increase in noroxycodone exposure was more pronounced in UM than EM, and, in turn, in EM than in PM.
Effect of ketoconazole
After ketoconazole, both noroxycodone and noroxymorphone Cmax decreased by 80% (P= 10−7 and 0.0005), and their exposure was also reduced (P= 0.007 and 0.017). Significant differences between quinidine and ketoconazole for all the assessed pharmacokinetic parameters of noroxycodone were demonstrated, but no significant difference between quinidine and ketoconazole were found for the pharmacokinetic parameters of noroxymorphone.
A shunt to the CYP2D6 pathway was clearly observed after ketoconazole, although a 3.5-fold increase in oxymorphone AUC∞ (P= 0.0004); indeed, 1.5-fold increase in Cmax and fourfold longer T1/2 (not significant NS) were observed. Statistically significant differences were demonstrated between ketoconazole and quinidine in all the assessed pharmacokinetic parameters of oxymorphone.
An increased AUC∞ for oxycodone (1.8-fold; P= 0.004) was observed after ketoconazole which was slightly higher than what was observed after quinidine (NS), but the magnitude of CL/F and Vz/F decreases were same as oxycodone alone (P= 0.003 and 0.075). No significant differences in the pharmacokinetics of oxycodone after quinidine and ketoconazole were demonstrated except for the AUC90 (P= 2.10−8) and T1/2 (4.3 vs. 5.5 h, P= 0.009).
Effect of ketoconazole+quinidine co-administration
Quinidine and ketoconazole co-administration had a cumulative effect on oxycodone exposure with a threefold higher AUC∞ (P= 2.10−10) and a 1.5-fold higher Cmax (P= 0.002) and T1/2 (P= 8.10−6) as compared with oxycodone alone, whereas oxycodone CL/F was reduced by 70% (P= 7.10−7). In all assessed oxycodone pharmacokinetic parameters, significant differences were demonstrated between ketoconazole+quinidine and both quinidine and ketoconazole alone. Oxycodone Cmax and AUC360 were 1.7-fold higher after ketoconazole+quinidine than after quinidine (P= 0.001 and 2.10−5) and one- to fourfold higher than after ketoconazole (P= 0.001 and 0.004).
Ketoconazole+quinidine reduced oxymorphone and noroxycodone Cmax by 40% (P= 0.009) and 60% (P= 10−6), respectively, as compared with oxycodone alone. Noroxycodone AUC360 was also reduced by 60% (P= 0.0003), whereas no significant reduction in oxymorphone AUCs were noticed versus oxycodone alone (P > 0.05). Ketoconazole+quinidine was less effective in reducing noroxycodone exposure than ketoconazole alone. Indeed noroxycodone Cmax was 1.7-fold lower after ketoconazole than ketoconazole+quinidine (P= 0.004) and noroxycodone AUC∞ was more than threefold lower (P= 0.016).
The addition of ketoconazole to quinidine had no significant effect on most pharmacokinetic parameters of oxymorphone, compared with those after quinidine alone, whereas it significantly reduced oxymorphone Cmax and AUCs, compared with the effects of ketoconazole alone. As expected, the combination dramatically reduced noroxymorphone plasma concentrations to low to undetectable levels (P < 0.0001). Most of the assessed pharmacokinetic parameters of noroxymorphone were significantly lower after quinidine+ketoconazole than after ketoconazole or quinidine alone.
Effect of CYP2D6 and CYP3A4 blockade on the pharmacokinetics of oxycodone and metabolites
Spearman rank correlations
Spearman rank correlation coefficients (ρS) between CYP2D6 and CYP3A activities and the pharmacokinetic parameters of oxycodone and metabolites during the different sessions (oxycodone, oxycodone+ketoconazole, oxycodone+quinidine and oxycodone+ketoconazole+quinidine) are presented in Table 3.
After ketoconazole, most pharmacokinetic parameters of oxymorphone and noroxymorphone were highly correlated with CYP2D6 activity, compared with oxycodone alone (ρS < 0.75), whereas it was only the case for oxycodone Cmax (ρs= 0.818, P= 0.004) and both noroxycodone Cmax (ρs= 0.943, P= 0.005) and Tmax (ρs= 0.673, P= 0.033). Oxycodone T1/2 was correlated with CYP3A activity (ρs= 0.697, P= 0.025) and a trend for oxycodone AUC∞ (ρs= 0.612, P= 0.06) was still observed.
After quinidine, the metabolites noroxymorphone and oxymorphone were no longer clearly correlated with CYP2D6 activity. Interestingly some pharmacokinetic parameters were now correlated with CYP3A activity such as noroxymorphone AUC360 (ρs=−0.7818, P= 0.008) and Cmax (ρs=−0.7697, P= 0.009), as well as oxymorphone Tmax (ρs= 0.6606, P= 0.038) and a trend for oxymorphone AUC360 (ρs=−0.5879, P= 0.07). Oxycodone and noroxycodone Tmax were in turn strongly inversely correlated with CYP2D6 activity (ρs=−0.903, P= 0.0003, and ρs =−0.8545, P= 0.002), as well as noroxycodone AUC90 (ρs=−0.6364, P= 0.048).
After the combination of quinidine and ketoconazole, no correlations with CYP2D6 phenotype were demonstrated.
Discussion
This randomized double-blind placebo-controlled study assesses the effects of CYP2D6 and CYP3A activity on the pharmacokinetics of oxycodone and metabolites. We demonstrated a clear effect of drug–drug interaction (CYP2D6 or CYP3A blockade) mimicking deficient metabolism on the pharmacokinetics of oxycodone and the influence of CYP2D6 genetic polymorphism on the magnitude of this drug–drug interaction.
Effects of CYP2D6 genetic polymorphism on the pharmacokinetics of oxycodone and metabolites
Our study offers new insight in the pharmacokinetics of oxycodone and metabolites in previously genotyped and/or phenotyped subjects for CYP2D6. Differences in the time course of the plasma concentrations of oxycodone metabolites depending on CYP2D6 genotype were clearly observed. The limit of our analyses was that the sample size of the study was small. Two UM and 2 PM were included among 10 healthy volunteers. However, our data strongly suggested that CYP2D6 genotype affects oxycodone pharmacokinetics.
In CYP2D6 deficient metabolizers (PM), circulating oxymorphone was markedly lower than in EM and UM (62% and 75% Cmax respective decrease, and 85% AUC1440 reduction). The reduction of noroxymorphone exposure was even higher (85–90% Cmax decrease, and 24 and 32 times lower AUC1440 than EM and UM respectively). However, oxymorphone plasma concentrations were still measurable in PM. Other metabolic pathways may therefore be involved in the formation of oxymorphone when CYP2D6 is absent or non functional. In lymphoblast microsomes, it was demonstrated that aside from CYP2D6, both CYP2C19 and CYP1A1 (Lalovic et al., 2004) may be involved in the formation of oxymorphone from oxycodone, although their contribution appears minor, at least at their constitutive level of expression.
The pharmacokinetics of oxycodone and metabolites was assessed in CYP2D6 UM. Oxycodone pharmacokinetic parameters were reduced as compared with EM (44% and 20% lower Tmax and Cmax), and oxycodone AUC∞ was 33% lower than PM. Inversely, higher plasma levels and exposure of both oxymorphone and noroxymorphone were observed whereas noroxycodone exposure and T1/2 were halved in UM compared with both EM and PM.
A strong relationship between the CYP2D6 dependent metabolites, oxymorphone and noroxymorphone, and CYP2D6 activity was demonstrated. The latter accounts probably for the higher interindividual variability in the pharmacokinetics of CYP2D6 dependent metabolites, oxycodone and noroxymorphone (CV 35–105%), than oxycodone and noroxycodone (CV 25–35%). Noroxycodone pharmacokinetics was also inversely correlated with CYP2D6 activity, but not with CYP3A phenotype. Indeed, when CYP2D6 was deficient, a shunt to metabolism via CYP3A was observed, and when CYP2D6 was hyperactive, less noroxycodone was produced. The shift to CYP3A pathway in CYP2D6 PM is consistent with an earlier study (Heiskanen et al., 1998). The pharmacokinetic parameters of oxycodone in EM were also concordant with previous studies conducted in human healthy volunteers (Kaiko et al., 1996; Mandema et al., 1996; Heiskanen et al., 1998; Lalovic et al., 2006). Notable differences were however, demonstrated in some of the pharmacokinetic parameters of the metabolites as compared with a previous report (Lalovic et al., 2006). Some factors may account for these differences. CYP2D6 genotyping/phenotyping was not performed in the previous report (Lalovic et al., 2006) and we clearly demonstrate here that the pharmacokinetics of oxycodone metabolites varies with CYP2D6 phenotype. Also, our volunteers did not receive a fixed dose of oxycodone (15 mg) but a weight adjusted dose (0.2 mg·kg−1). Finally, the administration of naloxone 90 min after oxycodone possibly modified the shape of pharmacokinetic curves with a possible entero-hepatic recirculation.
Effects of inhibition of CYP2D6 and CYP3A4 metabolic pathways
We demonstrated that CYP2D6 blockade by quinidine had a considerable effect on the pharmacokinetic parameters of oxymorphone and noroxymorphone, reduced overall by 40% and 80% respectively. As plasma levels were however, still detectable, blockade by oral quinidine (100 mg) 2 h before oxycodone was not complete (Table 1). Other authors have used 200 mg of quinidine 3 h before 20 mg CR oxycodone and 100 mg after 6 h (Heiskanen et al., 1998). With this regimen no oxymorphone was detected at any time point in 8/10 subjects, and the two remaining subjects had levels between 0.2 and 0.24 ng·mL−1. Other enzymatic pathways may also be involved in the formation of oxymorphone as described above in the case of our genotypic PM.
We assessed the effect of CYP3A inhibition by ketoconazole on the pharmacokinetic parameters of oxycodone and metabolites. After 400 mg of ketoconazole, noroxycodone and noroxymorphone exposures dramatically decreased by 80%. Again, we demonstrated that the blockade of one pathway led to a compensatory increase of the remaining pathway. Indeed, after quinidine, noroxycodone exposure rose by 70%, and after ketoconazole, oxymorphone exposure was 3.5-fold higher than after oxycodone alone. Furthermore both quinidine and ketoconazole increased the exposure to oxycodone (1.4- to 1.8-fold). The combination of ketoconazole and quinidine had a cumulative effect on the pharmacokinetics of oxycodone (threefold higher AUC∞ and 70% reduced CL/F). It was previously demonstrated that quinidine led to a compensatory 1.9-fold increase of noroxycodone AUC24 and 1.5-fold increase of noroxycodone Cmax, as well as a non-significant 1.15-fold increase of oxycodone AUC24 (Heiskanen et al., 1998).
Pharmacodynamic consequences of the pharmacokinetic effects of CYP2D6 and CYP3A modulation of oxycodone and its metabolites
The O-demethylated metabolites of oxycodone (oxymorphone and noroxymorphone) have higher potencies and affinities for the µ opioid receptor (MOR) than do oxycodone and noroxycodone. Indeed the structure of oxycodone and oxymorphone bear the same chemical relation as codeine and its O-demethylated active metabolite, morphine (Chen et al., 1991; Poyhia et al., 1993). As a result of CYP2D6 O-demethylation, the hydroxyl group at the 3 position confers an increased analgesic potency to morphine and oxymorphone compared with their respective 3-methoxy congeners codeine and oxycodone (Cleary et al., 1994). Oxymorphone has indeed a 40- and threefold higher affinity for the MOR than oxycodone and morphine, respectively, whereas noroxymorphone affinity for MOR is three- and 10-fold higher than oxycodone and noroxycodone respectively. Oxymorphone is moreover 14 times more potent than oxycodone (Chen et al., 1991). It is also now recognized that codeine and tramadol O-demethylated metabolites are responsible for their analgesic action (Dayer et al., 1988) The same variability would be expected with other opioids dependent on CYP pathways for their activation (Samer et al., 2006). Several pieces of indirect evidence support a role for pharmacologically active metabolites in the anti-nociceptive effect of oxycodone in both rats (Lemberg et al., 2006) and humans (Backlund et al., 1997) and a few case reports have pointed out the importance of CYP2D6 phenotype in the pharmacology of oxycodone as a result of drug interactions or genetic polymorphisms. We have shown here that CYP2D6 activity modulated by genetic polymorphism or drug–drug interactions was highly correlated with oxymorphone and noroxymorphone AUC and Cmax and a shunt to CYP2D6 pathway was observed after CYP3A4 inhibition. We have evidence (unpublished experiments; Samer et al., 2010) that these pharmacokinetic data translate into pharmacodynamic effects of oxycodone (anti-nociceptive effect, psychomotor effect, pupil size, toxicity), where oxymorphone appears indeed to be the active metabolite responsible for the pharmacodynamic effects of oxycodone.
Micro-cocktail for CYP3A4 and CYP2D6 phenotyping and CYP2D6 genotyping
Our study demonstrated that low oral doses of midazolam (75 µg) and dextromethorphan (2.5 mg) can be used as a micro-cocktail to simultaneously assess CYP3A and CYP2D6 activities. The volunteers were both genotyped (AmpliChip) and phenotyped for CYP2D6 before the start of the study. Excellent concordance between phenotypes determined with microdoses of dextromethorphan and genotype-based predictions were obtained. Full correlations between CYP2D6 phenotypes with conventional and microdoses of dextromethorphan were also observed. Microdoses of dextromethorphan are therefore an accurate and safer alternative to assess CYP2D6 phenotypes, especially in CYP2D6 PM subjects. No differences in CYP2D6 and CYP3A phenotypes were demonstrated between oxycodone and placebo sessions, confirming that oxycodone has no influence on CYP2D6 and CYP3A activities. Two UM carried gene duplications. The well-described CYP2D6*2xN duplication is associated with the phenotype of an UM and our volunteer had a dextromethorphan/dextrorphan ratio <0.003. Another volunteer (#2) carried a CYP2D6*41xN (multi-) duplication. The predicted phenotype for a *41/*41xN individual carrying a real gene duplication (n= 2) is IM for CYP2D6 and was correlated with an IM measured phenotype in a previous report (Rebsamen et al., 2009). However, the microarray-based technology cannot discriminate between real duplication and potential multi-duplication of CYP2D6*41 (n > 2 copies). Gaedigk et al. (2007) have questioned whether the lack of discrimination or positive identification of CYP2D6*17xN, *29xN and *41xN had any effect on accurate phenotype prediction, expecting that duplicated genes of reduced function with a total gene count superior or equal to 3 confer a phenotype at the fast end of the activity distribution. In our study this volunteer was phenotyped as an UM during three sessions with dextromethorphan/dextrorphan ratio <0.003 and his oxycodone pharmacokinetics were similar to the other genotyped UM, suggesting that he may carry more than three copies of the *41 allele. A similar discrepancy between measured and predicted phenotype was reported in a previous study where a *1/*41xN genotype resulted in an UM measured phenotype (Rebsamen et al., 2009).
Microdoses of midazolam were used as previously described (Eap et al., 2004). In our study, 1-OH-midazolam/midazolam ratios were overall lower than those observed by Eap et al. After oxycodone, mean 1-OH-midazolam/midazolam ratio was 2.947 (SD 1.771, interval 0.17–5.81) with no difference between oxycodone and placebo. Therefore oxycodone does not modify CYP3A phenotype. One volunteer had low 1-OH-midazolam/midazolam ratios during all the study sessions suggesting he could carry a CYP3A deficient allele. CYP3A blockade by a single oral dose of 400 mg ketoconazole was effective in all volunteers as demonstrated by the low 1-OH-midazolam/midazolam ratio (mean 0.79, SD 0.39) similar to the effect of ketoconazole 400 mg·day−1 for 2 days used in the study of Eap et al. (2004) (mean 0.112, SD 0.054).
In conclusion, the complex pharmacology of oxycodone has been incompletely understood and studied. We assessed the effect of both CYP2D6 genetic polymorphism and CYP2D6 and CYP3A drug–drug interactions on the pharmacokinetics of oxycodone. We demonstrated that drug–drug interactions via CYP2D6 and CYP3A had an important effect on the pharmacokinetics of oxycodone that differed significantly depending on CYP2D6 genotype. The results of our exploratory randomized controlled study have to be confirmed in a larger sized prospective study.
Acknowledgments
We are grateful to Mr A. Chiappe for his participation in CYP2D6 genotyping and to Dr K. Byth for her advice in the statistical analyses.
Glossary
Abbreviations:
- AUC
area under the concentration curve
- CL/F
oral clearance
- Cmax
maximum concentration
- CV
coefficient of variation
- CYP
cytochrome P450
- EM
extensive metabolizer
- MOR
µ opioid receptor
- MR
metabolic ratio
- PM
poor metabolizer
- T1/2z
terminal elimination half-life
- Tmax
time to Cmax
- UM
ultrarapid metabolizers
- Vz/F
volume of distribution
Conflicts of interest
None.
References
- Alexander SPH, Mathie A, Peters JA. Guide to Receptors and Channels (GRAC), 4th edn. Br J Pharmacol. 2009;158(Suppl. 1):S1–S254. doi: 10.1111/j.1476-5381.2009.00499.x. [DOI] [PMC free article] [PubMed] [Google Scholar]
- Backlund M, Lindgren L, Kajimoto Y, Rosenberg PH. Comparison of epidural morphine and oxycodone for pain after abdominal surgery. J Clin Anesth. 1997;9:30–35. doi: 10.1016/S0952-8180(96)00212-7. [DOI] [PubMed] [Google Scholar]
- Caraco Y, Sheller J, Wood AJ. Pharmacogenetic determination of the effects of codeine and prediction of drug interactions. J Pharmacol Exp Ther. 1996;278:1165–1174. [PubMed] [Google Scholar]
- Chen ZR, Irvine RJ, Somogyi AA, Bochner F. Mu receptor binding of some commonly used opioids and their metabolites. Life Sci. 1991;48:2165–2171. doi: 10.1016/0024-3205(91)90150-a. [DOI] [PubMed] [Google Scholar]
- Cleary J, Mikus G, Somogyi A, Bochner F. The influence of pharmacogenetics on opioid analgesia: studies with codeine and oxycodone in the Sprague-Dawley/Dark Agouti rat model. J Pharmacol Exp Ther. 1994;271:1528–1534. [PubMed] [Google Scholar]
- Cone EJ, Darwin WD, Buchwald WF, Gorodetzky CW. Oxymorphone metabolism and urinary excretion in human, rat, guinea pig, rabbit, and dog. Drug Metab Dispos. 1983;11:446–450. [PubMed] [Google Scholar]
- Daali Y, Cherkaoui S, Doffey-Lazeyras F, Dayer P, Desmeules JA. Development and validation of a chemical hydrolysis method for dextromethorphan and dextrophan determination in urine samples: application to the assessment of CYP2D6 activity in fibromyalgia patients. J Chromatogr B Analyt Technol Biomed Life Sci. 2008;861:56–63. doi: 10.1016/j.jchromb.2007.11.019. [DOI] [PubMed] [Google Scholar]
- Dayer P, Desmeules J, Leemann T, Striberni R. Bioactivation of the narcotic drug codeine in human liver is mediated by the polymorphic monooxygenase catalyzing debrisoquine 4-hydroxylation (cytochrome P-450 dbl/bufI) Biochemical Biophysical Res Comms. 1988;152:411–416. doi: 10.1016/s0006-291x(88)80729-0. [DOI] [PubMed] [Google Scholar]
- Eap CB, Buclin T, Cucchia G, Zullino D, Hustert E, Bleiber G, et al. Oral administration of a low dose of midazolam (75 microg) as an in vivo probe for CYP3A activity. Eur J Clin Pharmacol. 2004;60:237–246. doi: 10.1007/s00228-004-0762-z. [DOI] [PubMed] [Google Scholar]
- Falk E. Eukodal ein neues Narkoticum. Muenchener Medizinische Wochenschrift. 1917;20:381–384. [Google Scholar]
- Gaedigk A, Ndjountche L, Divakaran K, Dianne Bradford L, Zineh I, Oberlander TF, et al. Cytochrome P4502D6 (CYP2D6) gene locus heterogeneity: characterization of gene duplication events. Clin Pharmacol Ther. 2007;81:242–251. doi: 10.1038/sj.clpt.6100033. [DOI] [PubMed] [Google Scholar]
- Gasche Y, Daali Y, Fathi M, Chiappe A, Cottini S, Dayer P, et al. Codeine intoxication associated with ultrarapid CYP2D6 metabolism. N Engl J Med. 2004;351:2827–2831. doi: 10.1056/NEJMoa041888. [DOI] [PubMed] [Google Scholar]
- Hagelberg NM, Nieminen TH, Saari TI, Neuvonen M, Neuvonen PJ, Laine K, et al. Voriconazole drastically increases exposure to oral oxycodone. Eur J Clin Pharmacol. 2009;65:263–271. doi: 10.1007/s00228-008-0568-5. [DOI] [PubMed] [Google Scholar]
- Heiskanen T, Olkkola KT, Kalso E. Effects of blocking CYP2D6 on the pharmacokinetics and pharmacodynamics of oxycodone. Clin Pharmacol Ther. 1998;64:603–611. doi: 10.1016/S0009-9236(98)90051-0. [DOI] [PubMed] [Google Scholar]
- Kaiko RF, Benziger DP, Fitzmartin RD, Burke BE, Reder RF, Goldenheim PD. Pharmacokinetic-pharmacodynamic relationships of controlled-release oxycodone. Clin Pharmacol Ther. 1996;59:52–61. doi: 10.1016/S0009-9236(96)90024-7. [DOI] [PubMed] [Google Scholar]
- Lalovic B, Kharasch E, Hoffer C, Risler L, Liu-Chen LY, Shen DD. Pharmacokinetics and pharmacodynamics of oral oxycodone in healthy human subjects: role of circulating active metabolites. Clin Pharmacol Ther. 2006;79:461–479. doi: 10.1016/j.clpt.2006.01.009. [DOI] [PubMed] [Google Scholar]
- Lalovic B, Phillips B, Risler LL, Howald W, Shen DD. Quantitative contribution of CYP2D6 and CYP3A to oxycodone metabolism in human liver and intestinal microsomes. Drug Metab Dispos. 2004;32:447–454. doi: 10.1124/dmd.32.4.447. [DOI] [PubMed] [Google Scholar]
- Lee HK, Lewis LD, Tsongalis GJ, Mcmullin M, Schur BC, Wong SH, et al. Negative urine opioid screening caused by rifampin-mediated induction of oxycodone hepatic metabolism. Clin Chim Acta. 2006;367:196–200. doi: 10.1016/j.cca.2005.11.030. [DOI] [PubMed] [Google Scholar]
- Lemberg K, Kontinen VK, Viljakka K, Kylanlahti I, Yli-Kauhaluoma J, Kalso E. Morphine, oxycodone, methadone and its enantiomers in different models of nociception in the rat. Anesth Analg. 2006;102:1768–1774. doi: 10.1213/01.ane.0000205751.88422.41. [DOI] [PubMed] [Google Scholar]
- Mandema JW, Kaiko RF, Oshlack B, Reder RF, Stanski DR. Characterization and validation of a pharmacokinetic model for controlled-release oxycodone. Br J Clin Pharmacol. 1996;42:747–756. doi: 10.1046/j.1365-2125.1996.00481.x. [DOI] [PMC free article] [PubMed] [Google Scholar]
- Nieminen TH, Hagelberg NM, Saari TI, Pertovaara A, Neuvonen M, Laine K, et al. Rifampin greatly reduces the plasma concentrations of intravenous and oral oxycodone. Anesthesiology. 2009;110:1371–1378. doi: 10.1097/ALN.0b013e31819faa54. [DOI] [PubMed] [Google Scholar]
- Poyhia R, Vainio A, Kalso E. A review of oxycodone's clinical pharmacokinetics and pharmacodynamics. J Pain Symptom Manage. 1993;8:63–67. doi: 10.1016/0885-3924(93)90101-z. [DOI] [PubMed] [Google Scholar]
- Rebsamen MC, Desmeules J, Daali Y, Chiappe A, Diemand A, Rey C, et al. The AmpliChip CYP450 test: cytochrome P450 2D6 genotype assessment and phenotype prediction. Pharmacogenomics J. 2009;9:34–41. doi: 10.1038/tpj.2008.7. [DOI] [PubMed] [Google Scholar]
- Samer CF, Desmeules JA, Dayer P. Individualizing analgesic prescription part I: pharmacogenetics of opioid analgesics. Personalized Medicine. 2006;3:239–269. doi: 10.2217/17410541.3.3.239. [DOI] [PubMed] [Google Scholar]
- Samer CF, Piguet V, Dayer P, Desmeules JA. Genetic polymorphism and drug interactions: their importance in the treatment of pain. Can J Anesth. 2005;52:806–821. doi: 10.1007/BF03021775. [DOI] [PubMed] [Google Scholar]
- Samer CF, Daali Y, Wagner M, Hopfgartner G, Eap CB, Rebsamen MC, et al. Genetic polymorphism and drug interactions modulating CYP2D6 and CYP3A activities have a major impact on oxycodone analgesic efficacy and safety. Br J Pharmacol. 2010;160:919–930. doi: 10.1111/j.1476-5381.2010.00709.x. [DOI] [PMC free article] [PubMed] [Google Scholar]
- Tyndale RF, Droll KP, Sellers EM. Genetically deficient CYP2D6 metabolism provides protection against oral opiate dependence. Pharmacogenetics. 1997;7:375–379. doi: 10.1097/00008571-199710000-00006. [DOI] [PubMed] [Google Scholar]