Abstract
Background
The increasing incidence of hepatocellular carcinoma in Western countries has led to an expanding interest of scientific research in this field. Therefore, a vast need of experimental models that mimic the natural pathogenesis of hepatocellular carcinoma (HCC) in a short time period is present. The goal of our study was (1) to develop an efficient mouse model for HCC research, in which tumours develop in a natural background of fibrosis and (2) to assess the time-dependent angiogenic changes in the pathogenesis of HCC.
Methods
Weekly intraperitoneal injections with the hepatocarcinogenic compound N-nitrosodiethylamine was applied as induction method and samples were taken at several time points to assess the angiogenic changes during the progression of HCC.
Results
The N-nitrosodiethylamine-induced mouse model provides well vascularised orthotopic tumours after 25 weeks. It is a representative model for human HCC and can serve as an excellent platform for the development of new therapeutic targets.
Introduction
An efficient and representative mouse model is the cornerstone of a successful experiment. The growing incidence of hepatocellular carcinoma (HCC) in Western countries has resulted in an expanding interest of scientific research in this field. Therefore, a vast need of experimental models that mimic the natural pathogenesis of HCC in a short time period is present.
Several genetically modified mouse models (GMM) develop HCC in relatively short time periods. They often represent only one or a few specific mutation(s), while natural tumours are a dynamic environment consisting of a heterogenic cell population with different genotypes, which change over time as a response to variable external conditions [1-3]. Xenograft models are relevant for fast drug screening and proof-of-principle experiments [4], but face similar limitations as the GMMs, since only one cell phenotype is assessed, while tumours exist of a large variety of phenotypes. Results should always be interpreted with care, because introducing foreign cells in an animal system, as done in a xenograft mouse model, creates an altered physiological interaction between tumour and environment [5], leading to spectacular results that can seldom be confirmed in cancer patients [6].
A compound often used for the chemical induction of HCC is N-nitrosodiethylamine (DEN). DEN is metabolised by cytochrome P450 enzymes, which are abundantly present in the liver, leading to the formation of the reactive ethyl diazonium ion [7]. The latter holds the potential to alkylate DNA structures, causing alterations in the expression levels of tumour promoting and/or suppressing genes [8]. Single injections of DEN, sometimes in combination with phenobarbital treatment, are frequently used for the induction of HCC in mice and rats and have been validated as a genetically representative model for human HCC [9]. However, it does not induce fibrosis.
The goal of our study was (1) to develop an efficient mouse model for hepatocellular carcinoma (HCC) research, in which HCC develops in a natural background of fibrosis and (2) to assess the time-dependent angiogenic changes in the pathogenesis of HCC [10,11] since anti-angiogenic molecules are currently a hot topic in research concerning therapies for non-resectable HCC [12-14].
Materials and methods
Animals
4-week-old male mice (129S2/SvPasCrl) were purchased from Charles River laboratories (Brussels, Belgium). They were kept under constant temperature and humidity in a 12 h controlled dark/light cycle. Mice were fed ad libitum on a standard pellet diet. The Ethical Committee of experimental animals at the Faculty of Medicine and Health Sciences, Ghent University, Belgium, approved the protocols.
HCC induction
5-week-old male mice (n = 45) received intraperitoneal injections once per week with DEN (35 mg/kg bodyweight) diluted in saline using a 0,5 mL syringe with a 29G needle. If mice suffered from weight loss ≥15% compared to the previous week, an injection was omitted. The control group was injected with an equal volume of saline and injections were randomly passed over in a comparable quantity as in the DEN-group.
Tissue sampling & histology
After 4, 16, 20, 25 and 30 weeks, 8 animals per group were sacrificed under isoflurane (Forene®) anaesthesia while blood was obtained from the carotic artery. After macroscopic evaluation, all organs were sampled in 4% phosphate buffered formaldehyde (Klinipath, ref: 4078.9020) and embedded in paraffin. HCC-lesions and non-HCC-tissue were separately collected and snap frozen in liquid nitrogen. Haematoxilin-eosin staining (H&E) was performed to evaluate the morphological changes inflicted by the DEN-treatment. Sirius Red staining was carried out to score the fibrotic stage of the liver. Reticulin staining was performed to help identifying HCC-nodules. All stainings were done using standard histology protocols and evaluated by an experienced pathologist.
Immunohistochemistry
Immunohistochemical stainings (IHC) were used to quantify protein expression levels inside HCC-nodules, tissue surrounding HCC-nodules and non-HCC tissue. As a marker for angiogenesis specific monoclonal antibodies were used against vascular endothelial growth factor (VEGF) (Santa Cruz biotechnology, ref sc-152), CD105 (R&D systems, ref AF1320) and Tie2 (BD Bioscience, ref 557039). Tumour hypoxia was evaluated by staining for hypoxia inducible factor 1 alpha (HIF1α) (Santa Cruz ref sc-53546) and macrophages were visualised using F4/80-staining (AbD serotec, ref MCA497G). A negative marker for HCC, Fatty Acid Binding Protein (FABP, Hycult biotechnology, ref HP8010) was used [15]. Stainings were performed as previously described [15-17] and were semi-quantitatively measured by Olympus CellD software. Intercapillary distance (ICD) was used as a marker for microvessel density, by measuring the average distance between vessels in HCC-nodules on CD105-stained slides.
Medical imaging
Additional in vivo tests were performed using microPET imaging as non-invasive technology. The latter acquisitions were performed using a GE FLEX Triumph micro-PET/SPECT/CT scanner (Gamma Medica-Ideas). This state-of-the-art scanner consists of a micro-PET module (LabPET8) with 2'2'10 mm3 LYSO/LGSO scintillators in an 8-pixel, quad-APD detector module arrangement. This system is capable of delivering 1 mm spatial resolution in rodents at a sensitivity of 4%, thereby covering a field-of-view of 10 cm transaxially by 8 cm axially, while the CT part can scan structures down to 10-15 μm. The micro-CT part consists of a high-resolution micro-CT tube with a focal spot size switchable between 10 or 50 μm, combined with a flat-panel CsI detector.
Animals were injected with 18,5 mBq of [18F]- fluoromethylcholine ([18F]FMCH) (Laboratory of Radiopharmacy, Ghent, Belgium) [18,19] immediately prior to their microPET scan on the camera bed at the start of a dynamic acquisition. Frames of 15×20 sec and 5×5 min were accordingly sequentially recorded. For anatomical localisation, a microCT-scan was sequentially acquired using 256 projections over 360 degrees at 70 kVp/180 μA and 1,3 magnification with a spot size of 50 μm. This results in a scanning time below 2 minutes, whilst keeping the radiation dose at 20 - 25 mGy. This radiation dose is sufficiently low enough to allow for follow-up studies. The resulting PET data were reconstructed using 30 iterations of the Maximum Likelihood Expectation Maximisation algorithm in 160×160×63 images of 0,5 × 0,5 × 1,175 mm voxel size and no posteriori 3D filtering was applied. CT-reconstruction was straightforward analytical. All images were fused and analysed with VIVID (Amira ®, San diego, USA).
Vascular corrosion casts (VCC) were obtained by perfusing Batson n°17 (Polysciences ref: 07349) through the aorta (arterial casts) or vena ileocolica (venous cast); and dissolving soft tissue in KOH. The VCC were then scanned in the micro-CT scanner, after which the reconstructed dataset was segmented before generating 3D surface models. In order to assess the VCC with scanning electron microscopy (SEM), the relevant parts were cut off and coated with platinum.
Protein expression
Alterations in protein expression levels of angiogenic factors in HCC-tissue were measured by ELISA [20]. Placental growth factor (PlGF) (Mouse PlGF-2 Quantikine ELISA Kit, R&D Biosystems) and VEGF (Mouse VEGF Quantikine ELISA Kit, R&D Systems) were measured in liver tissue and in serum. Protein levels of soluble VEGF receptor 1 (sVEGFR1) (Mouse sVEGF R1/Flt-1 Quantikine ELISA Kit R&D Biosystems) were measured in serum. To normalise the total protein concentration in the samples, a normalisation factor was determined by a Biorad RC/DC Protein Assay kit.
Statistics
Data were statistically analysed with SPSS 16. Datasets were tested for normality using the Kolmogorov-Smirnov test before further analysis. Parametric data were subjected to a student's t-test to evaluate the difference between the DEN and control group. Data that did not show a normal distribution were tested with the non-parametric Mann-Whitney-U test. A p value of < 0.05 was considered statistically significant. Correlations were calculated using the Pearson correlation test.
Results
Macroscopic evaluation
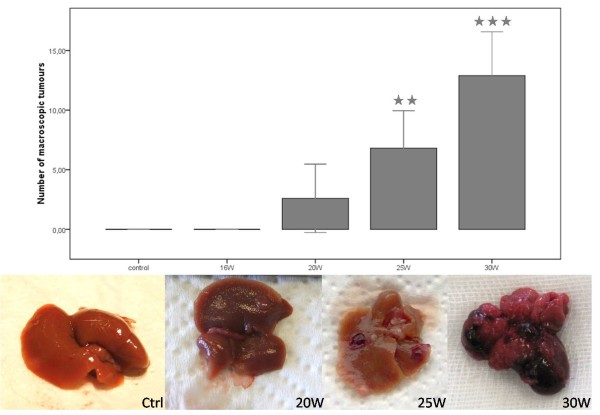
Significant lower weight (p < 0,001) was observed between adult DEN-mice (25,26 g (± 0,49)) and control mice (31,28 g (± 0,91)) at 25W. Macroscopic evaluation of the liver revealed tumours at 20W (2,6 (± 2,66) tumours/liver), 25W (6,81 (± 1,69) tumours/liver) and 30W (12,9 (± 2,17) tumours/liver) (figure 1).
Figure 1.
Macroscopic HCC-lesions at different time points throughout the experiment. Asterisks (*) represent the significant P-values of the control group compared to DEN-groups (** = p < 0,01 and *** = p < 0,001).
Microscopic evaluation
HCC progression
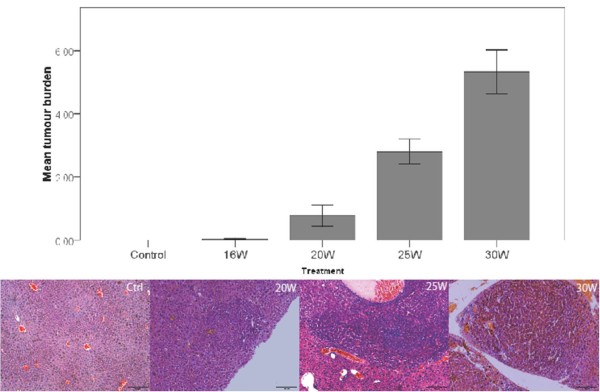
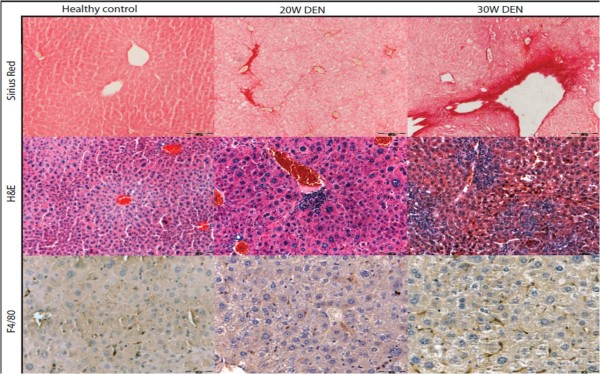
H&E staining showed dysplastic changes at 20W, 25W and 30W. Small cell dysplasia was frequently found throughout the liver and readily distinguishable nodules of neoplasia were seen at 25W and 30W (figure 2). These nodules were confirmed as HCC using reticulin staining and HE (and immunohistochemistry for FABP). HCC nodules were identified and measured on reticulin and H&E stained histological slides. Tumour burden (size × number) increased significantly during DEN-treatment (figure 2). Sirius red staining demonstrated the fibrotic action of DEN, with time-dependent increase of Metavir-score (figure 3), while controls did not show any fibrotic septa.
Figure 2.
Mean HCC burden (size × number tumours) at different time points and representative pictures of H&E stained HCC-nodules.
Figure 3.
Representative pictures of fibrosis in non-tumorous tissue on sirius red staining (top), inflammatory foci on H&E staining (middle) and macrophages on F4/80 immunohistochemistry (bottom).
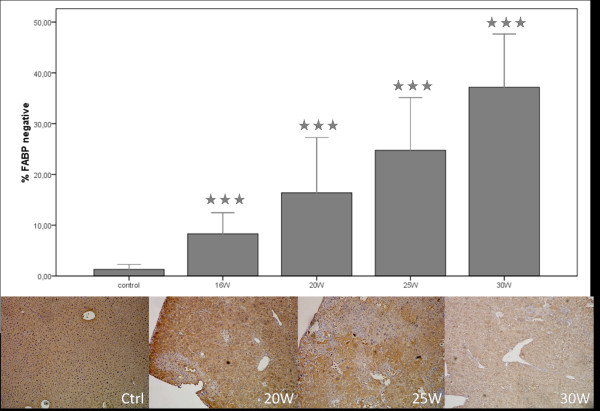
A time-dependent increase in FABP-negative spots was seen throughout the experiment (figure 4). While parts of the liver were FABP-negative, some hepatocytes had an increased FABP-expression in the DEN-treated groups whereas control livers showed a homogenous expression (figure 4). FABP (p < 0,001) was significantly down regulated in all the DEN-treated groups compared to the control group (figure 4).
Figure 4.
Percentage of FABP-negative sites and representative pictures of the IHC staining. Asterisks (*) represent the significant p-value of the control group compared to DEN-groups (*** = p < 0,001).
Inflammation and fibrosis
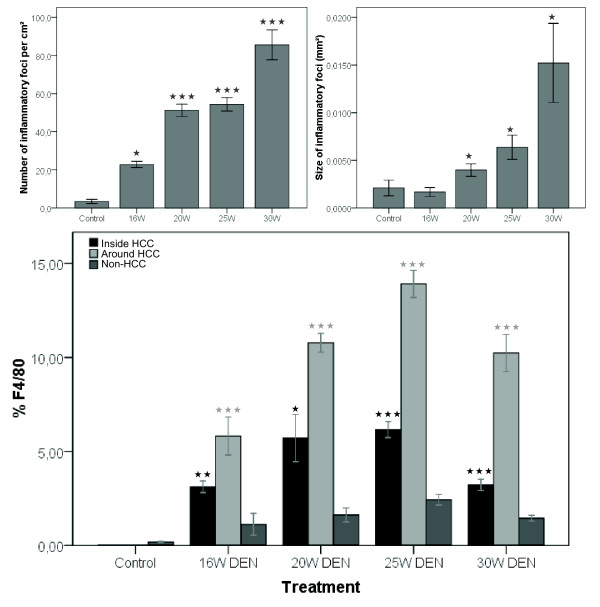
The number and size of inflammatory foci significantly increases after 20W (p < 0,001 and p < 0,05), 25W (p < 0,001 and p < 0,05) and 30W DEN (p < 0,001 and p < 0,05) compared to control livers (figure 3 and 5). This was accompanied by an increased abundance of Kuppfer cells in and around HCC, as well as in non-HCC tissue (figure 3). Compared to non-HCC tissue, the expression of F4/80 was significantly up-regulated after 16W (p < 0,01), 20W (p < 0,05), 25W (p < 0,001) and 30W (p < 0,001) in HCC, and in the surrounding matrix of HCC-lesions (p < 0,001) (figure 5).
Figure 5.
Top: mean number (left) and size (right) of inflammatory foci at different time points; Bottom: expression of F4/80 on immunohistochemistry. Asterisks (*) represent the significant P-value of the difference between expression inside and around HCC-nodules compared to non-tumour tissue in DEN-treated livers (* = p < 0,05, ** = p < 0,01, *** = p < 0,001).
Angiogenesis
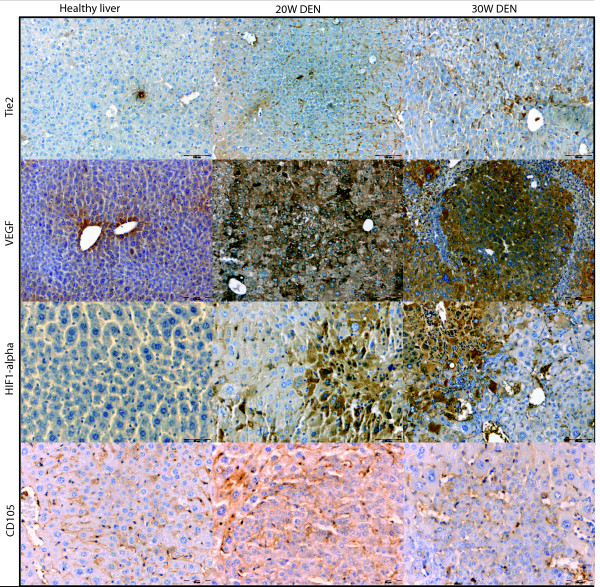
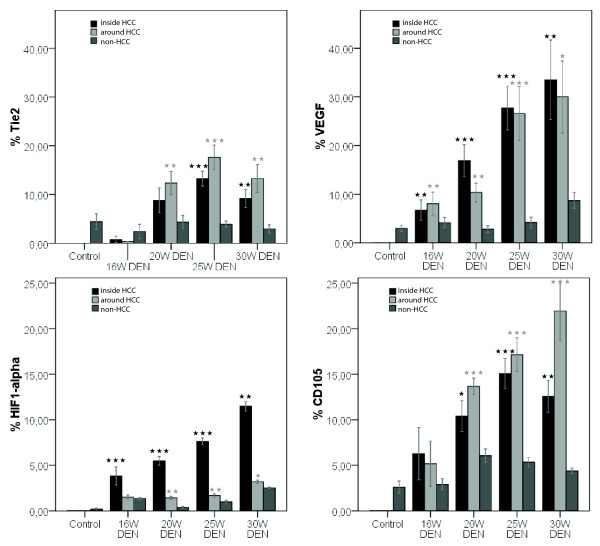
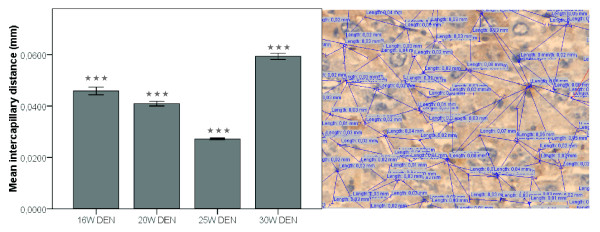
VEGF expression was more promintent inside HCC-nodules (figure 6 and 7) than in the surrounding matrix, yet both were significantly increased (p < 0,01) after 20W, 25W and 30W DEN compared to adjacant non-HCC tissue. VEGF-levels were significantly increased inside HCC-nodules compared to controls after 25W (p < 0,05) and 30W DEN (p < 0,05) (table 1). The expression of VEGF was correlated (r = 0,68, p < 0,001) with HIF1-α levels. HIF1α levels were significantly up-regulated in and around tumour tissue at 20W (p < 0,001), 25W (in: p < 0,001; around: p < 0,05) and 30W DEN (p < 0,001) compared to adjacant non-HCC tissue (figure 6 and 7). Non-HCC tissue was hypoxic after 16W (p < 0,01), 25W (p < 0,01) and 30W (p < 0,001) of DEN compared to healthy controls (table 1). The increased HIF1α expression was more prominent inside HCC nodules than in surrounding matrix (figure 6), the latter being characterised by a major increase in vascularisation after 20W, 25W and 30W of DEN compared to non-tumour tissue (p < 0,001). CD105 was also increased inside HCC-lesions after 20W (p < 0,05), 25W (p < 0,001) and 30W (p < 0,01) (figure 6 and 7), implicating an increased intratumoral neovascularisation, confirmed by ICD (figure 8). The ICD decreased at 20W and 25W, verifing neovascularisation; an increase was seen at 30W (figure 8). Differences of ICD were statistically significant between all groups (p < 0,001). DEN-induced HCC-lesions showed an increased expression of Tie2 which was higher in HCC-surrounding tissue than inside HCC-nodules (figure 6). Tie2 was significantly up-regulated around HCC after 20W (p < 0,01), 25W (p < 0,001) and 30W (p < 0,01) compared to non-HCC tissue, and inside HCC after 25W (p < 0,001) and 30W DEN (p < 0,01 (figure 7, table 1). Tie2 expression was correlated (r = 0,58, p < 0,001) with macrophage recruitment (F4/80-staining).
Figure 6.
Representative pictures of immunohistochemical stainings for Tie2, VEGF, HIF1α and CD105 in healthy liver, 20W DEN (tumour tissue) and 30W DEN (tumour tissue).
Figure 7.
Top: Tie2 epxression (left) and VEGF expression (right); Bottom: HIF1-α (left) and CD105 (right). Asterisks (*) represent the significant P-value of the difference between expression inside and around HCC-nodules compared to non-tumour tissue in DEN-treated livers (* = p < 0,05, ** = p < 0,01, *** = p < 0,001).
Table 1.
Average protein expression in DEN-treated liver determined with immunohistochemistry by measuring DAB-positive staining
| Inside tumour | ||||||||||||
|---|---|---|---|---|---|---|---|---|---|---|---|---|
| 16W | 20W | 25W | 30W | |||||||||
| Av (%) | SEM | p | Av (%) | SEM | p | Av (%) | SEM | p | Av (%) | SEM | p | |
| TIE2 | 0,75 | 0,68 | NS | 8,81 | 2,52 | NS | 13,24 | 1,53 | < 0,01 | 9,17 | 1,84 | NS |
| VEGF | 6,74 | 2,09 | < 0,05 | 16,91 | 3,28 | < 0,001 | 27,72 | 3,42 | < 0,001 | 33,50 | 8,16 | < 0,01 |
| HIF1-a | 3,79 | 0,57 | < 0,001 | 5,49 | 0,48 | < 0,001 | 7,63 | 0,37 | < 0,001 | 11,47 | 0,50 | < 0,001 |
| CD105 | 6,29 | 2,88 | NS | 10,40 | 1,70 | < 0,001 | 15,08 | 1,44 | < 0,001 | 12,57 | 1,75 | < 0,001 |
| F4/80 | 3,12 | 0,30 | < 0,001 | 5,70 | 1,25 | < 0,001 | 6,16 | 0,46 | < 0,001 | 3,21 | 0,30 | < 0,001 |
| Surrounding tumour | ||||||||||||
| 16W | 20W | 25W | 30W | |||||||||
| Av (%) | SEM | p | Av (%) | SEM | p | Av (%) | SEM | p | Av (%) | SEM | p | |
| TIE2 | 0,36 | 0,68 | NS | 12,35 | 2,37 | < 0,05 | 17,63 | 2,52 | < 0,01 | 13,30 | 2,89 | < 0,05 |
| VEGF | 8,06 | 2,09 | < 0,01 | 10,35 | 1,92 | < 0,001 | 26,56 | 4,23 | < 0,001 | 30,01 | 7,39 | < 0,001 |
| HIF1-a | 1,51 | 0,70 | < 0,01 | 1,43 | 0,17 | < 0,001 | 1,67 | 0,19 | < 0,001 | 3,20 | 0,17 | < 0,001 |
| CD105 | 5,17 | 2,49 | NS | 13,68 | 0,88 | < 0,001 | 17,14 | 1,77 | < 0,001 | 21,94 | 3,24 | < 0,001 |
| F4/80 | 5,82 | 0,37 | < 0,001 | 10,78 | 0,50 | < 0,001 | 13,92 | 0,72 | < 0,001 | 10,24 | 0,98 | < 0,001 |
| Non-tumour | ||||||||||||
| 16W | 20W | 25W | 30W | |||||||||
| Av (%) | SEM | p | Av (%) | SEM | p | Av (%) | SEM | p | Av (%) | SEM | p | |
| TIE2 | 4,77 | 1,75 | NS | 4,33 | 1,36 | NS | 3,90 | 0,62 | NS | 2,95 | 0,83 | NS |
| VEGF | 4,50 | 0,88 | NS | 2,80 | 0,73 | NS | 4,19 | 0,85 | NS | 8,72 | 1,60 | < 0,01 |
| HIF1-a | 1,04 | 0,16 | < 0,01 | 0,38 | 0,12 | NS | 0,98 | 0,19 | < 0,01 | 2,53 | 0,08 | < 0,001 |
| CD105 | 3,74 | 0,68 | NS | 6,06 | 0,74 | < 0,05 | 5,36 | 0,48 | < 0,001 | 4,40 | 0,31 | < 0,05 |
| F4/80 | 0,87 | 0,27 | NS | 1,62 | 0,37 | < 0,05 | 2,43 | 0,28 | < 0,01 | 1,44 | 0,16 | < 0,01 |
P-values were calculated for the difference with healthy liver protein levels.
Figure 8.
Left: mean intercapillary distances at different time points,*** = p < 0,001, right: measurement of ICD.
Medical imaging
Preliminary results, illustrated by Figure 9 suggest that these tumours could be visualised by [18F]FMCH PET imaging; and that this technique is useful for follow up studies. A short follow study (25W - 35W) was conducted on mice. An increased uptake was seen at the sequential measurements, which correlates with their increased tumour burden. However, further confirmation in larger groups is needed.
Figure 9.
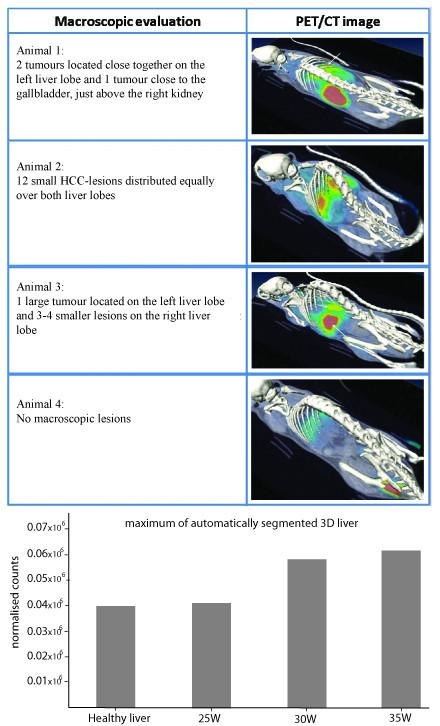
Top: PET-images of mice at 30 weeks, static reconstruction of a 30 min acquisition; Bottom: normalised counts of F[18]MCH uptake during a follow-up study.
The combination of VCC and CT-scanning revealed the chaotic pattern and dishierarchical organisation of tumour vessels (figure 10). The SEM-images provide further insight in the microvasculature (figure 10), showing the tumour vessel abnormality and visualising two mechanisms of neovascularisation, pruning and intussusceptive angiogenesis (figure 11).
Figure 10.
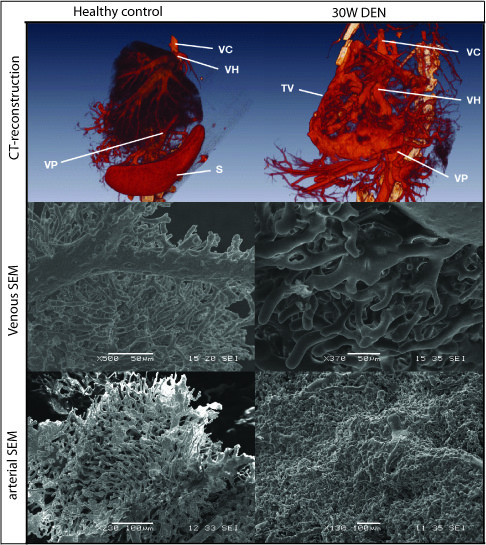
Top: 3D reconstructions of vascular corrosion castings, Middle: SEM-images of venous vascular corrosion castings; Bottom: SEM-images of arterial vascular corrosion castings.
Figure 11.
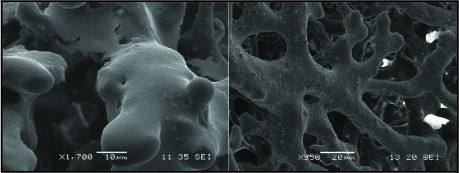
Left: sprouting angiogenesis; Right: intussusceptive angiogenesis.
Protein expression
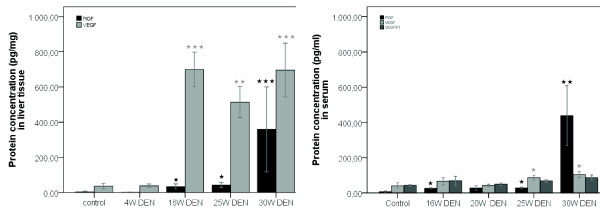
PlGF and VEGF are important factors involved in tumour angiogenesis and were significantly up-regulated in liver tissue at 16W (respectively p < 0,05 and p < 0,001), 20W (p < 0,05 and p < 0,01) and tumour tissue samples at 25W DEN (p < 0,05 and p < 0,01). The up-regulation of PlGF was more prominent in tumour tissue at 30W with an average of 422,28 pg/mg (± 76,99) PlGF compared to the 2,90 pg/mg (± 0,77) PlGF detected in the control group (p < 0,001) (figure 12).
Figure 12.
Left: protein concentrations in liver tissue, determined by ELISA; Right: protein concentrations in serum, determined by ELISA. Asterisks (*) represent the significant P-value of the difference between DEN-treated groups and controls. (* = p < 0,05, ** = p < 0,01, *** = p < 0,001).
In serum, the PlGF protein levels were significantly up-regulated at 16W (p < 0,05), 25W (p < 0,05) and 30W (p < 0,01) with similar results as seen in liver tissue (figure 12). VEGF levels were up-regulated at 25W (p < 0,05) and 30W (p < 0,05). There was a slight increase of sVEGFR1 at 30W DEN treatment, but no significant difference was seen between controls and 25W DEN (figure 12).
Discussion
Animal models can provide essential knowledge about the pathogenesis of hepatocellular carcinoma, particularly when they mimic the tissue environment in which human tumours develop. N-nitrosodiethylamine has been shown to induce tumours which are molecularly similar to human HCC with poor prognosis [9]. Yet, the major drawback is the long time needed for tumour progression, it can take over one year for tumours to develop [21-26]. The macroscopic and microscopic evaluation of tumours, PET-CT images and histopathological analysis confirmed the presence of HCC after 25 weeks. While most DEN-induced models take at least 1 year to develop tumours, weekly intraperitoneal injections with 35 mg/kg DEN give rise to relatively fast tumour occurrence in a background of fibrosis. Since HCC is known to be a hypervascularised tumour, and recent therapies have focused on inhibiting angiogenesis, we have studied the time-dependent changes in angiogenic and inflammatory factors in this mouse model.
Previous studies with several DEN-induced rat and mice models, have shown that the expression level of FABP is decreased in DEN-induced liver lesions [15,27]. These L-FABP-negative foci are correlated with a higher growth potential. Consequently, the FABP-expression was measured as a parameter for HCC-development. Even after a relatively short period of DEN administration (16W) significant decrease in FABP-expression is seen compared to controls. After 25W DEN large FABP-negative lesions appear throughout the liver, alternating with small FAPB-positive regions, while control tissue showed a homogenous expression.
DEN-injections also gave rise to increased inflammation, confirmed by H&E staining, as well as F4/80 which is a marker for Kuppfer cells. Activation of Kupffer cells leads to the release of cytokines, reactive oxygen species, and platelet activating factors, which are involved in the angiogenic switch. Furthermore, the chronic inflammation causes hepatocyte damage, leading to fibrosis as seen on the sirius red staining. In our study we show that Tie2 is up-regulated in the fibrotic matrix surrounding the HCC-lesions, which was also characterised by increased macrophage infiltration, confirming Tie2's correlation with hepatic inflammation. In addition, Tie2 is a receptor for angiopoetins, which play an important role in angiogenesis. Furthermore, the presence of fibrosis creates an increased intrahepatic vascular resistance and impairs oxygen diffusion, resulting in hypoxia which is the onset for the angiogenic switch. This is supported by our findings HIF1α and VEGF levels were increased in the fibrotic non-HCC tissue after DEN-treatment. The increased expression of HIF1α inside tumour nodules, confirms the vast oxygen need of the malignant hepatocytes. To fulfil that requirement, tumour cells start expressing angiogenic factors, such as VEGF and PlGF, inducing the angiogenic switch.
Up till now, VEGF was one of the key targets in angiogenesis research, but recently PlGF gained interest because its association with pathological conditions. PlGF levels are known to be elevated in a variety of cancers [28-33] and is associated with poor prognosis in HCC [34]. The up-regulation of PlGF in this DEN-model supports the theory that PlGF plays an essential role in the angiogenesis of HCC. Protein levels of sVEGFR1, an important inhibitor for VEGF and PlGF, did not significantly alter, suggesting that the increase of angiogenic factors was physiologically relevant. Thus, the increase of angiogenic factors (VEGF, PlGF and Tie2), resulted in an increased neovascularisation. The IHC results of the CD105-staining revealed a low CD105 expression in the normal endothelial cells of the liver and was up-regulated in the malignant liver lesions at 20W, consistent with previous studies [17]. The intercapillary distances significantely decreased after 25W DEN, verifying neovascularisation; although an increase was seen at 30W supporting the theory that malignant hepatocytes tend to outgrow their vascular supply and become accostumed to hypoxia. This up-regulation of CD105 was more prominent around HCC-lesions, suggesting that the newly formed vessels form a circumferential mantle around the tumours. This was confirmed by the CT-reconstructions of the vascular casts. SEM-images demonstrate the presence of neo-angiogenesis, by visualising budding and intussusceptive angiogenesis. Furthermore, the images illustrate the overall microvascular abnormality of DEN-treated livers. Thus, the combination of casting and micro-CT imaging provides unique data on the hepatic circulation and neovascularisation. It allows to digitally visualise the complex architecture of the liver blood vessels and to provide high resolution data for qualitative morphological analysis.
During this study we have established a new mouse model for HCC, which is considerably faster than current chemically induced models and has the advantage of tumour progression occurring in a background of inflammation and fibrosis. Furthermore, angiogenic factors were assessed at different time points, to provide important information about the kinetic changes of angiogenic factors during HCC progression. Moreover, several innovative imaging techniques were applied, not only to assess tumour growth, but also to provide further insight in microvascular alterations HCC livers.
Competing interests
The authors declare that they have no competing interests.
Authors' contributions
FH has done the DEN-injections, sacrifications, histology, ELISAs, immunohistochemistry, statistical analysis and the writing of the manuscript. KM was responsible for planning the PET-scans and evaluation of images, he also contributed to the medical imaging results in the draft. CC was responsible for producing the vascular corrosion casts and B.V. made 3D CT-reconstructions. NC & PS did preliminary research on the DEN-model and FABP-staining, both contributed to the discussion. CVS was responsible for the practical training of FH and assisted during sacrifications, furthermore he provided ready-to-use protocols for immunohistochemistry. DS is responsible for the production of radiolabelled choline. LL evaluated the histopathology of the slides at different time points and contributed to the histology-part of the manuscript. SS is responsible for the small animal imaging facility, he has coordinated the scans and did the PET-CT-constructions, he added the technical information concerning the scans to the material and method section. IC and HVV helped with the study design and are "the scientific mentors" of the first author. All authors have read and approved the final manuscript.
Contributor Information
Femke Heindryckx, Email: Femke.heindryckx@Ugent.be.
Koen Mertens, Email: kemerten.mertens@ugent.be.
Nicolas Charette, Email: nicolas.charette@gmail.com.
Bert Vandeghinste, Email: Bert.Vandeghinste@UGent.be.
Christophe Casteleyn, Email: Christophe.Casteleyn@UGent.be.
Christophe Van Steenkiste, Email: Christophe.Vansteenkiste@ugent.be.
Dominique Slaets, Email: Dominique.slaets@UGent.be.
Louis Libbrecht, Email: Louisj.libbrecht@UGent.be.
Steven Staelens, Email: Steven.Staelens@UGent.be.
Peter Starkel, Email: Peter.Starkel@uclouvain.be.
Anja Geerts, Email: Anja.geerts@UGent.be.
Isabelle Colle, Email: Isabelle.colle@ugent.be.
Hans Van Vlierberghe, Email: Hans.Vanvlierberghe@Ugent.be.
Acknowledgements
The authors would like to thank Julien Dupont for his excellent technical assistance during the experiments, technician Philippe Joye for his assistance during the PET-scans and the Laboratory of Radiopharmacy for providing the radiolabelled choline. In addition, the authors thank Gudrun Cornelis and Lara Crapé for their help with IHC. Femke Heindryckx, Christophe Van Steenkiste and Steven Staelens are sponsored by a grant of the Research Foundation Flanders (Fonds Wetenschappelijk Onderzoek - Vlaanderen). Nicolas Charette is sponsored by a grant from "Fondation St. Luc". Bert Vandeghinste is sponsored by a grant of the Institute for the Promotion of Innovation through Science and Technology in Flanders (IWT - Vlaanderen).
References
- Egeblad M, Ewald AJ, Askautrud HA, Truitt ML, Welm BE, Bainbridge E, Peeters G, Krummel MF, Werb Z. Visualizing stromal cell dynamics in different tumor microenvironments by spinning disk confocal microscopy. Dis Model Mech. 2008;1:155–167. doi: 10.1242/dmm.000596. discussion 165. [DOI] [PMC free article] [PubMed] [Google Scholar]
- Bissell MJ, Radisky D. Putting tumours in context. Nature Reviews Cancer. 2001;1:46–54. doi: 10.1038/35094059. [DOI] [PMC free article] [PubMed] [Google Scholar]
- Gopinathan A, Tuveson DA. The use of GEM models for experimental cancer therapeutics. Dis Model Mech. 2008;1:83–86. doi: 10.1242/dmm.000570. [DOI] [PMC free article] [PubMed] [Google Scholar]
- Richmond A, Su Y. Mouse xenograft models vs GEM models for human cancer therapeutics. Dis Model Mech. 2008;1:78–82. doi: 10.1242/dmm.000976. [DOI] [PMC free article] [PubMed] [Google Scholar]
- Talmadge JE, Singh RK, Fidler IJ, Raz A. Murine models to evaluate novel and conventional therapeutic strategies for cancer. Am J Pathol. 2007;170:793–804. doi: 10.2353/ajpath.2007.060929. [DOI] [PMC free article] [PubMed] [Google Scholar]
- Kerbel RS. Human tumor xenografts as predictive preclinical models for anticancer drug activity in humans: better than commonly perceived-but they can be improved. Cancer Biol Ther. 2003;2:S134–139. [PubMed] [Google Scholar]
- Swenberg JA, Hoel DG, Magee PN. Mechanistic and statistical insight into the large carcinogenesis bioassays on N-nitrosodiethylamine and N-nitrosodimethylamine. Cancer Res. 1991;51:6409–6414. [PubMed] [Google Scholar]
- Everhart JE, Ruhl CE. Burden of digestive diseases in the United States Part III: Liver, biliary tract, and pancreas. Gastroenterology. 2009;136:1134–1144. doi: 10.1053/j.gastro.2009.02.038. [DOI] [PubMed] [Google Scholar]
- Lee JS, Chu IS, Mikaelyan A, Calvisi DF, Heo J, Reddy JK, Thorgeirsson SS. Application of comparative functional genomics to identify best-fit mouse models to study human cancer. Nat Genet. 2004;36:1306–1311. doi: 10.1038/ng1481. [DOI] [PubMed] [Google Scholar]
- Amarapurkar AD, Vibhav, Kim V. Angiogenesis in liver cirrhosis and hepatocellular carcinoma. Indian J Pathol Microbiol. 2008;51:323–328. doi: 10.4103/0377-4929.42504. [DOI] [PubMed] [Google Scholar]
- Pang RW, Joh JW, Johnson PJ, Monden M, Pawlik TM, Poon RT. Biology of hepatocellular carcinoma. Annals of Surgical Oncology. 2008;15:962–971. doi: 10.1245/s10434-007-9730-z. [DOI] [PubMed] [Google Scholar]
- Finn RS, Zhu AX. Targeting angiogenesis in hepatocellular carcinoma: focus on VEGF and bevacizumab. Expert Rev Anticancer Ther. 2009;9:503–509. doi: 10.1586/era.09.6. [DOI] [PubMed] [Google Scholar]
- Pang R, Poon RT. Angiogenesis and antiangiogenic therapy in hepatocellular carcinoma. Cancer Lett. 2006;242:151–167. doi: 10.1016/j.canlet.2006.01.008. [DOI] [PubMed] [Google Scholar]
- Ribatti D, Vacca A, Nico B, Sansonno D, Dammacco F. Angiogenesis and anti-angiogenesis in hepatocellular carcinoma. Cancer Treat Rev. 2006;32:437–444. doi: 10.1016/j.ctrv.2006.06.002. [DOI] [PubMed] [Google Scholar]
- Thullberg M, Grasl-Kraupp B, Hogberg J, Garberg P. Changes in liver fatty acid-binding protein in rat enzyme-altered foci. Cancer Lett. 1998;128:1–10. doi: 10.1016/S0304-3835(98)00040-8. [DOI] [PubMed] [Google Scholar]
- Vanheule E, Geerts AM, Van Huysse J, Schelfhout D, Praet M, Van Vlierberghe H, De Vos M, Colle I. An intravital microscopic study of the hepatic microcirculation in cirrhotic mice models: relationship between fibrosis and angiogenesis. Int J Exp Pathol. 2008;89:419–432. doi: 10.1111/j.1365-2613.2008.00608.x. [DOI] [PMC free article] [PubMed] [Google Scholar]
- Geerts AM, De Vriese AS, Vanheule E, Van Vlierberghe H, Mortier S, Cheung KJ, Demetter P, Lameire N, De Vos M, Colle I. Increased angiogenesis and permeability in the mesenteric microvasculature of rats with cirrhosis and portal hypertension: an in vivo study. Liver Int. 2006;26:889–898. doi: 10.1111/j.1478-3231.2006.01308.x. [DOI] [PubMed] [Google Scholar]
- Beheshti M, Vali R, Waldenberger P, Fitz F, Nader M, Hammer J, Loidl W, Pirich C, Fogelman I, Langsteger W. The Use of F-18 Choline PET in the Assessment of Bone Metastases in Prostate Cancer: Correlation with Morphological Changes on CT. Mol Imaging Biol. 2009;6:446–454. doi: 10.1007/s11307-009-0217-0. [DOI] [PubMed] [Google Scholar]
- DeGrado TR, Baldwin SW, Wang S, Orr MD, Liao RP, Friedman HS, Reiman R, Price DT, Coleman RE. Synthesis and evaluation of (18)F-labeled choline analogs as oncologic PET tracers. J Nucl Med. 2001;42:1805–1814. [PubMed] [Google Scholar]
- Soininen H, Kosunen O, Helisalmi S, Mannermaa A, Paljarvi L, Talasniemi S, Ryynanen M, Riekkinen P Sr. A severe loss of choline acetyltransferase in the frontal cortex of Alzheimer patients carrying apolipoprotein epsilon 4 allele. Neurosci Lett. 1995;187:79–82. doi: 10.1016/0304-3940(95)11343-6. [DOI] [PubMed] [Google Scholar]
- Chen B, Liu L, Castonguay A, Maronpot RR, Anderson MW, You M. Dose-Dependent Ras Mutation Spectra in N-Nitrosodiethylamine Induced Mouse-Liver Tumors and 4-(Methylnitrosamino)-1-(3-Pyridyl)-1-Butanone Induced Mouse Lung-Tumors. Carcinogenesis. 1993;14:1603–1608. doi: 10.1093/carcin/14.8.1603. [DOI] [PubMed] [Google Scholar]
- Teoh NC, Dan YY, Swisshelm K, Lehman S, Wright JH, Haque J, Gu Y, Fausto N. Defective DNA strand break repair causes chromosomal instability and accelerates liver carcinogenesis in mice. Hepatology. 2008;47:2078–2088. doi: 10.1002/hep.22194. [DOI] [PubMed] [Google Scholar]
- Frey S, Buchmann A, Bursch W, Schulte-Hermann R, Schwarz M. Suppression of apoptosis in C3H mouse liver tumors by activated Ha-ras oncogene. Carcinogenesis. 2000;21:161–166. doi: 10.1093/carcin/21.2.161. [DOI] [PubMed] [Google Scholar]
- Zimmers TA, Jin XL, Gutierrez JC, Acosta C, McKillop IH, Pierce RH, Koniaris LG. Effect of in vivo loss of GDF-15 on hepatocellular carcinogenesis. Journal of Cancer Research and Clinical Oncology. 2008;134:753–759. doi: 10.1007/s00432-007-0336-4. [DOI] [PubMed] [Google Scholar]
- Shiota G, Harada K, Ishida M, Tomie Y, Okubo M, Katayama S, Ito H, Kawasaki H. Inhibition of hepatocellular carcinoma by glycyrrhizin in diethylnitrosamine-treated mice. Carcinogenesis. 1999;20:59–63. doi: 10.1093/carcin/20.1.59. [DOI] [PubMed] [Google Scholar]
- Hacker HJ, Mtiro H, Bannasch P, Vesselinovitch SD. Histochemical Profile of Mouse Hepatocellular Adenomas and Carcinomas Induced by a Single Dose of Diethylnitrosamine. Cancer Research. 1991;51:1952–1958. [PubMed] [Google Scholar]
- Finnberg N, Stenius U, Hogberg J. Heterozygous p53-deficient (+/-) mice develop fewer p53-negative preneoplastic focal liver lesions in response to treatment with diethylnitrosamine than do wild-type (+/+) mice. Cancer Lett. 2004;207:149–155. doi: 10.1016/j.canlet.2003.11.013. [DOI] [PubMed] [Google Scholar]
- Matsumoto K, Suzuki K, Koike H, Okamura K, Tsuchiya K, Uchida T, Takezawa Y, Kobayashi M, Yamanaka H. Prognostic significance of plasma placental growth factor levels in renal cell cancer: an association with clinical characteristics and vascular endothelial growth factor levels. Anticancer Res. 2003;23:4953–4958. [PubMed] [Google Scholar]
- Lacal PM, Failla CM, Pagani E, Odorisio T, Schietroma C, Falcinelli S, Zambruno G, D'Atri S. Human melanoma cells secrete and respond to placenta growth factor and vascular endothelial growth factor. Journal of Investigative Dermatology. 2000;115:1000–1007. doi: 10.1046/j.1523-1747.2000.00199.x. [DOI] [PubMed] [Google Scholar]
- Chen CN, Hsieh FJ, Cheng YM, Cheng WF, Su YN, Chang KJ, Lee PH. The significance of placenta growth factor in angiogenesis and clinical outcome of human gastric cancer. Cancer Lett. 2004;213:73–82. doi: 10.1016/j.canlet.2004.05.020. [DOI] [PubMed] [Google Scholar]
- Donnini S, Machein MR, Plate KH, Weich HA. Expression and localization of placenta growth factor and PlGF receptors in human meningiomas. J Pathol. 1999;189:66–71. doi: 10.1002/(SICI)1096-9896(199909)189:1<66::AID-PATH390>3.0.CO;2-X. [DOI] [PubMed] [Google Scholar]
- Zhang L, Chen J, Ke Y, Mansel RE, Jiang WG. Expression of Placenta growth factor (PlGF) in non-small cell lung cancer (NSCLC) and the clinical and prognostic significance. World J Surg Oncol. 2005;3:68. doi: 10.1186/1477-7819-3-68. [DOI] [PMC free article] [PubMed] [Google Scholar]
- Carmeliet P, Moons L, Luttun A, Vincenti V, Compernolle V, De Mol M, Wu Y, Bono F, Devy L, Beck H, Scholz D, Acker T, DiPalma T, Dewerchin M, Noel A, Stalmans I, Barra A, Blacher S, Vandendriessche T, Ponten A, Eriksson U, Plate KH, Foidart JM, Schaper W, Charnock-Jones DS, Hicklin DJ, Herbert JM, Collen D, Persico MG. Synergism between vascular endothelial growth factor and placental growth factor contributes to angiogenesis and plasma extravasation in pathological conditions. Nat Med. 2001;7:575–583. doi: 10.1038/87904. [DOI] [PubMed] [Google Scholar]
- Ho MC, Chen CN, Lee H, Hsieh FJ, Shun CT, Chang CL, Lai YT, Lee PH. Placenta growth factor not vascular endothelial growth factor A or C can predict the early recurrence after radical resection of hepatocellular carcinoma. Cancer Lett. 2007;250:237–249. doi: 10.1016/j.canlet.2006.10.005. [DOI] [PubMed] [Google Scholar]


