

Abstract
Stearoyl-CoA desaturase 1 (SCD1) deficiency protects mice from diet-induced obesity and insulin resistance. To understand the tissue-specific role of SCD1 in energy homeostasis, we have generated mice with an adipose-specific knockout of Scd1 (AKO), and report here that SCD1 deficiency increases GLUT1 expression in adipose tissue of AKO mice, but not global SCD1 knockout (GKO) mice. In 3T3-L1 adipocytes treated with a SCD inhibitor, basal glucose uptake and the cellular expression of GLUT1 were significantly increased while GLUT4 expression remained unchanged. Consistently, adipose-specific SCD1 knockout (AKO) mice had significantly elevated GLUT1 expression, but not GLUT4, in white adipose tissue compared to Lox counterparts. Concurrently, adiponectin expression was significantly diminished, whereas TNF-α expression was elevated. In contrast, in adipose tissue of GKO mice, GLUT4 and adiponectin expression were significantly elevated with lowered TNF-α expression and little change in GLUT1 expression, suggesting a differential responsiveness of adipose tissue to global- or adipose-specific SCD1 deletion. Taken together, these results indicate that adipose-specific deletion of SCD1 induces GLUT1 up-regulation in adipose tissue, associated with decreased adiponectin and increased TNF-α production, and suggest that GLUT1 may play a critical role in controlling glucose homeostasis of adipose tissue in adipose-specific SCD1-deficient conditions.
Keywords: stearoyl-coenzyme A desaturase, adipose tissue, GLUT1, GLUT4, adiponectin
Introduction
Stearoyl-CoA desaturase-1 (SCD1) has recently been described as one of the major enzymes in the control of lipid metabolism [1]. Mice with a global deletion of SCD1 (GKO mice) are resistant to high-fat diet-induced weight gain and have enhanced lipid oxidation and insulin sensitivity in various tissues including liver, muscle and adipose tissue [1,2]. Liver-specific Scd1-deficient (LKO) mice, however, were not protected from high-fat diet-induced obesity and insulin resistance [3]. Instead, LKO mice fed a high-carbohydrate diet were protected from adiposity and hepatic steatosis. Nevertheless, no significant differences were observed between high-carbohydrate diet-fed LKO and Lox control mice in plasma glucose and insulin levels, glucose tolerance, and insulin sensitivity. From these observations of phenotypes caused by liver-specific deletion of SCD1, the need to elucidate the tissue-specific contributions of other tissues to the metabolic changes in several tissues elicited by whole-body SCD1 deletion has been emphasized [1].
GLUT1 is a facilitated glucose transporter responsible for basal glucose uptake and acts cooperatively with GLUT4 in insulin-sensitive tissues, adipose and muscle [4]. Although GLUT1 plays a minor role in glucose transport in these tissues, it has been shown that altered expression of GLUT1 in specific tissues results in a profound physiological impact on glucose homeostasis. Adiponectin, a key regulator of insulin sensitivity and fatty acid oxidation, is produced mainly by the adipose tissue and circulates in the blood at relatively high concentration andalso antagonizes many effects of tumor necrosis factor-α (TNF-α) [5]. The direct association of expression of glucose transporters with adiponectin expression has not been established yet.
Effects of SCD1 deficiency on glucose homeostasis have been the subject of many studies over the past two decades. However, few studies have examined the change in the expression of glucose transporters in tissues that are responsible for energy metabolism. In the present study, we focused on adipose tissue to examine the effects of adipose-specific deletion of SCD1 on glucose transport and homeostasis. We observed that adipose-specific SCD1 deficiency up-regulated GLUT1 expression, with little change in GLUT4, in adipose tissue with lowered adiponectin expression and elevated TNF-α expression. These results were the reverse of phenotypes caused by whole-body SCD1 deletion. Our study represents the first example of elucidation of the mechanism controlling glucose transport and systemic energy metabolism in adipose-specific SCD1 knockout mice and identifies the up-regulation of GLUT1 expression in adipose tissue as a potential mechanism.
Materials and methods
Cell culture and treatment of SCD inhibitor
3T3-L1 fibroblasts were grown and differentiated as previously described [6]. Adipocytes were used 8-10 days after induction of differentiation. Cells were treated or not with SCD inhibitor at specific concentrations (0.5~2 μM) for 20 h. SCD1 inhibitor 4-(2-chlorophenoxy)-N-(3-(methylcarbamoyl)-phenyl)piperidine-1-carboxamide (A939572) was purchased from Biofine International (Blain, WA).
2-Deoxyglucose uptake assay
3T3-L1 adipocytes were exposed to SCD inhibitor in complete DMEM containing 10% FBS for 20 h. Cell monolayers were washed in Krebs-Ringer phosphate buffer (KRP) at pH 7.4 and incubated for 10 min at 37 °C. Glucose transport was assayed as previously described [7]. Briefly, insulin (100 nM) was added or not for 10 min, and then [3H]2-deoxyglucose (0.2 mM, 0.2 μCi) was added for an additional 10 min. Glucose uptake was terminated with 3 washes with ice-cold PBS. Cells were dissolved in 0.1% sodium dodecyl sulfate (SDS) and counted for radioactivity.
Preparation of plasma membranes
Subcellular membrane fractionation was performed to isolate plasma membranes as described by Fisher and Frost [8]. Briefly, 3T3-L1 cells were washed in ice-cold PBS, collected, and lysed. The homogenate was then centrifuged and the pellet was resuspended and homogenized again, then purified plasma membranes were collected from this by sucrose gradient centrifugation. Proteins were then separated by SDS-PAGE for immunoblotting of GLUT1 and GLUT4.
Western blot analysis
For the immunoblotting of Akt, phospho-Akt, GLUT1, and GLUT4, cell lysates or plasma membranes described above were separated by 10% SDS-PAGE for immunoblot analysis [9].
Lipid analyses
3T3-L1 cells were washed three times with ice-cold PBS and the total cellular lipids were extracted with chloroform/methanol (2:1 v/v) containing 0.1 mg/ml butylated hydroxytoluene (BHT) by the Folch method [10]. Fatty acids in the lipids were methylated and analyzed by gas chromatography as described previously [3], with penta- and heptadecanoic acids added as internal standards.
Generation of adipose-specific Scd1 knockout mice
Mice having the third exon of the Scd1 gene flanked by loxP sites (Scd1flox/flox) were generated as described previously [3]. To generate adipose-specific Scd1 knockout (AKO) mice, we crossed female Scd1flox/flox (Lox) mice to an aP2 promoter Cre recombinase-expressing strain on a C57BL/6 background (obtained from Dr. Barbara B. Kahn at Beth Israel Deaconess Medical Center and Harvard Medical School, Boston, MA) to obtain compound heterozygous (Scd1flox/+;Cre/+) mice. Male Scd1flox/+;Cre/+ mice were subsequently mated with female Scd1flox/flox (Lox) mice, generating Scd1flox/flox;Cre/+ mice (AKO). For litter expansion, male AKO mice were bred with female Lox mice. Genotyping was performed by PCR using genomic DNA isolated from a tail clip, as described previously [3]. Mice were maintained on a 12 hr light/dark cycle with free access to water and either a standard chow diet (Purina 5008) or high fat (HF) diet (RD12492, Research Diets, Inc., New Brunswick, NJ) and housed in specific pathogen-free barrier facility. Animals were fasted for 4 hr and sacrificed by an overdose of isoflurane anesthesia, and tissue from liver and adipose were rapidly removed, snap-frozen in liquid nitrogen, and stored at -80°C until processed for experiments. All in vivo experimental procedures were approved by the animal care research committee of the University of Wisconsin-Madison.
Real time quantitative PCR
Total RNA extraction, reverse transcription and quantitative PCR were performed as described previously [3]. Briefly, total RNA from adipose tissue, liver, or 3T3-L1 adipocytes were extracted with TRI reagents (Molecular Research, Cincinnati, OH). DNase-treated total RNA (0.4-1 μg) was reverse transcribed with MultiScribe (Applied Biosystems, Foster City, CA). cDNA was amplified with SYBR Green PCR Master Mix (Applied Biosystems, Foster City, CA) and gene-specific forward and reverse primers on an ABI 7500 Fast Real-Time PCR system (Applied Biosystems). Results are expressed as mean ± S.D. after normalizing to expression of β-actin gene using the ΔΔCt method. Primer sequences are available upon request.
Statistical analysis
Numerical data are presented as means ± S.D. Differences between groups were assessed by Student’s t-test. p values < 0.05 were considered as statistically significant.
Results
Effects of SCD inhibition on glucose transport in 3T3-L1 adipocytes
To examine the changes in glucose transport caused by SCD inhibition in adipocytes, we tested the effect of chronic exposure to a SCD inhibitor, A939572 [11], on glucose uptake in 3T3-L1 adipocytes. As shown in Fig. 1A, basal glucose uptake was significantly enhanced in SCD inhibitor-treated cells in dose-dependent manner, whereas insulin-stimulated glucose uptake was not. To verify the inhibition of SCD activities, we measured fatty acid composition of total lipids extracted from adipocytes. In SCD inhibitor-treated cells, palmitoleate (16:1n7) and oleate (18:1n9) content were significantly lower than in non-treated cells, indicating that SCD1 activity was substantially inhibited by the inhibitor (Fig. 1B). This proves that SCD inhibition leads to the elevation of basal glucose uptake, at least in part, through a reduction in monounsaturated fatty acid generation.
Fig. 1.
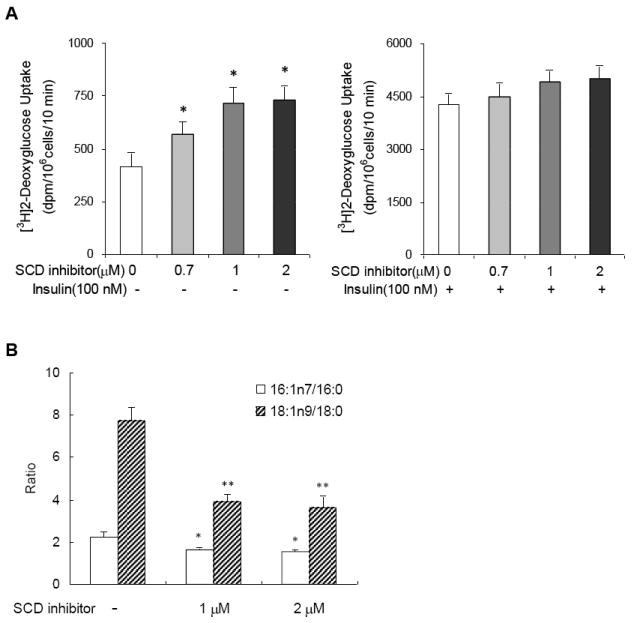
SCD inhibition leads to the elevation of basal glucose uptake in 3T3-L1 adipocytes. (A) 2-Deoxyglucose uptake in 3T3-L1 adipocytes after exposure to SCD inhibitor. Cells were exposed to specific concentration of SCD inhibitor as indicated for 20 h. 2-Deoxyglucose uptake was assessed without (left) and with (right) 10 min of insulin (100 nM) stimulation. Data represent means ± S.D. of 3 independent experiments. * p<0.05 compared to control cells. (B) Fatty acid composition of total lipids extracted from 3T3-L1 adipocytes after exposure to SCD inhibitor. * and ** p<0.05 compared to control cells in the ratio of palmitoleate/palmitate and oleate/stearate, respectively.
Exposure of SCD inhibitor-treated 3T3-L1 cells to wortmannin, a specific inhibitor of phosphatidylinositol 3’-kinase (PI 3-kinase), did not lead to substantial reduction of the enhanced basal glucose uptake (data not shown). This shows that the enhancing effect of SCD inhibition is not associated with activation of PI 3-kinase pathway. In addition, phosphorylated Akt/total Akt in SCD inhibitor-treated cells was not increased as compared with untreated cells (Fig 2A), indicating that the effect of SCD inhibition is not related to the insulin signaling/glucose transport system, which is downstream of Akt activation.
Fig. 2.
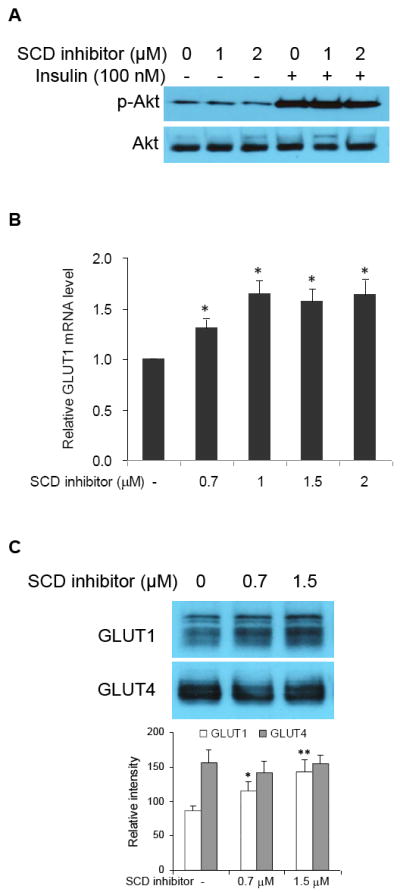
GLUT1 up-regulation, not GLUT4, is responsible for the enhancing effect of SCD inhibition on glucose uptake in 3T3-L1 adipocytes. (A) Effect of SCD inhibition on Akt phosphorylation. Cells were treated with SCD inhibitor for 20 h. Insulin (100 nM) was then added or not for 10 min and then extracted for SDS-PAGE-Western blot analysis. (B) Dose response of SCD inhibitor on GLUT1 expression (normalized to β-actin mRNA expression). Cells were exposed to specific concentrations of SCD inhibitor for 9 h. Total RNA were extracted with TRI reagents from the cells for reverse transcription and real time-PCR analysis. Data represent means ± S.D. of 3 independent experiments. * p<0.05 compared to control cells. (C) Effect of SCD inhibition on the expression of GLUT1 and GLUT4 proteins in the plasma membrane. Cells were treated with SCD inhibitor for 20 h. Plasma membrane fractions were collected for SDS-PAGE-Western blot analysis. Shown is a typical immunodetection among 3 independent experiments. * p<0.05 and ** p<0.01 compared to control cells.
To confirm that the augmentation of basal glucose uptake resulting from SCD inhibition was GLUT1-mediated, we examined the expression pattern of GLUT1 gene in cells incubated with or without (control) increasing doses of SCD inhibitor. As expected, the GLUT1 mRNA expression increased in response to exposure to SCD inhibitor dose-dependently (Fig. 2B). We also isolated the plasma membranes from the cells and analyzed the amount of GLUT1 and GLUT4 protein. Consistent with the increase in GLUT1 mRNA expression, GLUT1 protein level in the plasma membrane also revealed a dose-dependent increase (Fig. 2C). However, the GLUT4 level was not altered by treatment with SCD inhibitor. These results demonstrate that GLUT1 up-regulation, not GLUT4, is responsible for the enhancing effect of SCD inhibition on glucose uptake in 3T3-L1 adipocytes.
Effects of adipose-specific SCD1 deficiency on GLUT1 and GLUT4 expression in white adipose tissue
To understand the adipose-specific role of SCD1 in energy homeostasis, we used Cre-lox technology to generate adipose-specific SCD1 knockout (AKO) mice. Reverse transcription-PCR analysis and Western blot analysis revealed 90-95% reduction in Scd1 expression and SCD1 protein level in white (epididymal and subcutaneous) and brown adipose tissue, relative to Lox controls, without changes in liver, skeletal muscle, or other tissues of mice (unpublished results). The metabolic phenotype of AKO mice was also tested, which, in summary, showed that AKO mice were not protected from diet-induced adiposity and that glucose- and insulin tolerance tests found no difference between chow-fed AKO and Lox mice (unpublished results).
To extend the above 3T3-L1-cell-based results, we tested the impact of SCD1 deficiency on GLUT1 and GLUT4 expression in epididymal adipose tissues of AKO mice. We observed that the expression of GLUT1 mRNA was significantly higher in adipose tissues of both chow and high-fat (HF) diet-fed AKO mice as compared to the Lox controls (Fig. 3A). This was consistent with the results obtained from 3T3-L1 adipocytes. On the other hand, the adipose tissue of AKO mice on chow diet had reduced GLUT4 mRNA expression compared to Lox counterparts. Although Lox and AKO mice also had markedly reduced GLUT4 expression after 16 weeks of HF diet feeding, there was no significant difference between the two groups. Plasma membrane protein levels of GLUT1 and GLUT4 were consistent with the mRNA levels (Fig. 3B).
Fig. 3.
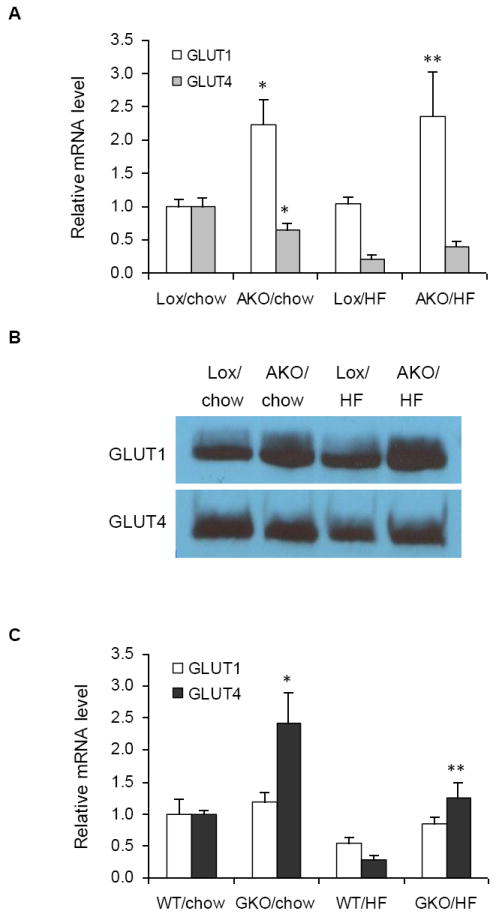
Effects of SCD1 deficiency on GLUT1 and GLUT4 expression in white adipose tissues of AKO and GKO mice. GLUT1 and GLUT4 mRNA expression were measured in adipose tissues of (A) Lox and AKO mice after 16 weeks of chow or HF diet feeding and (C) WT and GKO mice after 16 weeks of chow or HF diet feeding. Data represent the means ± S.D. of 4-6 animals in each group. * p<0.05 compared to Lox counterparts of AKO mice and WT counterparts of GKO mice on chow diet. ** p<0.05 compared to Lox counterparts of AKO mice and WT counterparts of GKO mice on HF diet. (C) GLUT1 and GLUT4 protein levels in the plasma membrane of white adipose tissue of AKO mice. Plasma membrane fractions were collected for SDS-PAGE-Western blot analysis. Shown is a typical immunodetection among 4 mice per genotype.
Effects of global SCD1 deficiency on GLUT1 and GLUT4 expression in white adipose tissue
In contrast to AKO mice, no significant difference was observed for GLUT1 expression between adipose tissues of wild type (WT) and global Scd1 knockout (GKO) mice (Fig. 3C). Interestingly, the level of GLUT4 mRNA was significantly higher in GKO mice on chow diet relative to wild type (WT) controls. Although HF diet caused a robust reduction in GLUT4 expression in both WT and GKO mice, GLUT4 mRNA level in GKO mice on HF diet was remarkably higher relative to WT counterparts, indicating that whole body deletion of SCD1 significantly prevented the HF-diet induced down-regulation of GLUT4 (Fig 3C).
Effects of SCD1 deficiency on GLUT1 expression in the livers of AKO and GKO mice
To examine whether elevation of GLUT1 expression also occurs in the liver of AKO mice, similarly to adipose tissue, we measured hepatic expression of GLUT1 gene. However, no significant differences in GLUT1 expression in the liver between chow-fed AKO mice and their Lox controls on both chow and HF diet were observed (data not shown). In addition, we observed no difference in GLUT1 expression between livers of GKO and WT mice on both chow and HF diet (data not shown).
Effects of SCD1 deficiency on expression of adiponectin and TNF-α in adipose tissues of AKO and GKO mice
Given that GLUT1 expression was higher in adipose tissues, but not affected in the liver, of AKO mice while GLUT4 expression remained unchanged, we found the need to determine if metabolic challenge in adipose tissue caused by SCD deficiency is associated with adipokine production from adipose tissue of AKO mice. We therefore measured the levels s of adiponectin and TNF-α expression.
Adiponectin mRNA expression and plasma adiponectin were significantly reduced in AKO mice (Fig. 4A and 4B) as compared to their Lox controls. Conversely, TNF-α expression was significantly higher in adipose tissues of chow-fed AKO mice relative to Lox controls (Fig. 4A). However, the Ct values for TNF-α (above 30) in adipose tissue were much greater than the values for adiponectin (data not shown) showing that, unlike adiponectin, the expression of TNF-α was almost below the levels of detection. Based on the results obtained from adipose tissues of AKO mice as described above, we tested the influence of SCD inhibition on adiponectin expression in 3T3-L1 adipocytes. As shown in Fig. 4C, SCD inhibitor treatment reduced adiponectin expression dose-dependently, but with little significance, which was consistent with the in vivo results in adipose tissues of AKO mice.
Fig. 4.
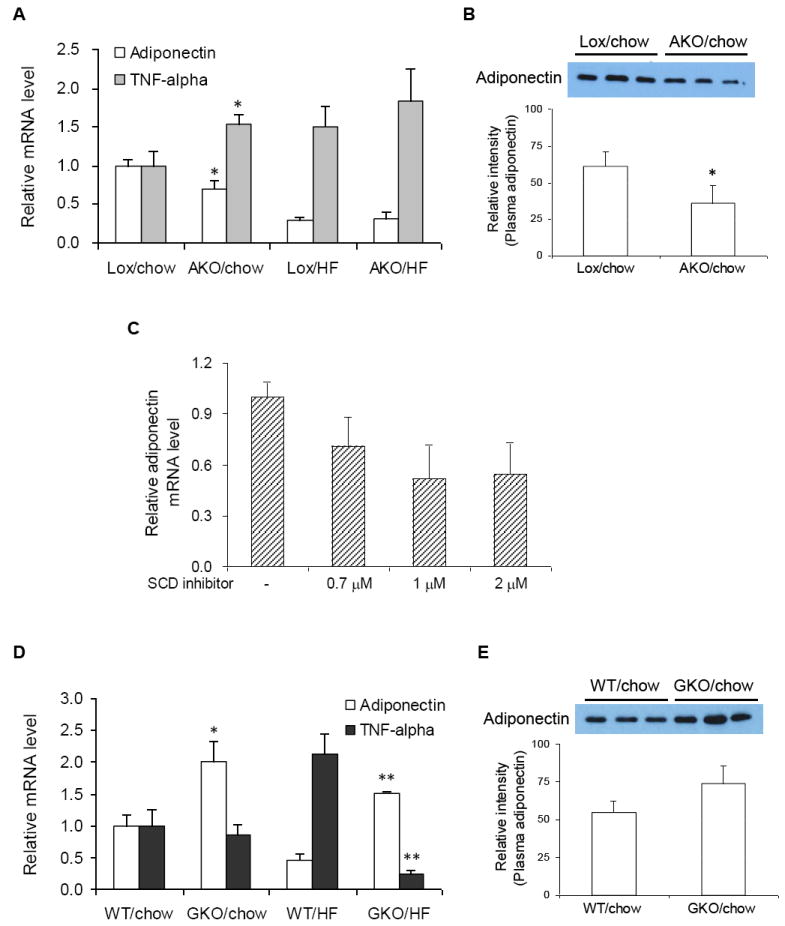
Effects of SCD1 deficiency on expression of adiponectin and TNF-α in adipose tissues of AKO and GKO mice. (A and D) Adiponectin and TNF-α mRNA expression were measured in adipose tissues of AKO, Lox, GKO, and WT mice after 16 weeks of chow or HF diet feeding. (B and E) Plasma samples of AKO, Lox, GKO, and WT mice after 16 weeks of chow diet feeding were diluted for SDS-PAGE-Western blot analysis. Data represent the means ± S.D. of 4-6 animals in each group. * p<0.05 compared to Lox counterparts of AKO mice on chow diet and WT counterparts of GKO mice on chow diet. ** p<0.05 compared to WT counterparts of GKO on HF diet. (C) Dose response of SCD inhibitor on adiponectin expression (normalized to β-actin mRNA expression) in 3T3-L1 adipocytes. Cells were exposed to specific concentration of SCD inhibitor for 9 h. Total RNA were extracted with TRI reagents from the cells for reverse transcription and real time-PCR analysis. Data represent means ± S.D. of 2 independent experiments.
In contrast to AKO mice, a positive correlation between SCD1 deficiency with adiponectin expression was revealed in GKO mice on chow diet (Fig. 4D). Consistent with this, the level of plasma adiponectin was also higher in GKO than WT control mice (Fig. 4E). In addition, on a HF diet, adiponectin expression was higher in GKO mice relative to WT mice. In the case of TNF-α expression, although no difference between chow-fed WT and GKO mice was observed, a highly elevated TNF-α expression caused by HF-diet feeding in WT mice was dramatically reduced in GKO mice.
Discussion
The relative contributions of individual tissues to the dramatically altered metabolic phenotypes elicited by whole-body SCD1 deficiency is still elusive and thus require a great deal of additional information. In the present study, we examined the effects of adipose-specific inhibition of SCD1 on glucose uptake and adipokine production in adipose tissue. Using 3T3-L1 adipocytes as a cellular model, we demonstrated that inhibition of SCD1 activity enhanced basal glucose uptake, which was mediated by GLUT1 up-regulation, but PI 3-kinase signaling and GLUT4-mediated glucose uptake were not affected. Consistent with cell-based results, GLUT1 expression levels in adipose tissues of AKO mice were significantly higher relative to Lox controls while GLUT4 expression remained unchanged. Although GLUT1 up-regulation correlating with increased basal glucose uptake has been shown to be associated with a decrease in insulin responsiveness [12], this is differing from the observations of the adipose tissue of AKO mice used in this study. Because glucose- and insulin tolerance tests on AKO mice and their Lox counterparts showed no significant difference (data not shown), it is clear that AKO mice are not in a state of insulin resistance. Unlike AKO mice, GKO mice had elevated expression of GLUT4, but little change in GLUT1 expression. These findings suggest that an increased glucose uptake of brown adipose tissue previously described in a model of global SCD1 deficiency [13] is, at least in part, due to an up-regulation of GLUT4 expression.
Adiponectin, an adipokine secreted mainly by the white adipose tissue, has been shown to stimulate fatty acid oxidation and enhance insulin sensitivity of peripheral tissues [14]. TNF-α, one of the pro-inflammatory adipokines, is also a key modulator in several insulin-mediated processes including glucose homeostasis and lipid metabolism [5]. Adiponectin has a significant inverse relationship with TNF-α and may share a common mechanism by which TNF-α promotes insulin resistance and inflammation [15]. Decreased adiponectin expression with simultaneous increase in the level of TNF-α expression in adipocytes has also been observed in atrophic adipose tissue due to an intake of trans-10, cis-12-conjugated linoleic acid [16], which has been reported to down-regulate SCD1 expression in 3T3-L1 adipocytes [17]. In the present study, we observed that the expression and secretion of adiponectin in AKO mice was significantly reduced compared to Lox mice while GKO mice had higher level of adiponectin relative to WT mice. In contrast, TNF-α expression level was found to be significantly higher in AKO mice than Lox mice. However, we also observed that the Ct values for TNF-α were far greater than those for adiponectin. This observation implies that, although there was a 1.5-fold increase in TNF-α in AKO mice when compared with Lox control (shown in Fig. 4A), the significance of the increase is minimal and should not be considered with equal significance to the decrease of adiponectin. This can be also observed in the results of glucose- and insulin tolerance tests in AKO mice which show there to be no difference in insulin sensitivity between AKO and Lox mice (data not shown), indicating that the increased TNF-α synthesis in adipose tissue of AKO mice does not affect systemic insulin sensitivity. Hence, this suggests that, although decrease of adiponectin secretion in AKO mice may stunt enhancement of insulin sensitivity, AKO mice are not led to the state of insulin resistance by the increase in TNF-α expression. On the other hand, our findings showing an increase in adiponectin expression in GKO mice give an explanation for elevated AMPK activity in muscle and liver of GKO mice reported previously [18,19]. Adiponectin is well known to induce phosphorylation and activation of AMPK in skeletal muscle and liver, increasing acetyl-CoA carboxylase phosphorylation and fatty acid oxidation [20]. Therefore, our data reveal that global SCD1 deficiency increases adiponectin secretion, by which AMPK phosphorylation is stimulated in muscle and liver of GKO mice.
It remains unclear how adipose-specific SCD1 deletion up-regulates GLUT1 expression. In the present study, we found reduced expression of adiponectin with concomitant elevated level of GLUT1 expression, without significant change in GLUT4 expression, in adipose tissues of AKO mice compared to Lox controls. This suggests that adipose-specific deletion of SCD1 leads to the reduction of adiponectin expression in adipose tissue, causing the up-regulation of GLUT1 expression for maintenance of glucose transport. One possible explanation to account for this observation is that, upon reduction of glucose uptake in the muscle and liver in response to lower adiponectin secretion in AKO mice, GLUT 1 is up-regulated in adipocytes with little change in GLUT4 expression as a means of compensating for the reduced systemic glucose uptake.
In summary, the present study shows that adipose-specific deletion of SCD1 induces a different regulation of glucose transporters in adipose tissue from global deficiency of SCD1. This differential regulation appears to be mediated by changing secretion of adipokines. Based on the need to clarify the relative contributions of individual tissues to metabolic changes elicited by global SCD1 deficiency, the results of this study give some answers about the role of adipose tissue in regulating glucose homeostasis in SCD1-deficient conditions. Our results also provide new insights for understanding the influence of adipose-specific SCD1 deficiency on energy metabolism and analysis of the impact of modulation of SCD1, a therapeutic target for obesity and related metabolic disorders.
Research Highlights.
SCD inhibition enhances basal glucose uptake and upregulates GLUT1 in 3T3-L1 cells
Adipose-specific SCD1 deletion upregulates GLUT1, but not GLUT4, in adipose tissue
Adipose SCD1 deficient mice have lowered adiponectin relative to Lox control mice
Global SCD1 deficiency upregulates GLUT4 and adiponectin in adipose tissue
GLUT1 may play a critical role in glucose homeostasis in adipose SCD1 deficiency
Acknowledgments
This work was supported by the National Research Foundation Grant funded by the Korean Government (MEST, 2009-0065952, to C. K. Hyun) and NIH Grant (RO1DK-62388, to J. M. Ntambi).
Footnotes
Publisher's Disclaimer: This is a PDF file of an unedited manuscript that has been accepted for publication. As a service to our customers we are providing this early version of the manuscript. The manuscript will undergo copyediting, typesetting, and review of the resulting proof before it is published in its final citable form. Please note that during the production process errors may be discovered which could affect the content, and all legal disclaimers that apply to the journal pertain.
References
- 1.Flowers MT, Ntambi JM. Role of stearoyl-coenzyme A desaturase in regulating lipid metabolism. Curr Opin Lipidol. 2008;19:248–256. doi: 10.1097/MOL.0b013e3282f9b54d. [DOI] [PMC free article] [PubMed] [Google Scholar]
- 2.Ntambi JM, Miyazaki M, Stoehr JP, Lan H, Kendziorski CM, Yandell BS, Song Y, Cohen P, Friedman JM, Attie AD. Loss of stearoyl-CoA desaturase-1 function protects mice against adiposity. Proc Natl Acad Sci USA. 2002;99:11482–11486. doi: 10.1073/pnas.132384699. [DOI] [PMC free article] [PubMed] [Google Scholar]
- 3.Miyazaki M, Flowers MT, Sampath H, Chu K, Otzelberger C, Liu X, Ntambi JM. Hepatic stearoyl-CoA desaturase-1 deficiency protects mice from carbohydrate-induced adiposity and hepatic steatosis. Cell Metab. 2007;6:484–496. doi: 10.1016/j.cmet.2007.10.014. [DOI] [PubMed] [Google Scholar]
- 4.Herman MA, Kahn BB. Glucose transport and sensing in the maintenance of glucose homeostasis and metabolic harmony. J Clin Invest. 2006;116:1767–1775. doi: 10.1172/JCI29027. [DOI] [PMC free article] [PubMed] [Google Scholar]
- 5.Rosen ED, Spiegelman BM. Adipocytes as regulators of energy balance and glucose homeostasis. Nature. 2006;444:847–853. doi: 10.1038/nature05483. [DOI] [PMC free article] [PubMed] [Google Scholar]
- 6.Hyun CK, Kim IY, Frost SC. Soluble fibroin enhances insulin sensitivity and glucose metabolism in 3T3-L1 adipocytes. J Nutr. 2004;134:3257–3263. doi: 10.1093/jn/134.12.3257. [DOI] [PubMed] [Google Scholar]
- 7.Kim SH, Shin EJ, Kim ED, Bayaraa T, Frost SC, Hyun CK. Berberine activates GLUT1-mediated glucose uptake in 3T3-L1 adipocytes. Biol Pharm Bull. 2007;30:2120–2125. doi: 10.1248/bpb.30.2120. [DOI] [PubMed] [Google Scholar]
- 8.Fisher MD, Frost SC. Translocation of GLUT1 does not account for elevated glucose transport in glucose-deprived 3T3–L1 adipocytes. J Biol Chem. 1996;271:11806–11809. doi: 10.1074/jbc.271.20.11806. [DOI] [PubMed] [Google Scholar]
- 9.Kim ED, Bayaraa T, Shin EJ, Hyun CK. Fibroin-derived peptides stimulate glucose transport in normal and insulin-resistant 3T3-L1 adipocytes. Biol Pharn Bull. 2009;32:427–433. doi: 10.1248/bpb.32.427. [DOI] [PubMed] [Google Scholar]
- 10.Folch J, Lees M, Sloane Stanley GH. A simple method for the isolation and purification of total lipides from animal tissues. J Biol Chem. 1957;226:497–509. [PubMed] [Google Scholar]
- 11.Xin Z, Zhao H, Serby MD, et al. Discovery of piperidine-aryl urea-based stearoyl-CoA desaturase 1 inhibitors. Bioorg Med Chem Lett. 2008;18:4298–4302. doi: 10.1016/j.bmcl.2008.06.088. [DOI] [PubMed] [Google Scholar]
- 12.Talior I, Yarkoni M, Bashan N, Eldar-Finkelman H. Increased glucose uptake promotes oxidative stress and PKC- activation in adipocytes of obese, insulin-resistant mice. Am J Physiol Endocrinol Metab. 2003;285:E295–E302. doi: 10.1152/ajpendo.00044.2003. [DOI] [PubMed] [Google Scholar]
- 13.Rahman SM, Dobrzyn A, Lee SH, Dobrzyn P, Miyazaki M, Ntambi JM. Stearoyl-CoA desaturase 1 deficiency increases insulin signaling and glycogen accumulation in brown adipose tissue. Am J Physiol Endocrinol Metab. 2005;288:E381–E387. doi: 10.1152/ajpendo.00314.2004. [DOI] [PubMed] [Google Scholar]
- 14.Rasouli N, Kern PA. Adipocytokines and the metabolic complications of obesity. J Clin Endocrinol Metab. 2008;93:S64–S73. doi: 10.1210/jc.2008-1613. [DOI] [PMC free article] [PubMed] [Google Scholar]
- 15.Lago F, Dieguez C, Gómez-Reino J, Gualillo O. Adipokines as emerging mediators of immune response and inflammation. Nat Clin Pract Rheumatol. 2007;3:716–724. doi: 10.1038/ncprheum0674. [DOI] [PubMed] [Google Scholar]
- 16.LaRosa PC, Miner J, Xia Y, Zhou Y, Kachman S, Fromm ME. Trans-10, cis-12 conjugated linoleic acid causes inflammation and delipidation of white adipose tissue in mice: a microarray and histological analysis. Physiol Genomics. 2006;27:282–294. doi: 10.1152/physiolgenomics.00076.2006. [DOI] [PubMed] [Google Scholar]
- 17.Choi Y, Kim YC, Han YB, Park Y, Pariza MW, Ntambi JM. The trans-10,cis-12 isomer of conjugated linoleic acid downregulates stearoyl-CoA desaturase 1 gene expression in 3T3-L1 adipocytes. J Nutr. 2000;130:1920–1924. doi: 10.1093/jn/130.8.1920. [DOI] [PubMed] [Google Scholar]
- 18.Dobrzyn A, Dobrzyn P, Lee SH, Miyazaki M, Cohen P, Asilmaz E, Hardie DG, Friedman JM, Ntambi JM. Stearoyl-CoA desaturase-1 deficiency reduces ceramide synthesis by downregulating serine palmitoyltransferase and increasing beta-oxidation in skeletal muscle. Am J Physiol Endocrinol Metab. 2005;288:E599–E607. doi: 10.1152/ajpendo.00439.2004. [DOI] [PubMed] [Google Scholar]
- 19.Dobrzyn P, Dobrzyn A, Miyazaki M, Cohen P, Asilmaz E, Hardie DG, Friedman JM, Ntambi JM. Stearoyl-CoA desaturase 1 deficiency increases fatty acid oxidation by activating AMP-activated protein kinase in liver. Proc Natl Acad Sci USA. 2004;101:6409–6414. doi: 10.1073/pnas.0401627101. [DOI] [PMC free article] [PubMed] [Google Scholar]
- 20.Zhang BB, Zhou G, Li C. AMPK: an emerging drug target for diabetes and the metabolic syndrome. Cell Metab. 2009;9:407–416. doi: 10.1016/j.cmet.2009.03.012. [DOI] [PubMed] [Google Scholar]