Abstract
When people make decisions they often face opposing demands for response speed and response accuracy, a process likely mediated by response thresholds. According to the striatal hypothesis, people decrease response thresholds by increasing activation from cortex to striatum, releasing the brain from inhibition. According to the STN hypothesis, people decrease response thresholds by decreasing activation from cortex to subthalamic nucleus (STN); a decrease in STN activity is likewise thought to release the brain from inhibition and result in responses that are fast but error-prone. To test these hypotheses—both of which may be true—we conducted two experiments on perceptual decision making in which we used cues to vary the demands for speed vs. accuracy. In both experiments, behavioral data and mathematical model analyses confirmed that instruction from the cue selectively affected the setting of response thresholds. In the first experiment we used ultra-high-resolution 7T structural MRI to locate the STN precisely. We then used 3T structural MRI and probabilistic tractography to quantify the connectivity between the relevant brain areas. The results showed that participants who flexibly change response thresholds (as quantified by the mathematical model) have strong structural connections between presupplementary motor area and striatum. This result was confirmed in an independent second experiment. In general, these findings show that individual differences in elementary cognitive tasks are partly driven by structural differences in brain connectivity. Specifically, these findings support a cortico-striatal control account of how the brain implements adaptive switches between cautious and risky behavior.
Keywords: basal ganglia, response time model, speed–accuracy tradeoff, structural connectivity, subthalamic nucleus
For many everyday life decisions, people and animals face the dilemma that fast decisions tend to be error-prone, whereas accurate decisions tend to be relatively slow. In other words, the temporal benefits of responding quickly come at a cost of increased error rates, a phenomenon known as the speed–accuracy tradeoff (SAT) (1–6).
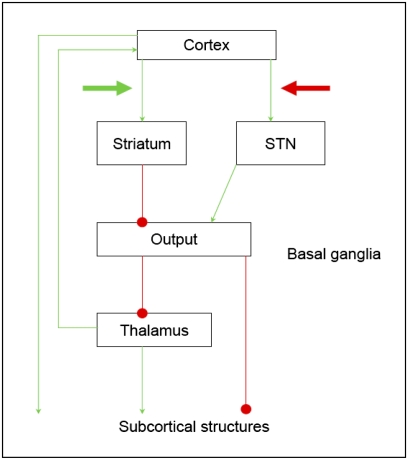
Even though the SAT is ubiquitous in many areas of decision making, relatively little is known about its neurobiological underpinnings. Currently available empirical data (2, 7, 8) and neurocomputational models both suggest several brain mechanisms that could be responsible for how people switch from cautious behavior that is accurate but slow to risky behavior that is fast but error-prone (1). The work presented here is relevant for two hypotheses about how the brain controls the SAT (Fig. 1). First, the striatal hypothesis posits that an emphasis on speed promotes excitatory input from cortex to striatum; the increased baseline activation of the striatum acts to decrease the inhibitory control that the output nuclei of the basal ganglia exert over the brain, thereby facilitating faster but possibly premature responses (2). Second, the STN hypothesis posits that an emphasis on accuracy promotes excitatory input from cortex (e.g., anterior cingulate cortex) to the subthalamic nucleus (STN); increased STN activity may lead to slower and more accurate choices (9).
Fig. 1.
Striatal vs. STN theories for the SAT (1). Arrows denote excitatory connections, circles denote inhibitory connections.
In this study we focused on individual differences, both in behavior and in structural features of the human brain, because the striatal and STN hypotheses make different predictions for the relationships between these individual differences. In particular, the striatal hypothesis predicts that the participants who are able to better control SAT have stronger connections between cortex and striatum, whereas the STN hypothesis predicts that they have stronger connections between cortex and STN. We first tested these predictions in the experiment that is the focus of this article, and then replicated the results in data from a second, independent experiment.
Results
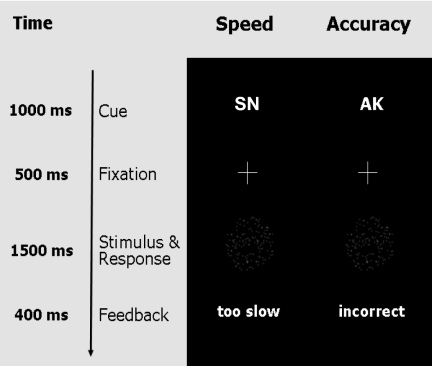
In a behavioral session, nine participants performed a “moving-dots task” (10, 11), which requires quick decisions about whether a cloud of dots appears to move to the left or the right (Fig. 2). SAT was experimentally manipulated by means of pseudorandomly intermixed cues (i.e., the German abbreviations “SN” for speed and “AK” for accuracy) that instructed participants to adopt different levels of cautiousness on a trial-by-trial basis.
Fig. 2.
Moving dots paradigm with cues emphasizing speed (SN is the German abbreviation for fast), and accuracy (AK is the German abbreviation for accurate).
Behavioral Data and LBA Model.
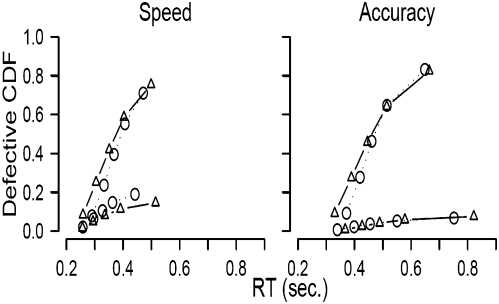
The behavioral data (Fig. 3) showed the expected effect: compared with the accuracy cue, the speed cue resulted in performance that was both faster and less accurate. We modeled the behavioral data with the linear ballistic accumulator (LBA) (2, 12), a mathematical model that decomposes the observed response time and accuracy measures into latent psychological processes. The model allows researchers to separately quantify decision processes, such as speed of information accumulation, nondecision time, and response caution (11). In the LBA model, response caution is conceptualized as the distance from the starting point to the response threshold; this distance quantifies the average amount of evidence that needs to be accumulated before a response is initiated (1, 11, 12). For historical reasons we assume that changes in response caution originate from adjustments of response thresholds. Note, however, that adjustments of response thresholds are mathematically equivalent to adjustments of starting points, and therefore the LBA model cannot be used to distinguish between these two accounts.
Fig. 3.
Observed and predicted defective cumulative density functions. For speed and accuracy conditions, the upper and lower lines show data and LBA model fit for correct and error responses, respectively.
Statistical model selection techniques (Materials and Methods) confirmed that the LBA explained the data best when response threshold was the only parameter free to vary between the two experimental conditions. With this restriction the LBA provided an excellent fit to the data (Fig. 3). These statistical considerations confirm that the speed and accuracy cues acted to influence selectively the level of caution with which participants performed the task. Individual differences in efficacy of changing response caution were quantified by the differences in LBA threshold estimates between the accuracy condition and the speed condition.
Ultra-High-Resolution MRI and Diffusion Tensor Imaging.
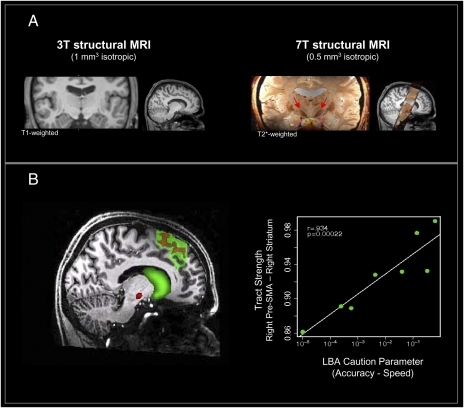
In different sessions, the same participants underwent two structural MRI scans. Interest centered on the brain structures hypothesized to be involved in SAT: presupplementary motor area (pre-SMA), primary motor area, anterior cingulate cortex, inferior frontal gyrus, striatum, and STN. Diffusion-weighted MR images were acquired on a 3 Tesla (T) scanner to quantify the connectivity between the relevant brain areas using probabilistic tractography (13). Fig. 4A shows that it is very difficult to pinpoint the location of the STN using standard 3T MR image resolution and contrast and that it is particularly difficult to distinguish the anterior medial part of the STN from the substantia nigra pars reticularis. Thus, ultra-high-resolution 7T MR scans were acquired and used for manual segmentation of the STN. Two researchers independently segmented each participant's STN with high interrater reliability (mean/SD of Cohen's κ = 0.86/0.05; intraclass correlation coefficient of STN volumes as measure of agreement between the two raters, 0.94; SI Appendix, SI Text).
Fig. 4.
Structural differences in brain connectivity predict individual differences in decision making. (A) The STN (arrows) can be localized precisely with 7T scanning but not with 3T scanning. (B) Connectivity-based seed classification for the pre-SMA projecting into the striatum (green) and STN (red). Individual differences in tract strength between right pre-SMA and right striatum are associated with flexible adjustments of SAT.
STN segmentations from the two raters were conjoined and used for probabilistic tractography using connectivity-based seed classification to quantify the relative fiber tract strengths between pre-SMA, primary motor area, anterior cingulate cortex, inferior frontal gyrus, striatum, and STN (SI Appendix, SI Text).
Individual Differences.
We then examined the possible relation between the individual differences obtained from the behavioral LBA model and the structural indices of brain connectivity (Fig. 4B). Our data show that participants who flexibly change response thresholds have strong structural connections between right pre-SMA and right striatum (R = 0.934, 95% confidence interval 0.652–1, P = 0.0002), whereas no such association was present for the connections between other considered brain areas, including the connections from cortical areas to STN (SI Appendix, SI Text). The 95% confidence interval on the correlation suggests that the magnitude of the correlation is estimated with considerable uncertainty; moreover, prior knowledge suggests that the true correlation is likely to be lower than the point estimate of 0.915—nevertheless, the results are consistent with the striatal hypothesis and statistically support the claim that there is some positive association between LBA flexibility and the strength of structural connections between right pre-SMA and right striatum. To further increase our confidence that this highly significant association was not due to chance, we sought additional evidence.
Independent Replication Study.
We replicated the above results using data from an independent study (2). In this study, 12 participants again contributed behavioral data from a moving-dot task under cue-induced emphasis on speed vs. accuracy. As before, the LBA model fits indicated that the effect of the cue instruction could be accounted for by only changing response caution (see figure 2 in ref. 2). These 12 participants had also undergone diffusion 3T MR scans, the data from which have not previously been reported.
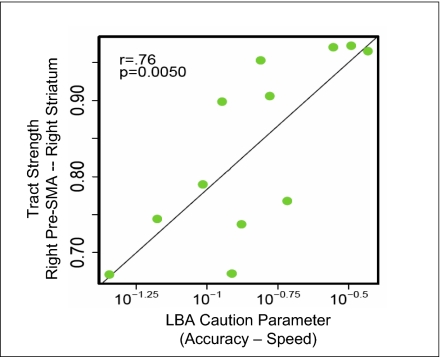
We analyzed the data from the structural 3T scans with probabilistic tractography, using the same cortical and subcortical masks as in the first study presented above. The results confirmed that tract strength between the right pre-SMA and right striatum again predicted the efficiency with which participants change their response thresholds (R = 0.763, 95% confidence interval 0.269–0.949, P = 0.005; see Fig. 5 and SI Appendix, SI Text). Note that this replication study and its analysis are statistically independent from the first experiment; hence, the probability that the measured strength of the same tract as before would once again yield the highest correlation with the LBA parameter is small (i.e., 1/18, because 18 connections were tested; see SI Appendix, SI Text), and the probability that this correlation would again be significant is very small (<0.0002).
Fig. 5.
Independent replication: individual differences in tract strength between right pre-SMA and right striatum are again associated with flexible adjustments of SAT.
Thus, both studies suggest that the flexibility with which people change thresholds is positively associated with the strength of white matter tracts from striatum to pre-SMA. In addition, our studies did not yield reliable evidence for an association between flexibility and the strength of white matter tracts that involve the STN. However, the 95% confidence intervals on the correlations that involve the STN are relatively wide (SI Appendix, SI Text), and this indicates that the present data lack the precision to detect small or medium-sized correlations. Thus, our analyses do not provide strong support against the assertion that the STN mediates threshold settings; the absence of evidence does not constitute compelling evidence for the absence of an association.
Discussion
How does the brain switch between behavior that is cautious (i.e., accurate but slow) and behavior that is risky (i.e., fast but error-prone)? Consistent with the striatal hypothesis of SAT, our findings suggest that the connections between pre-SMA and striatum act to enhance flexible adjustments of response caution. This suggestion is based on an association between a psychological process (i.e., the efficacy of changing response caution) and structural measures of brain connectivity. The former is a latent, unobserved process, the estimation of which was made possible by the application of the LBA model for response time and accuracy; the latter is a measure of brain connectivity that is intrinsic to the individual, context independent, and unaffected by what the participants are doing or thinking at the time of measurement. The association between these two very different variables was predicted by the striatal hypothesis, and we are not aware of other hypotheses or theories that would have made the same prediction.
Anatomical data suggest that striatal neurons can be divided into two groups (14): one projecting directly to the basal ganglia output nuclei (i.e., the direct pathway) and the other projecting to the output nuclei via inhibitory neurons in the globus pallidus externa (i.e., the indirect pathway). Whereas both types of striatal neurons receive input from cortical motor areas (15), activation of the direct pathway facilitates movements, and activation of the indirect pathway inhibits movements (14). On the basis of these anatomical considerations alone it is difficult to predict whether increased cortico-striatal activation is excitatory or inhibitory. However, the study of Forstmann et al. (2) demonstrated that in the motion discrimination task, the overall striatal activity (as measured by the blood oxygen level–dependent signal) was higher in the speed condition, in which participants made faster responses. This suggests that in this context, increased cortico-striatal activation is overall more likely to facilitate than inhibit responses.
Our findings also show that, inconsistent with the STN hypothesis of SAT, there is little or no evidence that strong connections from any cortical region to STN lead to more flexibility in threshold settings. It is unlikely that this result is due to an inability to locate the STN precisely; in fact, we used ultra-high-resolution 7T structural MRI to manually segment the STN—this procedure provided results far superior to those that could be obtained with standard 3T imaging (compare Fig. 4A). Instead, the relatively wide 95% confidence intervals suggest that the two studies may not have had enough participants to determine the relation between tract strength and threshold flexibility with sufficient precision. It is clear that the present data do not support the STN hypothesis but that they also do not allow it to be confidently rejected. Future work will have to determine the role, if any, that the STN plays in the tradeoff between speed and accuracy.
Several other studies have examined the association between behavior and structural measures of the brain. For instance, differences in brain connectivity have been associated with effects of juggling training (16), effects of musical training (17), and the effects of age on task-switching (18); in addition, individual differences in brain connectivity have been linked to individual differences in personality traits (19), choice response time (20), and response inhibition (21). These individual differences in white matter connectivity may originate from individual differences in axon caliber or neural myelination (22, 23), suggesting that the structural connectivity measures may provide partial information about the functional effectiveness of fiber bundles (because bundles with a higher degree of myelination are able to process information more rapidly). The above work suggests that research on individual differences in brain connectivity provides a window onto human cognition that is complementary to that provided by popular methods such as functional MRI or transcranial magnetic stimulation.
In sum, our findings suggest that individual differences in tract strength between pre-SMA and striatum translate to individual differences in the efficacy with which people change their response thresholds. This supports the striatal hypothesis of how the brain regulates the competing demands for speed vs. accuracy and shows that individual differences in brain connectivity affect decision making even in simple perceptual tasks.
Materials and Methods
Participants.
All nine participants (six female, mean age 24.5 y, SD age 2.1 y) gave informed consent before the experiment. Participants had normal or corrected-to-normal vision, and none of them had a history of neurological, major medical, or psychiatric disorders. All participants were right-handed, as confirmed by the Edinburgh Inventory (24). The experimental standards were approved by the local ethics committee of the University of Leipzig. Data were handled anonymously.
Behavioral Task.
In a separate session, participants performed a moving-dots task, popular in neuroscience and research with primates (10; for an overview see ref. 11) (Fig. 1). This task required participants to decide whether a cloud of dots appears to move to the left or the right. Out of 120 dots, 60 moved coherently and 60 moved randomly. From one 50-ms frame to the next, the “coherent set” of 60 dots was moved 1 pixel in the target direction, whereas the remaining “random set” of 60 dots was relocated randomly. On the subsequent frame, the coherent set and the random set switched roles, such that each dot was displaced coherently on one frame and displaced randomly on the next. This scheme ensures that the cloud remains centered, even though it gives the impression of moving systematically in one direction. Each dot consisted of 3 pixels, and the diameter of the entire cloud circle was 250 pixels. In this circle, pixels were uniformly distributed (see also ref. 2).
Participants indicated their response by pressing one of two spatially compatible buttons with their left or right index finger. A cue (i.e., SN for speed and AK for accuracy) instructed participants to adopt different levels of cautiousness on a trial-by-trial basis. The cue was presented for 1,000 ms. Cues were pseudorandomly intermixed. After each cue, a fixation cross was displayed for 500 ms. Subsequent to fixation, participants had 1,500 ms to view the stimulus and give a response. The stimulus disappeared as soon as a response was made. At the end of each trial, participants received feedback that depended on the previously presented cue. In the speed condition, participants saw the message “too slow” whenever they exceeded a response time criterion of 400 ms or “in time.” In the accuracy condition, participants saw the message “incorrect” whenever they made an incorrect response or “correct” whenever they made a correct response. This feedback procedure provided an additional incentive for participants to adopt different levels of response caution in response to the different cues (2). A total of 425 speed trials and 425 accuracy trials were included in the experiment. The experiment took ≈50 min.
LBA Model for Response Speed and Accuracy.
The LBA model has five parameters that determine its predictions for a pair of correct and incorrect response time distributions. However, many of these parameters can be fixed across different experimental conditions. For example, in our experiment, it is reasonable to expect that the response threshold parameter b should be equal for left- and right-moving stimuli. Equally, one might expect the response threshold parameter to be different across the two types of cue (speed and accuracy) because these were intended precisely to manipulate response caution.
We investigated eight different designs for constraining the parameters of the LBA model across the key experimental manipulation (speed vs. accuracy cue). The eight different designs consisted of all combinations allowing three model parameters to either vary with cue type or be fixed across cue type. The three parameters tested in this way were the response threshold parameter (b), the drift rate parameter (v), and the time taken for nondecision processes (t0). We made the simplifying assumption that the variability of the start point distribution should be fixed between speed and accuracy conditions (i.e., parameter A). The variability of the drift rate distribution was arbitrarily fixed at s = 1, to satisfy a mathematical scaling property of the model.
For each of the eight model constraint designs, we fit the data using maximum likelihood estimation. Start points for SIMPLEX searches (25) were generated using automatic heuristics. For all models except the simplest, extra parameter searches were conducted using start points generated from the best-fitting parameters for simpler, nested models. The best-fitting parameters were used to calculate Bayesian Information Criterion (BIC) measures of model adequacy (26) for each of the eight designs, separately for each participant.
The design with the best BIC summed across participants allowed only response threshold (b) to vary with speed vs. accuracy cue, keeping all other parameters fixed. This confirms that the experimental manipulation of urgency cues successfully influenced participants to change the amount of evidence they required to make a decision. The average parameter estimates, across participants, showed that the effect of cue type was quite strong—average response thresholds were set at 1.78 times the minimum possible value in response to an accuracy cue but only 1.39 times the minimum value in response to a speed cue. The minimum possible value for the response threshold is the upper limit of the start point distribution (estimated at A = 0.734). The other average parameter estimates were: nondecision time, t0 = 146 msec; mean drift rate for the accumulator corresponding to the correct response was 2.68, and for the accumulator corresponding to the incorrect response was 1.14.
Data Acquisition of Ultra-High-Resolution Anatomical Images.
Participants underwent structural scanning on a 7T Magnetom MRI system (Siemens) with a 24-channel head array Nova coil (Nova Medical). The whole brain was acquired with a magnetization prepared rapid-acquisition gradient echo (MP-RAGE) (27) sequence [repetition time (TR) = 3,000 ms, echo time (TE) = 2.95 ms, inversion time (TI) = 1,100 ms, voxel size = 0.8 mm isotropic, flip angle = 6°, GRAPPA acceleration factor = 2]. Moreover, a multiecho fully flow-compensated spoiled 3D gradient echo (GRE) (28) sequence (TR = 43 ms, TE = 11.22 ms, TE = 21.41 ms, TE = 31.59 ms, flip angle = 13°, voxel 0.5 × 0.5 × 0.6 mm3, 56 coronal slices) was acquired. To assess replicability of the results, the GRE sequences were repeated during each session and for participant. Subsequently, correlations for all voxels within each individual STN were computed within sessions. For each participant, the results showed a high correlation between voxels (r > 0.8). Acquisition time was ≈60 min for each session. The T1-weighted MP-RAGE scans were coregistered into Talairach space (29), and the GRE images were registered on the T1 images using rigid-body transformations with a mutual information cost function as implemented in FSL (www.fmrib.ox.ac.uk/fsl).
Data Acquisition and Preprocessing of Diffusion-Weighted Data.
With a 32-channel array head coil and a maximum gradient strength of 40 mT/m, diffusion-weighted data and T1-weighted images were acquired on a Siemens 3T Tim Trio scanner. The diffusion-weighted data were acquired using spin-echo echo planar imaging (TR = 11 s, TE = 90 ms, 85 axial slices, resolution 1.5 × 1.5 × 1.5 mm). Diffusion weighting was isotropically distributed along 60 directions (b-value = 1,000 s/mm2, number of excitations = 3). Note that high angular resolution of the diffusion weighting directions yields robust probability density estimation by increasing the signal-to-noise ratio and reducing directional bias. Seven data sets with no diffusion weighting (b0) were acquired initially and after each block of 10 diffusion weighted images. These images served as an anatomical reference for offline motion correction. The acquisition of this protocol lasted ≈42 min.
All baseline b0 images were aligned to a reference b0 image to estimate motion correction parameters using rigid-body transformations implemented in FLIRT (part of FSL software). The resulting linear transformation matrices were combined with a global registration to the T1 anatomy computed with the same method. The gradient direction for each volume was corrected using the rotation parameters. The transformation matrices were applied to the diffusion-weighted images, and the three corresponding acquisitions and gradient directions were averaged.
Tractography.
Diffusion image preprocessing and analyses was done using FSL 4.1.4 (www.fmrib.ox.ac.uk/fsl). In accordance with Behrens et al. (13), estimation of tracts was conducted using probabilistic tractography. A probabilistic fiber tracking approach was chosen, using 5,000 tract-following samples at each voxel with a curvature threshold of 0.2. A dual-fiber model as implemented in the latest version of bedpostX (FSL 4.1.4) was used. Dual-fiber models account for crossing fibers (30), therefore yielding more reliable results compared with single-fiber models. All tractography was done in each participant's native space (unnormalized) data, and resulting maps were warped into standard space [using the Montreal Neurological Institute (MNI) 1-mm isotropic brain as reference] for cross-participant averaging and comparison. For the estimation of tract strength between the subcortical (e.g., striatum) as well as cortical (e.g., pre-SMA) areas, MNI-space masks were normalized to each participant's native space, using the inverse of the normalization parameters (SI Appendix, Fig. S1). Visual inspection ensured that tractography maps were successful and acceptable for further analysis. For the estimation of tract strength between the STN and cortical areas, the individual manually segmented conjoined masks (i.e., overlap masks derived from both raters were used). Seed-based classification was done by first thresholding the images such that only voxels with at least 10 samples are kept (31). Next, voxel values were converted into proportions, such that the value at each voxel becomes the number of samples reaching the target mask for that image, divided by the number of samples that reach any target mask.
Seed-based classification was done from several cortical sites (SI Appendix, Figs. S1 and S2) into the STN as well as from the pre-SMA to the striatum. The values were later used for correlations with the mathematical model parameters reflecting response caution (see main text, SI Appendix, Figs. S3–S8, and SI Appendix, Tables S1–S8). All analyses were done separately for each hemisphere.
Supplementary Material
Footnotes
The authors declare no conflict of interest.
This article contains supporting information online at www.pnas.org/lookup/suppl/doi:10.1073/pnas.1004932107/-/DCSupplemental.
References
- 1.Bogacz R, Wagenmakers EJ, Forstmann BU, Nieuwenhuis S. The neural basis of the speed-accuracy tradeoff. Trends Neurosci. 2010;33:10–16. doi: 10.1016/j.tins.2009.09.002. [DOI] [PubMed] [Google Scholar]
- 2.Forstmann BU, et al. Striatum and pre-SMA facilitate decision-making under time pressure. Proc Natl Acad Sci USA. 2008;105:17538–17542. doi: 10.1073/pnas.0805903105. [DOI] [PMC free article] [PubMed] [Google Scholar]
- 3.Chittka L, Dyer AG, Bock F, Dornhaus A. Psychophysics: Bees trade off foraging speed for accuracy. Nature. 2003;424:388. doi: 10.1038/424388a. [DOI] [PubMed] [Google Scholar]
- 4.Uchida N, Mainen ZF. Speed and accuracy of olfactory discrimination in the rat. Nat Neurosci. 2003;6:1224–1229. doi: 10.1038/nn1142. [DOI] [PubMed] [Google Scholar]
- 5.Rinberg D, Koulakov A, Gelperin A. Speed-accuracy tradeoff in olfaction. Neuron. 2006;51:351–358. doi: 10.1016/j.neuron.2006.07.013. [DOI] [PubMed] [Google Scholar]
- 6.Pew RW. The speed-accuracy operating characteristic. Acta Psychol (Amst) 1969;30:16–26. [Google Scholar]
- 7.van Veen V, Krug MK, Carter CS. The neural and computational basis of controlled speed-accuracy tradeoff during task performance. J Cogn Neurosci. 2008;20:1952–1965. doi: 10.1162/jocn.2008.20146. [DOI] [PubMed] [Google Scholar]
- 8.Ivanoff J, Branning P, Marois R. fMRI evidence for a dual process account of the speed-accuracy tradeoff in decision-making. PLoS ONE. 2008;3:e2635. doi: 10.1371/journal.pone.0002635. [DOI] [PMC free article] [PubMed] [Google Scholar]
- 9.Frank MJ, Scheres A, Sherman SJ. Understanding decision-making deficits in neurological conditions: Insights from models of natural action selection. Philos Trans R Soc Lond B Biol Sci. 2007;362:1641–1654. doi: 10.1098/rstb.2007.2058. [DOI] [PMC free article] [PubMed] [Google Scholar]
- 10.Britten KH, Shadlen MN, Newsome WT, Movshon JA. The analysis of visual motion: A comparison of neuronal and psychophysical performance. J Neurosci. 1992;12:4745–4765. doi: 10.1523/JNEUROSCI.12-12-04745.1992. [DOI] [PMC free article] [PubMed] [Google Scholar]
- 11.Gold JI, Shadlen MN. The neural basis of decision making. Annu Rev Neurosci. 2007;30:535–574. doi: 10.1146/annurev.neuro.29.051605.113038. [DOI] [PubMed] [Google Scholar]
- 12.Brown S, Heathcote A. The simplest complete model of choice response time: Linear ballistic accumulation. Cognit Psychol. 2008;57:153–178. doi: 10.1016/j.cogpsych.2007.12.002. [DOI] [PubMed] [Google Scholar]
- 13.Behrens TE, et al. Non-invasive mapping of connections between human thalamus and cortex using diffusion imaging. Nat Neurosci. 2003;6:750–757. doi: 10.1038/nn1075. [DOI] [PubMed] [Google Scholar]
- 14.Smith Y, Bevan MD, Shink E, Bolam JP. Microcircuitry of the direct and indirect pathways of the basal ganglia. Neuroscience. 1998;86:353–387. doi: 10.1016/s0306-4522(98)00004-9. [DOI] [PubMed] [Google Scholar]
- 15.Hersch SM, et al. Electron microscopic analysis of D1 and D2 dopamine receptor proteins in the dorsal striatum and their synaptic relationships with motor corticostriatal afferents. J Neurosci. 1995;15:5222–5237. doi: 10.1523/JNEUROSCI.15-07-05222.1995. [DOI] [PMC free article] [PubMed] [Google Scholar]
- 16.Scholz J, Klein MC, Behrens TE, Johansen-Berg H. Training induces changes in white-matter architecture. Nat Neurosci. 2009;12:1370–1371. doi: 10.1038/nn.2412. [DOI] [PMC free article] [PubMed] [Google Scholar]
- 17.Imfeld A, Oechslin MS, Meyer M, Loenneker T, Jancke L. White matter plasticity in the corticospinal tract of musicians: A diffusion tensor imaging study. Neuroimage. 2009;46:600–607. doi: 10.1016/j.neuroimage.2009.02.025. [DOI] [PubMed] [Google Scholar]
- 18.Madden DJ, Spaniol J, Costello MC, Bucur B, White LE. Cerebral white matter integrity mediates adult age differences in cognitive performance. J Cogn Neurosci. 2008;21:289–302. doi: 10.1162/jocn.2009.21047. [DOI] [PMC free article] [PubMed] [Google Scholar]
- 19.Cohen MX, Schoene-Bake JC, Elger CE, Weber B. Connectivity-based segregation of the human striatum predicts personality characteristics. Nat Neurosci. 2009;12:32–34. doi: 10.1038/nn.2228. [DOI] [PubMed] [Google Scholar]
- 20.Tuch DS, et al. Choice reaction time performance correlates with diffusion anisotropy in white matter pathways supporting visuospatial attention. Proc Natl Acad Sci USA. 2005;102:12212–12217. doi: 10.1073/pnas.0407259102. [DOI] [PMC free article] [PubMed] [Google Scholar]
- 21.Forstmann BU, et al. Function and structure of the right inferior frontal cortex predict individual differences in response inhibition: A model-based approach. J Neurosci. 2008;8:9790–9796. doi: 10.1523/JNEUROSCI.1465-08.2008. [DOI] [PMC free article] [PubMed] [Google Scholar]
- 22.Fields RD. White matter in learning, cognition and psychiatric disorders. Trends Neurosci. 2008;31:361–370. doi: 10.1016/j.tins.2008.04.001. [DOI] [PMC free article] [PubMed] [Google Scholar]
- 23.Beaulieu C. The biological basis of diffusion anisotropy. In: Johansen-Berg H, Behrens TEJ, editors. Diffusion MRI: From Quantitative Measurement to in Vivo Neuroanatomy. London: Elsevier; 2009. pp. 105–126. [Google Scholar]
- 24.Oldfield RC. The assessment and analysis of handedness: The Edinburgh Inventory. Neuropsychologia. 1971;9:97–113. doi: 10.1016/0028-3932(71)90067-4. [DOI] [PubMed] [Google Scholar]
- 25.Nelder JA, Mead R. A simplex algorithm for function minimization. Comput J. 1965;7:308–313. [Google Scholar]
- 26.Schwarz G. Estimating the dimension of a model. Ann Stat. 1978;6:461–464. [Google Scholar]
- 27.Deichmann R, Good CD, Josephs O, Ashburner J, Turner R. Optimization of 3-D MP-RAGE sequences for structural brain imaging. Neuroimage. 2000;12:112–127. doi: 10.1006/nimg.2000.0601. [DOI] [PubMed] [Google Scholar]
- 28.Haase A, Frahm J, Matthaei D, Hanicke W, Merboldt KD. FLASH imaging: Rapid NMR imaging using low flip angle pulses. J Magn Reson. 1986;67:258–266. doi: 10.1016/j.jmr.2011.09.021. [DOI] [PubMed] [Google Scholar]
- 29.Talairach J, Tournoux P. Co-Planar Stereotaxic Atlas of the Human Brain: 3-Dimensional Proportional System: An Approach to Cerebral Imaging. New York: Thieme Medical Publishers; 1988. [Google Scholar]
- 30.Behrens TE, Berg HJ, Jbabdi S, Rushworth MFS, Woolrich MW. Probabilistic diffusion tractography with multiple fibre orientations: What can we gain? Neuroimage. 2007;34:144–155. doi: 10.1016/j.neuroimage.2006.09.018. [DOI] [PMC free article] [PubMed] [Google Scholar]
- 31.Aron AR, Behrens TE, Smith S, Frank MJ, Poldrack RA. Triangulating a cognitive control network using diffusion-weighted magnetic resonance imaging (MRI) and functional MRI. J Neurosci. 2007;27:3743–3752. doi: 10.1523/JNEUROSCI.0519-07.2007. [DOI] [PMC free article] [PubMed] [Google Scholar]
Associated Data
This section collects any data citations, data availability statements, or supplementary materials included in this article.


