

Abstract
It has been known for decades that the metabolic rate of animals scales with body mass with an exponent that is almost always <1, >2/3, and often very close to 3/4. The 3/4 exponent emerges naturally from two models of resource distribution networks, radial explosion and hierarchically branched, which incorporate a minimum of specific details. Both models show that the exponent is 2/3 if velocity of flow remains constant, but can attain a maximum value of 3/4 if velocity scales with its maximum exponent, 1/12. Quarter-power scaling can arise even when there is no underlying fractality. The canonical “fourth dimension” in biological scaling relations can result from matching the velocity of flow through the network to the linear dimension of the terminal “service volume” where resources are consumed. These models have broad applicability for the optimal design of biological and engineered systems where energy, materials, or information are distributed from a single source.
Keywords: allometric, fractal, hierarchical, metabolic rate, network
Allometric scaling laws reflect changes in biological structure and function as animals diversified to span >12 orders of magnitude in body size. Since the seminal work of Kleiber in 1932, it has been known that the metabolic rate, B, or rate of energy use in most animals and plants scales as approximately the 3/4 power of body mass, M (1–8), and this B ∼ M3/4 scaling has come to be known as Kleiber's rule. Most other biological rates and times, such as heart rates, reproductive rates, blood circulation times, and life times, scale with characteristic quarter powers, as M−1/4 and M1/4, respectively (4–9). This unusual fourth dimension came as a surprise to biologists, who expected that heat dissipation would cause metabolic rate to scale the same as body surface area and hence geometrically as the 2/3 power of volume or mass. Quarter-power scaling lacked a unified theoretical explanation until 1997, when West et al. (WBE) (10) produced a model based on optimizing resource supply and minimizing hydrodynamic resistance in the supply network.
The WBE model stimulated a resurgence of interest in allometric scaling in biology. It initiated a lively debate about the empirical generality of 3/4-power metabolic scaling and its theoretical explanation (11–26). A recent study revived the case for geometric scaling by showing that simple models of distribution networks generate metabolic scaling exponents of 2/3 (25). Nevertheless, the increasing number of empirical studies repeatedly finds exponents >2/3, <1, and often very close to 3/4 (14, 24, 26, 28–30). Here we show that an exponent of 3/4 emerges naturally as an upper bound for the scaling of metabolic rate in two simple models of vascular networks. Furthermore, quarter power scaling is shown to hold even when there is no underlying fractal network. A unique prediction of our models is that blood velocity scales as the 1/12 power of animal mass. These models have broad application to biological and human-engineered systems where resources are distributed from a single source.
We explore two different models in which resources flow from a central source to supply a 3D volume. For simplicity, we omit constants of proportionality that are independent of animal mass, and which ensure that all quantities have proper dimensions. Both models start by making the following simplifying assumptions:
A1. Definition of metabolic rate: Metabolic rate, B, can be measured as the rate of flow of discrete particles through a supply network. In mammals, for example, metabolic rate is routinely measured as the rate of oxygen consumption, and the oxygen molecules are transported in the blood vessels from a central source, the heart, to terminal units, the mitochondria, where they are consumed.
A2. Steady-state postulate: The flux of resources is at steady state, so supply matches demand, the rate B of particles being consumed by the terminal units matches the rate B of particles leaving the source, and the number of particles in transit does not change over time.
A3. Geometric similarity: Animals, especially those in the same taxonomic or functional group, are geometrically similar, so their geometry can be characterized by length, L, surface area, A, and volume, V, and simple Euclidean geometrical scaling gives V ∼ L3 and A ∼ L2.
A4. Directed transport: The average distance (d) from the source to each terminal unit is proportional to the length, L, of the animal (11).
A5. Velocity, v, is assumed to be uniform within an animal. The average transit time, τ, scales as τ ∼ d/v.
A6. Mass is proportional to volume: The density of protoplasm is approximately constant across animals, so mass, M, is proportional to volume, V.
A7. Particles in transit are contained within animal volume: The number of resource particles in transit, N, scales linearly with M and V.
A8. Definition of service volume: We define a service volume as a unit of tissue that has a fixed metabolic rate independent of animal mass. Thus the number of service volumes is proportional to B. In an animal with volume V, each service region has volume proportional to V/B and radius or length
The service volume does not necessarily correspond to any biological structure, although in mammals the service volume can be thought of as the volume of tissue supplied by a capillary, the terminal unit of the vascular network.
The Explosion Network
The simplest centralized network that minimizes transport distances to the service volumes is an explosion network (27), with ∼B independent straight-line routes radiating out from a single central source to supply each of ∼B service volumes (Fig. 1A). We begin with this simple network to derive an upper bound on the metabolic scaling exponent. We first show that if particles travel at a constant velocity, v, not only within a body but also across bodies of varying size, this simple network and the assumptions above generate a metabolic scaling exponent of 2/3 (consistent with ref. 25). Then we allow v to increase with increasing body size and show that the metabolic scaling exponent can also increase, but only up to an upper bound of 3/4. This upper bound is determined by the characteristic length of the service volume, ls, and this length and the velocity, v, will both be shown to scale as M1/12.
Fig. 1.

Sketches of 2D supply networks. Similar considerations apply to 3D animals. All three networks depict the supply routes from a single source to the service regions. (A) Radial explosion network. An individual route directly connects the central source to each service volume. The average length of a route is proportional to the length (L) of the animal, where L ∼ M1/3. The shortest routes (solid lines) are those to service volumes adjacent to the source, so their length is ls ∼ (V/B)1/3 ∼ (M/B)1/3. The scale of the velocity is set by these routes and yields Eq. 3. (B) Hierarchical branching network, similar to that described by West et al. (10). The shortest pipes (capillaries, solid lines) are proportional to the radius of the service volume (M/B)1/3. There is backtracking through the pipes, so that the distance from the heart through the arteries to each service volume is the same and is equal to the length (L) of the animal, where L ∼ M1/3. (C) Hierarchical branching network without backtracking. The network is similar to A in that there is no backtracking as blood flows from the central source to the service volumes and it is similar to B in that nearby supply routes are aggregated and the lengths of the shortest pipes (capillaries, solid lines) are proportional to the radius of the service volume (M/B)1/3.
First we hold v constant and calculate B. The total number of particles in transit, N, is the number of routes times the mean number of particles in transit per route. Because there are ∼B service volumes (A8), there are ∼B routes. The number of particles in transit per route equals the length of a route divided by the separation distance, s, between particles on the route. The average length of a route is the mean distance from the source to each of the B service volumes, which scales as L ∼ V1/3 (from A3 and A4).
The steady-state assumption (A2) requires a relationship between the velocity of particles on a route and the separation distance between particles (Fig. 2). Consider a single route between the source and a service volume. From A8, one particle is consumed by the service volume in a fixed unit of time. From A2, for each particle consumed in the service volume, another particle leaves the source and enters the route. So, the separation distance, s, between nearest particles on a straight-line route is proportional to their velocity, v:
Fig. 2.

Schematic demonstration of how length scales change with animal mass (M) in the radial explosion network. In each animal, the length scale (L) and average distance between the central source and the service regions (d) are proportional to M1/3, the volume of the service region is ∼M/B, and from Eq. 1, the length of the service volumes (ls) is proportional to (M/B)1/3. The length of the shortest pipe is ∼ls, and thus the maximum separation between particles, s, is ∼ls. From Eqs. 1 and 5, ls ∼ M1/12. Thus, in A, s is slightly larger (∼M1/12) and d is much larger (∼M1/3) than in B. Because velocity is proportional to s (Eq. 2), we have the following relationships: 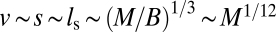 ,
, 
Because in this case we assume that v is constant within and between animals, then s is also constant. Because the average distance along a route is ∼V1/3 (from A3), the mean number of particles in transit per route, L/s is also ∼V1/3. The total number of particles in transit, N, is obtained by multiplying the number of routes (∼B) times the mean number of particles per route (∼V1/3). Thus, N ∼ BV1/3. Because N ∼ V (from A7), then B ∼ V2/3 ∼ M2/3. So this very simple network gives metabolic rate scaling with the same geometric 2/3 power as body surface area (25).
We now relax the assumption that velocity is constant across animals. We keep the assumption that v is uniform within a body, but allow v to vary across bodies of varying body size. As above, the delivery rate of particles along each route to a service volume is fixed. Thus, the velocity, v, must be proportional to the separation distance, s, between particles along a route. One can imagine that particles can be close together and moving slowly or far apart and moving quickly in order for particles to leave a route and enter a service volume at fixed rate. Again, the steady-state assumption (A2) requires that for every particle consumed in a service volume in each unit of time, a matching particle leaves the source, and so the maximum separation distance between particles on the shortest route is proportional to the length of the shortest route. The length of the shortest route is the distance from the source to the nearest service volume and hence proportional to the radius of the service volume, s ∼ ls (Fig. 2). From Eq. 2, v ∼ s, so the maximum velocity, v, along this shortest route is also proportional to ls, and because v is uniform within an animal, its maximum value is ∼ls. Another way of understanding this result is to note that if the ratio of the velocity with ls, were to increase with M, so would the rate that particles arrive at the nearest service volume, contradicting our assumption (A8) that each service volume has a fixed metabolic rate independent of M. Substituting from Eq. 1,
To derive the scaling of B, we again note that N is proportional to the number of routes times the number of particles per route. Again the number of routes is ∼B, and the number of particles per route is ∼L/v. Substituting L ∼ V1/3 and v from Eq. 3 gives
Rearranging and expressing these variables in terms of mass leads to the central scaling relations
and because the time in transit, τ, is equal to the average length of a route divided by the velocity,
So, the explosion model, Eq. 5, gives the frequently observed 3/4-power scaling of metabolic rate, Eq. 6 gives a 1/12-power scaling of velocity, Eq. 7 gives the 1/4-power scaling of characteristic biological times, and, because rates ∼1/τ, also the −1/4-power scaling of mass-specific metabolic rate and other biological rates. The 1/12-power scaling of the velocity with mass is a unique prediction of our theory. So quarter-power scaling is possible if velocity increases with increasing size with the maximum possible exponent of 1/12, and this allows metabolic rate to scale with a maximum possible exponent of 2/3 + 1/12 = 3/4. If natural selection maximizes metabolic power and minimizes time to deliver resources to cells, we expect to observe empirically measured exponents close to this maximum possible value of 3/4. The explosion network is a specific example of a class of simple centralized networks that naturally give B ∼ M3/4 as the upper bound for the scaling of metabolic rate.
The Hierarchical Branching Network
We now consider the case where the separate routes supplying the service volumes are bundled together into a hierarchy of successively larger pipes culminating in a single large pipe at the source. It is important to note that, in the explosion network, the metabolite particles are not contained within pipes, but in the hierarchical branching network we introduce pipes with a total pipe volume that is constrained to scale linearly with M and V. The pipes contain a flowing fluid that facilitates transport of dissolved metabolites. An elegant way to accomplish such aggregation is through a fractal-like branching network. This is the design principle that evolved by natural selection to give rise to the hierarchically branched vascular networks of mammals and trees. WBE pointed out that such a fractal-like network, with small vessels joining to form larger ones, has the advantage of lowering the hydrodynamic resistance of blood flow. Our model is based on the mammalian system; we use the terms capillaries, arteries, and aorta, respectively, for the hierarchy of vessels from the service volume back to the heart, and we refer to the particles as red blood cells, which transport oxygen molecules in blood.
Our hierarchical model is similar to WBE's with several important exceptions. The WBE model assumes or derives the following scaling relationships:
W1. The service volume scales as M/B.
W2. The length of a capillary supplying a service volume is constant, so lcap ∼ M0.
W3. The branching of the network is symmetrical so the distance from heart to every capillary and every service volume is the same.
W4. A space-filling assumption gives the characteristic length of each branch of the network proportional to the radius of the volume of tissue that it supplies.
W5. The average velocity of the blood through the network from heart to capillary is invariant with body size and so is ∼M0.
WBE simultaneously and inconsistently assume that capillary length is invariant with size, lcap ∼ M0 (W2), but also that it is proportional to the radius (ls) of a service volume (W4), where the service volume is ∼M/B (W1), so capillary length lcap ∼ ls ∼ (M/B)1/3. To resolve the contradiction of whether the length of a capillary is invariant, so is ∼M0, or scales allometrically, so is ∼(M/B)1/3, we keep assumptions W1 and W4 but modify assumption W2 to set the length of a capillary proportional to the radius of the service volume, so lcap ∼ ls ∼ (M/B)1/3 as in Eq. 1. We keep this characteristic scaling for lengths of vessels up through the hierarchy from capillary to aorta, so the average distance from heart to capillary and the length of the aorta scale as M1/3, consistent with our assumption of Euclidean geometric scaling of lengths. By contrast, the WBE model, with contradictory assumptions (W2 and W4), predicts that the average total distance through the network from heart to capillary and the characteristic length of a vessel, such as the aorta, scale as M1/4.
WBE also assume that branching is symmetrical (W3), so the total distance through the network from source (heart) to each invariant terminal unit (capillary or service volume) is constant within an animal. We relax this assumption to allow for asymmetric branching, which reduces the transport distance from heart to capillaries (shown in Fig. 1 B and C). A design that incorporates the above modifications of WBE is depicted in Fig. 1C. This design is a centralized, branched network with variable-length paths that minimize distance from the heart to the service volumes.
We assume that the velocity is uniform within a body but, unlike WBE, we allow velocity to vary as a function of animal mass M. As in the explosion network, for every red blood cell arriving in a capillary and delivering its oxygen in a service volume, a red blood cell leaves the heart (A2). Again the velocity must be proportional to the shortest path from heart to the nearest service volume, and therefore to the radius of a service volume, giving v ∼ (M/B)1/3 (from Eq. 2). In this model having velocity scale as v ∼ M1/12 has two effects. First, blood cells are packed together at constant density within arteries. But only the blood cells destined for a particular service region are separated by a distance s ∼ M1/12, as shown in Fig. 3. Second, for the velocity to increase with M, the cross-sectional area of the arteries must be reduced relative to the number of capillaries (also shown in Fig. 3). Blood volume is kept proportional to M by having the M3/4 capillaries supplied by a single aorta with cross-sectional area ∼M2/3 and a network length L ∼ M1/3.
Fig. 3.

Red blood cells in a branching network with no backtracking, as in Fig. 1C. Blood cells are packed into arteries at constant density, whereas blood cells destined for a particular service region are separated by a distance, s ∼ ls ∼ M1/12. Each cell is labeled with the service region it will be delivered to. In this case, ls is approximately the length of two red blood cells. In a larger organism, ls would be larger, and there would be more red blood cells between cells labeled with the same service region. Here there are eight service regions, each serviced by one capillary, so B ∼ 8 ∼ M3/4, and eight red blood cells are released per unit time from the central heart. Those eight red blood cells are squeezed into an aorta with cross-sectional area ∼M2/3, which causes the separation distance(s) and the velocity of blood cells, v, both to be proportional to M1/12.
Now, we invoke the same simplifying assumptions as above (A1–A8), which lead to the same equations (Eqs. 3–6). So our branching model, a significant modification of WBE's, predicts the quarter-power scaling exponents including metabolic rate scaling as M3/4 and velocity as M1/12, both exponents being upper bounds. To see why a larger exponent is not possible without violating the above assumptions, let B ∼ Mθ. The velocity v scales as (M/B)1/3 ∼ M(1−θ)/3. B is also proportional to the volume rate of flow of metabolites, so B ∼ Aav, where Aa is the cross-sectional area of the aorta. Thus, Aa ∼ B/v ∼ M(4θ−1)/3. The total blood volume scales as Aa times aorta length (L ∼ M1/3) and therefore as M4θ/3. By A7, blood volume scales at most as M. Thus, the maximum value of θ is 3/4. As a counter example, if θ = 4/5, then v ∼ ls ∼ M1/15, Aa ∼ B/v ∼ M11/15, and blood volume ∼M16/15, violating assumption A7.
Our hierarchical branching model retains the fractal-like design of WBE but shows how the self-similar branching through the hierarchy of arteries arises naturally, with the number of capillaries (proportional to the metabolic rate) scaling as the cube (in 3D animals) of the ratio of the aorta length (∼M1/3) to the capillary length (∼M1/12). Thus, the aorta length scales as the Euclidean length of the organism while ensuring that blood volume scales linearly with M. The changes from WBE—having blood velocity scaling as M1/12 rather than as M0, aorta length scaling as M1/3 rather than M1/4, and average cross-sectional area of the network scaling as M2/3 rather than M3/4—solve the problem of fitting the fractal-like network into an animal with a fundamentally Euclidean geometry (17).
Conclusions
Two different designs for distribution systems, radial explosion and hierarchically branched networks, give identical scaling exponents: a maximum of 3/4 for metabolic rate, a maximum of 1/12 for velocity, and Euclidean 1/3 for vessel lengths and radii. Empirical studies support the velocity and length scaling predictions (1, 31). Moreover, the empirically observed M1/4 circulation times (4–9) and M1/3 transport distances can be achieved only if blood velocity scales as M1/12.
Real biological networks may deviate from the idealized simplified networks shown above when other factors result in alternative designs. Deviations toward 2/3-power scaling are likely if velocity does not vary significantly with animal mass. Deviations toward linear scaling are likely if there is no vascular system or if the range of body sizes is sufficiently small that blood volume is able to scale superlinearly. Indeed, several studies have recently shown that basal or resting metabolic rate of mammals does not scale as a single power law, but instead the exponent changes from ≈2/3 to 3/4 as body size increases (24, 26, 28). This result is not surprising, because real mammalian metabolic and circulatory systems have many complications that are not included in simple models. These complications include the capacity to vary rate of metabolism and oxygen supply many fold between resting and active states (32) and the need to increase cross-sectional areas of the smallest vessels and reduce blood velocity by several orders of magnitude before blood enters the capillaries (33). Differences between resting, field, and maximum metabolic rates can also arise because of deviations from the basic assumptions, e.g., being in steady state. The canonization of “Kleiber's law” of M3/4 scaling of metabolic rate has led to a search for the “fourth dimension of life” (3, 34, 35). Quarter-power scaling does not arise from fractality, although it emerges naturally in hierarchically branched, fractal-like designs that are so common in both animals and plants. We show how this fourth dimension arises from the scaling of velocity to match the characteristic linear dimension, ls, of the service volume, which in turn comes from the fundamental space-filling property of the resource supply network. The service volume has its analog in other transportation systems that distribute energy, materials, and information from a central source to dispersed locations and that have been designed to maximize performance (36). Examples in engineered networks are the “last mile” that connects individual consumers to global infrastructure networks such as the Internet or the electrical power grid. The absolute length of the “isochronic region” to which timing signals are delivered in computer chips is measured in nanometers, but despite its miniscule size, it determines the frequency of the clock and thus the information processing power of the chip (37), in the same way that that the length of the service volume in an animal determines the speed of oxygen delivery and ultimately rate of metabolism. The service volume is also where a package flown across the globe at a speed of hundreds of miles per hour is walked to a door by a mail carrier and where passengers exit high-speed planes and trains to take slower modes of transport home. The length and speed of transport over this last mile ultimately constrain delivery rates. Strikingly, human engineering and natural selection have both come up with the same principles for the design of resource supply networks.
Acknowledgments
We are indebted to Geoffrey West for many stimulating discussions and reviews of earlier versions of this manuscript. We are grateful to Laszlo Barabasi, Brian Enquist, Rampal Etienne, Jorge Jose, Pablo Marquet, Carlos Martinez del Rio, Han Olff, and Van Savage for a careful reading of the manuscript and for many helpful suggestions. M.E.M. was supported by National Institutes of Health Grant P20 RR018754 as part of the University of New Mexico Center for Evolutionary and Theoretical Immunology. J.H.B. was supported by a grant from the Howard Hughes Medical Institute–National Institute of Biomedical Imaging and Bioengineering Interfaces Initiative to the Program in Interdisciplinary Biological and Biomedical Sciences. A.M. was supported by The Cariparo Foundation.
Footnotes
The authors declare no conflict of interest.
References
- 1.Peters RH. The Ecological Implications of Body Size. Cambridge, UK: Cambridge Univ Press; 1983. [Google Scholar]
- 2.Moses ME, et al. Revisiting a model of ontogenetic growth: Estimating model parameters from theory and data. Am Nat. 2008;171:632–645. doi: 10.1086/587073. [DOI] [PubMed] [Google Scholar]
- 3.Mori S, et al. Mixed-power scaling of whole-plant respiration from seedlings to giant trees. Proc Natl Acad Sci USA. 2010;107:1447–1451. doi: 10.1073/pnas.0902554107. [DOI] [PMC free article] [PubMed] [Google Scholar]
- 4.Lindstedt S, Calder W. Body size, physiological time, and longevity of homeothermic animals. Q Rev Biol. 1981;56:1–16. [Google Scholar]
- 5.McMahon T, Bonner J. On Size and Life. New York: Scientific American Library; 1983. [Google Scholar]
- 6.Calder W. Size, Function and Life History. Cambridge, MA: Harvard Univ Press; 1984. [Google Scholar]
- 7.Schmidt-Nielsen K. Scaling: Why is Animal Size So Important? Cambridge, MA: Cambridge Univ Press; 1984. [Google Scholar]
- 8.Brown J, West G. Scaling in Biology. London: Oxford Univ Press; 2000. [Google Scholar]
- 9.West G, Brown J, Enquist B. Growth models based on first principles or phenomenology? Funct Ecol. 2004;18:188–196. [Google Scholar]
- 10.West GB, Brown JH, Enquist BJ. A general model for the origin of allometric scaling laws in biology. Science. 1997;276:122–126. doi: 10.1126/science.276.5309.122. [DOI] [PubMed] [Google Scholar]
- 11.Banavar JR, Maritan A, Rinaldo A. Size and form in efficient transportation networks. Nature. 1999;399:130–132. doi: 10.1038/20144. [DOI] [PubMed] [Google Scholar]
- 12.Dodds PS, Rothman DH, Weitz JS. Re-examination of the “3/4-law” of metabolism. J Theor Biol. 2001;209:9–27. doi: 10.1006/jtbi.2000.2238. [DOI] [PubMed] [Google Scholar]
- 13.Banavar JR, Damuth J, Maritan A, Rinaldo A. Supply-demand balance and metabolic scaling. Proc Natl Acad Sci USA. 2002;99:10506–10509. doi: 10.1073/pnas.162216899. [DOI] [PMC free article] [PubMed] [Google Scholar]
- 14.Savage V, et al. The predominance of quarter-power scaling in biology. Funct Ecol. 2004;18:257–282. [Google Scholar]
- 15.Kozlowski J, Konarzewski M. Is West, Brown and Enquist's model of allometric scaling mathematically correct and biologically relevant? Ecology. 2004;18:283–289. [Google Scholar]
- 16.Frankino WA, Zwaan BJ, Stern DL, Brakefield PM. Natural selection and developmental constraints in the evolution of allometries. Science. 2005;307:718–720. doi: 10.1126/science.1105409. [DOI] [PMC free article] [PubMed] [Google Scholar]
- 17.Etienne R, Apol M, Olff H. Demystifying the West, Brown & Enquist model of the allometry of metabolism. Ecology. 2006;20:394–399. [Google Scholar]
- 18.Hedin LO. Physiology: Plants on a different scale. Nature. 2006;439:399–400. doi: 10.1038/439399a. [DOI] [PubMed] [Google Scholar]
- 19.Reich PB, Tjoelker MG, Machado JL, Oleksyn J. Universal scaling of respiratory metabolism, size and nitrogen in plants. Nature. 2006;439:457–461. doi: 10.1038/nature04282. [DOI] [PubMed] [Google Scholar]
- 20.Price C, Enquist B. Scaling of mass and morphology in plants with minimal branching: An extension of the WBE model. Ecology. 2006;20:11–20. doi: 10.1890/06-1158. [DOI] [PubMed] [Google Scholar]
- 21.Hendriks A. The power of size: A meta-analysis reveals consistency of allometric regressions. Ecol Modell. 2007;205:196–208. [Google Scholar]
- 22.Enquist B, Tiffney B, Niklas K. Metabolic scaling and the evolutionary dynamics of plant size, form, and diversity: Toward a synthesis of ecology, evolution, and paleontology. Int J Plant Sci. 2007;168:729–749. [Google Scholar]
- 23.Apol M, Etienne R, Olff H. Revisiting the evolutionary origin of allometric metabolic scaling in biology. Funct Ecol. 2008;22:1070–1080. [Google Scholar]
- 24.Kolokotrones T, Savage V, Deeds EJ, Fontana W. Curvature in metabolic scaling. Nature. 2010;464:753–756. doi: 10.1038/nature08920. [DOI] [PubMed] [Google Scholar]
- 25.Dodds PS. Optimal form of branching supply and collection networks. Phys Rev Lett. 2010;104:048702. doi: 10.1103/PhysRevLett.104.048702. [DOI] [PubMed] [Google Scholar]
- 26.Savage VM, Deeds EJ, Fontana W. Sizing up allometric scaling theory. PLoS Comput Biol. 2008;4:e1000171. doi: 10.1371/journal.pcbi.1000171. [DOI] [PMC free article] [PubMed] [Google Scholar]
- 27.Stevens P. Patterns in Nature. Boston: Little, Brown; 1974. [Google Scholar]
- 28.White CR, Blackburn TM, Seymour RS. Phylogenetically informed analysis of the allometry of mammalian basal metabolic rate supports neither geometric nor quarter-power scaling. Evolution. 2009;63:2658–2667. doi: 10.1111/j.1558-5646.2009.00747.x. [DOI] [PubMed] [Google Scholar]
- 29.Glazier DS, Glazier D. A unifying explanation for diverse metabolic scaling in animals and plants. Biol Rev Camb Philos Soc. 2010;85:111–138. doi: 10.1111/j.1469-185X.2009.00095.x. [DOI] [PubMed] [Google Scholar]
- 30.Sieg AE, et al. Mammalian metabolic allometry: Do intraspecific variation, phylogeny, and regression models matter? Am Nat. 2009;174:720–733. doi: 10.1086/606023. [DOI] [PubMed] [Google Scholar]
- 31.Holt J, Rhode E, Holt W, Kines H. Geometric similarity of aorta, venae cavae, and certain of their branches in mammals. Am J Physiol Regul Integr Comp Physiol. 1981;241:100–104. doi: 10.1152/ajpregu.1981.241.1.R100. [DOI] [PubMed] [Google Scholar]
- 32.Weibel ER, Bacigalupe LD, Schmitt B, Hoppeler H. Allometric scaling of maximal metabolic rate in mammals: Muscle aerobic capacity as determinant factor. Respir Physiol Neurobiol. 2004;140:115–132. doi: 10.1016/j.resp.2004.01.006. [DOI] [PubMed] [Google Scholar]
- 33.Caro C, Pedley T, Schroter R, Seed W. The Mechanics of Circulation. Oxford: Oxford Univ Press; 1978. [Google Scholar]
- 34.West GB, Brown JH, Enquist BJ. The fourth dimension of life: Fractal geometry and allometric scaling of organisms. Science. 1999;284:1677–1679. doi: 10.1126/science.284.5420.1677. [DOI] [PubMed] [Google Scholar]
- 35.Ginzburg L, Damuth J. The space-lifetime hypothesis: Viewing organisms in four dimensions, literally. Am Nat. 2008;171:125–131. doi: 10.1086/523947. [DOI] [PubMed] [Google Scholar]
- 36.Moses ME, Forrest S, Davis AL, Lodder MA, Brown JH. Scaling theory for information networks. J R Soc Interface. 2008;5:1469–1480. doi: 10.1098/rsif.2008.0091. [DOI] [PMC free article] [PubMed] [Google Scholar]
- 37.Bakoglu HB. Circuits, Interconnections, and Packaging for VLSI. New York: Addison–Wesley; 1990. [Google Scholar]