

Abstract
A sensitive marker for monitoring progression of early Alzheimer’s Disease (AD) would help to develop and test new therapeutic strategies. The present study aimed at investigating brain metabolism changes over time, as potential monitoring marker, in patients with amnestic Mild Cognitive Impairment (aMCI), according to their clinical outcome (converters or non-converters), and in relation to their cognitive decline. Seventeen aMCI patients underwent MRI and 18FDG-PET scans both at inclusion and 18 months later. Baseline and follow-up PET data were corrected for partial volume effects and spatially normalized using MRI data, scaled to the vermis and compared using SPM2. ‘PET-PAC’ maps reflecting metabolic percent annual changes were created for correlation analyses with cognitive decline. In the whole sample, the greatest metabolic decrease concerned the posterior cingulate-precuneus area. Converters had significantly greater metabolic decrease than nonconverters in two ventro-medial prefrontal areas, the subgenual (BA25) and anterior cingulate (BA24/32). PET-PAC in BA25 and BA24/32 combined allowed complete between-group discrimination. BA25 PET-PAC significantly correlated with both cognitive decline and PET-PAC in the hippocampal region and temporal pole, while BA24/32 PET-PAC correlated with posterior cingulate PET-PAC. Finally, the metabolic change in BA8/9/10 was inversely related to that in BA25 and showed relative increase with cognitive decline, suggesting that compensatory processes may occur in this dorso-medial prefrontal region. The observed ventro-medial prefrontal disruption is likely to reflect disconnection from the hippocampus, both indirectly through the cingulum bundle and posterior cingulate cortex for BA24/32, and directly through the uncinate fasciculus for BA25. Altogether, our findings emphasize the potential of 18FDG-PET for monitoring early AD progression.
Keywords: Aged; Aged, 80 and over; Alzheimer Disease; complications; metabolism; psychology; radionuclide imaging; Amnesia; etiology; metabolism; radionuclide imaging; Brain; metabolism; radionuclide imaging; Brain Mapping; methods; Cognition Disorders; etiology; metabolism; radionuclide imaging; Disease Progression; Female; Fluorodeoxyglucose F18; diagnostic use; Follow-Up Studies; Humans; Image Interpretation, Computer-Assisted; methods; Magnetic Resonance Imaging; methods; Male; Middle Aged; Neuropsychological Tests; Positron-Emission Tomography; methods
Keywords: amnestic Mild Cognitive Impairment, 18FDG-PET monitoring, ventro-medial prefrontal cortex, longitudinal study
INTRODUCTION
To develop and test new therapeutic strategies for Alzheimer’s Disease (AD), sensitive markers for monitoring disease progression are urgently needed especially at its earliest stages, when neuropathological damage is still confined.
Positron Emission Tomography with 2-[18F]-Fluoro-2-Deoxy-D-Glucose (18FDG-PET) is exquisitely sensitive to early AD-related brain changes. Significant hypometabolism can be detected in patients with amnestic Mild Cognitive Impairment (aMCI) that best represents the pre-dementia stage of AD Petersen, 2005. The earliest metabolic changes involve the precuneus - posterior cingulate cortex (PCC) and temporo-parietal areas (Salmon et al., 1994; Minoshima et al., 1997; Drzezga et al., 2003; Nestor et al., 2003a; Chételat et al., 2003b; Nestor et al., 2003b; Nestor et al., 2004; Mosconi, 2005; Ishii et al., 2005; Kawachi et al., 2006). By contrast, the frontal cortex appears involved at the dementia stage (Minoshima et al., 1997; Desgranges et al., 1998; Alexander et al., 2002; Herholz et al., 2002), suggesting that metabolic changes should be detectable from aMCI to clinically probable AD.
Nonetheless, little is known about the accuracy of 18FDG-PET to monitor the progression of early AD and only one previous longitudinal 18FDG-PET study in aMCI patients has been published sofar (Drzezga et al., 2003). This study highlighted significantly greater metabolic decreases in the right middle frontal gyrus in those patients who converted to clinically probable AD as compared to non-converters over a one-year follow-up period. However, whilst clinically meaningful, the dichotomous approach used in this study (i.e. comparing rapid converters to non-converters) is limited by the fact that non-converters do include patients who will later progress to AD. A comprehensive approach should also consider all aMCI patients, whether they rapidly convert or not, assessing in a whole sample analysis brain metabolic changes in relation to cognitive decline over time (Chételat et al., 2005a). Indeed, these two approaches would appear as complementary as the former would allow identifying specific changes occurring in aMCI patients while they convert to clinically probable AD while the latter would inform on changes characterizing rapid cognitive decline whatever the clinical outcome at the end of an arbitrary-defined follow-up period.
Our main objective with the present study was therefore to further investigate the brain pattern of metabolic changes over the course of early AD using these two complementary approaches, i.e. comparing converters to non-converters in a standard fashion, but also across the whole sample in relation to cognitive decline, implementing methodology specially designed for this purpose. Furthermore, thanks to supplementary analyses, we aimed at assessing their discriminant accuracy for monitoring the progression to early AD and investigating the mechanisms underlying these metabolic changes.
METHODS
Patients
The present sample partly overlaps with those of our previous publications using baseline PET data (Chételat et al., 2003a; Chételat et al., 2003b; Chételat et al., 2005a; Mevel et al., 2007) or longitudinal magnetic resonance imaging (MRI) data (Chételat et al., 2005b; Chételat et al., 2008), although only those patients with both baseline and follow-up MRI and PET data were included in this study. Briefly, the 17 aMCI patients included here were all recruited through a memory clinic, and all complained of memory impairment. They were right-handed, aged over 55 years and had at least 7 years of education (see Table 1 for demographic and clinical characteristics). They underwent medical, neurological, neuropsychological, and neuroradiological examinations, and were selected according to current criteria of aMCI, i.e. isolated episodic memory deficits (<1.5 SD of the normal mean for age and education), normal performances in other areas of cognition and in global cognition (assessed with MMSE and Mattis scales), and NINCDS-ADRDA criteria for probable AD (McKhann et al., 1984) not met (see Chételat et al., 2005a for details). According to the Declaration of Helsinki, each patient gave written informed consent to participate in the study, which was approved by the regional ethics committee.
Table 1.
Demographic and clinical data of aMCI patients at baseline (t0) and at follow-up (t18).
| aMCI patients | Converters | Non-converters | ||||
|---|---|---|---|---|---|---|
| t0 | t18 | t0 | t18 | t0 | t18 | |
| Number (women/men) | 17 (11/6) | 7 (5/2) | 10 (6/4) | |||
| Follow-up duration (months; mean ± SD) (range) | 17.9 ± 1.0 (17.0 to 20.6) | 17.5 ± 0.91 (17.0 to 18.8) | 18.2 ± 1.1 (17.0 to 20.6) | |||
| Age at t0 (years; mean ± SD) (range) | 71.6 ± 8.9 (55 to 87) | 73.3 ± 4.3 (73 to 80) | 70.4 ± 11.2 (55 to 87) | |||
| Education (years; mean ± SD) (range) | 10.3 ± 3.9 (7 to 17) | 11.0 ± 4.7 (7 to 17) | 9.9 ± 3.6 (7 to 17) | |||
| MMSE (mean ± SD) (range) | 27.5 ± 1.2 (25 to 29) | 25.6 ± 3.9¤ (17 to 30) | 26.7 ± 1.0 (25 to 28) | 24.3 ± 5.1 (17 to 29) | 28.1 ± 1.0 (26 to 29) | 26.6 ± 2.6¤ (23 to 30) |
| MMSE-PAC (mean ± SD) (range) | −4.3 ± 9.1 (−30.0 to 5.3) | −6.9 ± 12.3 (−30.0 to 3.0) | −2.5 ± 6.1 (−9.8 to 5.3) | |||
| Mattis (mean ± SD) (range) | 137.1 ± 4.4 (129 to 144) | 130.5 ± 10.1¤¤ (108 to 142) | 135.7 ± 4.9 (129 to 141) | 121.3 ± 9.5¤¤¤, ** (108 to 137) | 138.1 ± 3.9 (133 to 144) | 136.6 ± 4.3 (128 to 142) |
| Mattis-PAC (mean ± SD) (range) | −3.3 ± 4.8 (−11.8 to 2.9) | −7.1 ± 3.4 (−11.8 to −2.5) | −0.7 ± 3.8 (−7.4 to 2.9) | |||
significant difference between converters and non-converters p<0.01,
significant difference between t0 and t18 p<0.05,
p<0.01,
p<0.001.
Using the same neuropsychological battery as used at inclusion, all aMCI patients were evaluated every 6 months over an 18-month follow-up period to assess whether they met NINCDS-ADRDA criteria of probable AD or not; at the end of the follow-up period, patients were classified as converters or non-converters, respectively. Patients were declared as converters if they had impaired performances (more than 1.5 SD below the normal means according to age and education when available) in at least one of general intellectual function scales as well as in at least two areas of cognition including memory, leading to impaired daily activities as judged by the clinicians from the consultation interviews. Moreover, as an index of cognitive decline, a Mattis - Percent Annual Change (Mattis-PAC) was obtained for each patient. This index was calculated by first modelling a simple linear regression from Mattis scores collected at each neuropsychological evaluation (y=ax+b; where y=Mattis score and x=time from first evaluation). Then, estimated a and b values were used to calculate percent change in Mattis scores over 12 months using the formula: [(12a/b)*100] (Chételat et al., 2005a).
Neuroimaging data acquisition
Within a few days interval at most from inclusion and 18 months later, each patient underwent MRI and 18FDG-PET scans on the same scanners and using the same acquisition parameters. MRI consisted of a set of 128 adjacent axial cuts parallel to the anterior-posterior commissure (AC-PC) line and with slice thickness 1.5 mm and pixel size 1×1 mm, using the SPGR (spin gradient recalled) sequence (TR=10.3 ms; TE=2.1 ms; FOV=24×18 cm; matrix=256×192). PET data were collected using the ECAT Exact HR+ device with isotropic resolution of 4.2×4.2×4.6 mm (FOV=158 mm). A catheter was introduced in a vein of the arm to inject the radiotracer. Following 68Ga transmission scans, three to five mCi of 18FDG were injected as a bolus at time 0, and a 10 min PET data acquisition started at 50 min post-injection period. Sixty-three planes were acquired with septa out (volume acquisition), using a voxel size of 2.2×2.2×2.43 mm (see Chételat et al., 2005a for further details).
PET data processing and analysis
To implement the two complementary analyses described in Introduction, metabolic changes were evaluated, first, directly from baseline and follow-up PET data and comparing changes in converters and non-converters. Second, maps reflecting metabolic percent annual changes, called “PET-PAC” maps in what follows, were generated for each patients and used to assess relationships with cognitive decline as well as for supplementary analyses. The following sections will successively briefly describe the common and specific processing steps for these analyses. Further details and illustration of these processing steps are provided as Supplementary material.
Common processing steps
A first coregistration was performed to place baseline and follow-up MRI and PET data of each patient in the same space. Second, all PET data were voxel-wise corrected for partial volume effects (PVE) using the patient contemporary MRI and the “modified Muller-Gardner” method (Quarantelli et al., 2004). Third, PET data were scaled using a metabolically preserved brain region, namely the cerebellar vermis (Mevel et al., 2007), to control for inter- and intra-individual global variations in PET signal.
Optimal spatial normalization parameters, to be used in the subsequent specific procedures, were estimated from the spatial normalization of MRI data onto a customized aMCI template using optimal Voxel-Based Morphometry (Good et al., 2001) as previously used in our laboratory (Chételat et al., 2005b). Note that a single set of normalization parameters was estimated for each patient so as to normalize baseline and follow-up PET data using the same parameters to avoid bias due to differential spatial normalization.
PET data processing for analyses comparing baseline and follow-up PET
The optimal normalization parameters were applied to baseline and follow-up coregistered, PVE-corrected and scaled PET data resulting from the common processing steps. Spatially normalized PET data were subsequently smoothed using a Gaussian kernel of 10mm, and entered into the following statistical analyses.
First, a ‘Population main effect: 2 cond’s, 1 scan/cond’ (paired t-test) with 2 conditions (baseline and follow-up) was performed to assess the pattern of metabolic evolution in all aMCI patients by comparing baseline to follow-up data (with a 1 −1 contrast). The resulting SPM-T map was projected onto the aMCI whole brain template.
Second, a ‘Multi-group: conditions & covariates’ (repeated measures ANOVA) with 2 groups (converters and non-converters) and 2 conditions (baseline and followup) was performed on the same data to assess the patterns of metabolic evolution in converters and in non-converters separately, by comparing baseline to follow-up data in each group (with a 1 −1 and a 0 0 1 −1 contrast, respectively). Resulting SPM-T maps were projected onto the customized aMCI whole brain template. To highlight areas of greater metabolic decrease in converters as compared to non-converters, between-group comparison of baseline minus follow-up PET data was then performed (through a 1 −1 −1 1 interaction contrast) onto the voxels exhibiting significant metabolic decreases in converters (using the inclusive masking procedure of SPM2).
Clusters showing significant interaction in the above analysis were also used to define Volumes Of Interest (VOIs) for subsequent application onto PET-PAC maps (see below).
PET data processing for analyses with PET-PAC maps
The baseline and follow-up coregistered, PVE-corrected and scaled PET data resulting from the common processing steps were used to create individual PET-PAC maps. These PET-PAC maps represent the voxel-wise calculation of percent metabolic change over the 18-month follow-up period (i.e. the difference between follow-up and baseline scaled PET value divided by baseline PET value × 100) expressed in annual percent change (i.e. multiplied by 12/18). Note that this calculation was performed only onto those voxels common to both baseline and follow-up PET data, identified using a masking procedure. The optimal spatial normalization parameters were then applied to these PET-PAC maps, which were subsequently smoothed using a Gaussian kernel of 10mm.
A ‘Single subjects: covariates only’ analysis was then conducted onto these 17 PET-PAC maps using Mattis-PAC as covariate to assess the relationship between metabolism changes and global cognitive decline. Both positive and negative correlations were assessed.
To perform VOI-based discriminant and correlation supplementary analyses, mean PET-PAC values were extracted from each PET-PAC map in the VOIs defined above, using the ‘binary ROIs analysis’ option of the ‘fMRI-ROI analysis’ SPM2 toolbox.
To assess the accuracy of the metabolic changes in the VOIs for monitoring the progression to AD in converters, a discriminant analysis was performed. Univariate analyses (T-test) of the mean PET-PAC value of each VOI independently were computed, and a multivariate F-statistic based on MANOVA analysis was performed on all VOIs values combined thanks to a Linear Discriminant.
Finally, to highlight the brain networks whose dysfunction or relative preservation may be related to that of each VOI, correlation analyses were then performed by entering the mean PET-PAC value of each VOI as covariate in a ‘Single subjects: covariates only’ voxel-based analysis with PET-PAC maps, assessing both positive and negative correlations, respectively.
All data processing and voxel-based statistical analyses were performed using SPM2 running on MATLAB 6.5. The threshold for significance was set to p(uncorrected)<0.005, which is identical (Alexander et al., 2002) or more severe (Drzezga et al., 2003) than previously used in longitudinal PET studies in AD and judged to provide the best compromise, neither too permissive nor over-conservative with risk of type 2 errors.
RESULTS
Clinical data
Baseline and follow-up clinical characteristics are presented in Table 1. Over the 18 months follow-up period, 7 of the 17 aMCI patients converted to clinical diagnosis of probable AD. Baseline MMSE scores and follow-up Mattis scores were lower in converters than in non-converters. As already reported (Chételat et al., 2005a), the Mattis scores significantly decreased over the follow-up period in converters, but not in non-converters.
Comparison between baseline and follow-up PET
The patterns of metabolic changes from baseline to follow-up in the whole aMCI sample, and in converters and non-converters separately, are illustrated in Figure 1. In the whole aMCI sample, metabolic decreases were largely bilateral and involved medially the PCC and frontal areas (Brodman areas BA 11 and 24/32), and laterally the temporo-parietal cortex (with right predominance), insula and inferior temporal cortex. Assessing converters and non-converters separately, effects were similar but higher in the former and lower in the latter, a difference that was particularly prominent in ventro-medial prefrontal regions (BA25 and 24/32). Also, the PCC changes observed in the whole sample extended to the middle cingulate cortex in converters.
Figure 1.

Patterns of brain metabolic changes over 18 months in the whole aMCI sample (A), as well as in non-converters (B) and in converters (C) separately, as illustrated by projection of the SPM-T maps onto a 3D representation of the aMCI customized whole brain template.
The repeated measures ANOVA comparing converters to non-converters revealed areas of significantly greater metabolism decrease in converters than nonconverters, but not in the reverse contrast. These changes were located in two distinct ventro-medial prefrontal regions: the left anterior cingulate cortex (BA24/32) and the subgenual area (BA25; Figure 2A). As described above, these two clusters were then made into VOIs for the correlation and discriminant analyses.
Figure 2.

Brain areas showing significantly greater metabolic decreases in converters compared to non-converters (A-left), used as VOIs represented onto 3D views of the aMCI whole brain template in further analyses (A-right), and significant positive correlation between metabolic decrease (PET-PAC maps) and global cognitive decline (Mattis-PAC – B) as illustrated by SPM-2 ‘Glass brain’ representation and projection of the SPM-T maps (thresholded at p<0.005; k>50 voxels) onto sagittal sections of the aMCI whole brain template. Peak MNI coordinates (xyz), size in voxels (k), and T and P values are indicated for each significant cluster, and correlation plot and R2 values are also provided.
PET-PAC maps
Positive correlation between PET-PAC maps and Mattis-PAC revealed a single significant cluster located in the subgenual area (BA25; Figure 2B). The reverse contrast (i.e. PET-PAC increases with Mattis-PAC decreases) disclosed a single cluster located in the right dorso-medial prefrontal cortex (BA9/10; Figure 3A).
Figure 3.

Brain areas showing significant negative correlation between PET-PAC maps and Mattis-PAC (A) or BA25 PET-PAC value (B) as illustrated by SPM-2 ‘Glass brain’ representations and projection of the SPM-T maps (thresholded at p<0.005; k>100 voxels) onto sagittal section of the aMCI whole brain template. Peak MNI coordinates (xyz), size in voxels (k), and T and P values are indicated for each significant cluster and the corresponding plots and R2 values are also provided.
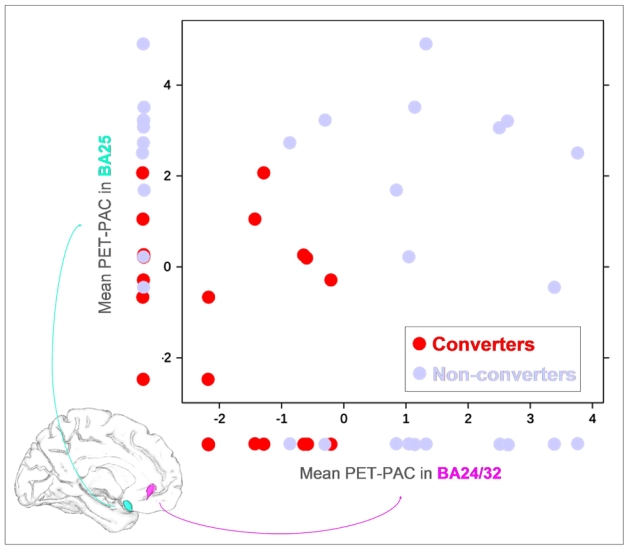
While a partial overlap was observed between individual values of converters and non-converters using the mean PET-PAC in BA24/32 (p=0.001; AUC=0.94) or in BA25 (p=0.006; AUC=0.87) separately, the combination of the mean PET-PAC in these two VOIs improved the between-group discrimination (p=0.0001; AUC=1; Figure 4).
Figure 4.

Illustration of the discriminant accuracy of the mean PET-PAC values in BA24/32 and BA25 separately, and of both values combined (2D representation) to separate converters from nonconverters.
Positive correlation between BA24/32 mean PET-PAC value and PET-PAC maps highlighted surrounding medial prefrontal areas (BA24/32/11) as well as the right PCC including the retrosplenial cortex (BA23/26/29; Figure 5). The reverse contrast did not reveal any significant negative correlation.
Figure 5. VOI-based correlation analysis.
Brain areas showing significant positive correlation between PET-PAC maps and PET-PAC values in BA25 (left), and BA24/32 (right), as illustrated in SPM-2 ‘Glass brain’ representations and projection of the SPM-T maps (thresholded at p<0.005; k>100 voxels) onto sagittal sections of the aMCI whole brain template. Peak and sub-peak MNI coordinates (xyz), size in voxels (k), and T and P values are indicated for each significant cluster and the corresponding plots and R2 values are also provided. Hcp: hippocampus.
Positive correlation between BA25 mean PET-PAC value and PET-PAC maps revealed two clusters, the first encompassing surrounding prefrontal areas (BA25/24) and right hippocampus and amygdala, and the second involving the left parahippocampal cortex (BA20; Figure 5). The reverse contrast (negative correlation) highlighted two close clusters in the right dorso-medial prefrontal cortex (BA8 and BA9; Figure 3B).
DISCUSSION
In the present study, we used a method specifically designed for the longitudinal assessment of PET changes, including voxel-based PVE correction and optimal normalization of each pair of PET data with the same parameters, as well as PET-PAC maps calculation restricted to common GM voxels. This method prevents as far as possible any confounding effects of brain tissue atrophy or methodological bias due to differential normalization and segmentation of baseline and follow-up data. The effects highlighted here are thus thought to reflect genuine metabolic changes taking place during the transition from aMCI to AD.
In the whole aMCI sample, we found progressive metabolic decreases over an 18-month follow-up period encompassing the temporo-parietal cortex and posterior medial parietal areas, consistent with numerous previous studies underlining the early involvement of these areas in AD (see Introduction). Our results also disclosed significant changes in specific prefrontal areas, suggesting that prefrontal metabolic alteration are in fact initiated early in the course of AD. Most notably, the metabolic declines found to be significantly greater in converters relative to non-converters specifically and uniquely pointed to two medial prefrontal areas, namely the anterior cingulate cortex (BA24/32) and the subgenual area (BA25). A similar analysis also pointed to prefrontal areas in Drzezga et al. study (2003), but involved lateral prefrontal rather than medial regions. In that study, the medial prefrontal areas were found to show similar decreases in converters and nonconverters which was interpreted as reflecting a normal aging process. Our findings disagree with this interpretation as the two groups did not differ in age or follow-up duration, and furthermore the metabolic changes in both medial prefrontal areas were found not to correlate with age (data not shown). In contradiction with Drzezga et al. (2003), therefore, the present study argues in favour of AD-related pathological processes in these two regions. In support of this contention, the same two medial prefrontal regions have been previously reported to show specific perfusion decreases from the entorhinal to the limbic neuropathologic Braak stages (Braak and Braak, 1991), corresponding respectively to aMCI and early AD (Bradley et al., 2002).
For reasons detailed in Introduction, we also assessed metabolic changes in relation to global cognitive decline across the whole aMCI sample. Positive correlation between PET-PAC maps and Mattis-PAC highlighted a single ventromedial prefrontal area encompassing the same BA25 region as that found in the between-group comparison, but surprisingly failed to highlight the BA24/32 cluster. As previously proposed (Chételat et al., 2005a), patients expected to present with probable AD criteria at the end of the follow-up period (converters) include both patients with rapid cognitive decline, and patients with less rapid cognitive decline but who started from lower baseline cognitive status. Our findings thus suggest that the metabolic decrease in BA25 is specifically related to the slope of cognitive decline, while that in BA24/32 may instead be related to baseline cognitive performance. Consistent with this hypothesis, we found a significant positive correlation between baseline MMSE performances and BA24/32 PET-PAC values (p=0.0006; data not shown), while no significant correlation was found with BA25 PET-PAC values (p=0.209; data not shown). Overall, these two regions thus appear to serve complementary roles in expressing the metabolic decreases from aMCI to AD. This was also supported by our multivariate analysis showing improved discrimination between converters and non-converters when combining both BA25 and BA24/32 as compared to either VOI separately. While the complete discrimination found here would need to be validated from an independent and larger sample, our results strongly support the use of 18FDG-PET to monitor early AD progression.
So as to better understand the mechanisms underlying these metabolic changes, we also performed metabolic-metabolic correlations between PET-PAC in each VOI and whole brain PET-PAC maps, allowing unravelling the whole brain networks whose metabolic changes relate to those in each of the two prefrontal VOIs (i.e. BA24/32 and BA25). Interestingly, these analyses highlighted two distinct networks for BA24/32 and BA25, the former involving the PCC and the latter the hippocampal region and temporal pole. These distinct relationships suggest that the medial prefrontal metabolic decreases characterizing the progression from aMCI to clinically probable AD may result from disconnection from limbic structures, i.e. from the PCC for BA24/32 and from the hippocampus for BA25. This so-called diaschisis hypothesis (Minoshima et al., 1997; Meguro et al., 2001; Bradley et al., 2002; Chételat et al., 2003b; Nestor et al., 2004) is consistent with recent functional MRI studies of functional connectivity showing, through a method similar to the correlation approach used here, altered hippocampal functional connectivity with the PCC and ventro-medial prefrontal cortex in early AD (Greicius et al., 2004; Wang et al., 2007; Allen et al., 2007). As the uncinate fasciculus directly connects the hippocampus, amygdala and temporal poles to the subgenual cortex (Kier et al., 2004; Schmahmann et al., 2007), disruption of this WM tract may lead to the specific relationships found here. Furthermore, alteration of this tract has been reported in AD (Taoka et al., 2006; Yasmin et al., 2008), and direct hippocampal projection fibers to BA25 were shown to mainly originate from the CA1 subfield (Zhong et al., 2006), i.e. the hippocampal subregion most involved by atrophic processes from aMCI to clinically probable AD (Chételat et al., 2008). The progressive metabolic decrease in BA25 is thus thought to directly reflect its disconnection from the hippocampus. In contrast, disruption of the rostral cingulum bundle relating the PCC to the frontal cortex (Mufson and Pandya, 1984; Schmahmann et al., 2007; Mori et al., 2008) is probably responsible for the metabolic decrease observed in BA24/32. The caudal part of this tract, which connects the hippocampus to the PCC, is also altered early in AD (Rose et al., 2000; Xie et al., 2005; Medina et al., 2006; Villain et al., 2008) probably accounting for early PCC hypometabolism (Rose et al., 2000; Chételat et al., 2003b; Nestor et al., 2004; Xie et al., 2005; Villain et al., 2008). Our findings suggest that, as aMCI progress to AD, PCC alterations progressively lead to medial prefrontal disruption through involvement of the rostral part of the cingulum bundle. Overall, therefore, BA24/32 metabolic decreases may reflect indirect hippocampofrontal disconnection processes, as already mentioned elsewhere (Grady et al., 2001; Bradley et al., 2002; Villain et al., 2008) probably mediated by the cingulum bundle which is the major path for fronto-hippocampal connectivity (Kobayashi and Amaral, 2003).
Intriguingly, most structures highlighted in the present study, namely the hippocampus, amygdala, PCC and medial prefrontal cortex, are key components of the episodic memory network (Cabeza and Nyberg, 2000). The role of the uncinate fasciculus and cingulum bundle in memory processes has also been highlighted (Levine et al., 1998; Gaffan and Wilson, 2008; Sepulcre et al., 2008), more specifically for autobiographical memory related to emotional events (Markowitsch et al., 2003). In addition, dysfunction in ventro-medial prefrontal areas has been related to depressive symptoms in healthy subjects (Steele et al., 2007) and apathy in AD (Marshall et al., 2007). Taken together, disruption of the brain networks leading to progressive decrease in ventro-medial prefrontal metabolism may underlie the worsening of memory impairments as well as the emergence of mood disorders reported as aMCI progresses to clinical AD (Assal and Cummings, 2002).
Finally negative correlations between PET-PAC maps and Mattis-PAC as well as BA25 PET-PAC, both highlighted a single and identical dorso-medial prefrontal region encroaching BA8/9/10. This suggests that, as the disease progresses and BA25 metabolism decreases, BA8/9/10 metabolism relatively increases, potentially reflecting functional compensatory mechanism, as proposed in previous studies for the same dorso-medial prefrontal areas (Grady et al., 2001; Grady et al., 2003; Remy et al., 2005; Wang et al., 2007). The striking difference between metabolic changes taking place in ventro-medial and dorso-medial prefrontal regions, both known to be connected to the hippocampus (Schmahmann et al., 2007) but showing either relative metabolic decreases or increases respectively, would merit further investigations.
In sum, our findings highlight the specific metabolic changes associated with progression from aMCI to clinical AD, showing metabolic decrease in ventro-medial prefrontal BA24/32 and BA25 paralleled by relative increases in dorso-medial BA8/9/10. Prefrontal metabolic disruptions are likely to reflect disconnection from the hippocampus, both indirectly through the posterior cingulate cortex via cingulum bundle breakdown for BA24/32, and directly through uncinate fasciculus disruption for BA25. Metabolic decreases in these two areas combined specifically characterized rapid progression to AD, suggesting the potential of 18FDG-PET to monitor early AD progression and to test the effects of new therapies.
Supplementary Material
Acknowledgments
Funding
This work was supported by the Institut National de la Santé Et de la Recherche Médicale U320 and U923, Ministère de la Santé (Programme Hospitalier de Reherche Clinique, Principal Investigator: J-C Baron), Ministère de l’éducation nationale, Association France-Alzheimer, Institut de Recherches Internationales Servier and Conseil Régional de Basse-Normandie.
We are indebted to Ms. C. Lalevée, Ms. A. Pélerin, D. Hannequin, B. Dupuy, M.H. Noël, M.C. Onfroy, D. Luet, O. Tirel, and L. Barré for their help in this study.
References
- Alexander GE, Chen K, Pietrini P, Rapoport SI, Reiman EM. Longitudinal PET Evaluation of Cerebral Metabolic Decline in Dementia: A Potential Outcome Measure in Alzheimer’s Disease Treatment Studies. Am J Psychiatry. 2002;159:738–745. doi: 10.1176/appi.ajp.159.5.738. [DOI] [PubMed] [Google Scholar]
- Allen G, Barnard H, McColl R, Hester AL, Fields JA, Weiner MF, et al. Reduced hippocampal functional connectivity in Alzheimer disease. Arch Neurol. 2007;64:1482–1487. doi: 10.1001/archneur.64.10.1482. [DOI] [PubMed] [Google Scholar]
- Assal F, Cummings JL. Neuropsychiatric symptoms in the dementias. Curr Opin Neurol. 2002;15:445–450. doi: 10.1097/00019052-200208000-00007. [DOI] [PubMed] [Google Scholar]
- Braak H, Braak E. Neuropathological stageing of Alzheimer-related changes. Acta Neuropathol. 1991;82:239–259. doi: 10.1007/BF00308809. [DOI] [PubMed] [Google Scholar]
- Bradley KM, O’Sullivan VT, Soper ND, Nagy Z, King EM, Smith AD, et al. Cerebral perfusion SPET correlated with Braak pathological stage in Alzheimer’s disease. Brain. 2002;125:1772–1781. doi: 10.1093/brain/awf185. [DOI] [PubMed] [Google Scholar]
- Cabeza R, Nyberg L. Imaging cognition II: An empirical review of 275 PET and fMRI studies. J Cogn Neurosci. 2000;12:1–47. doi: 10.1162/08989290051137585. [DOI] [PubMed] [Google Scholar]
- Chételat G, Desgranges B, de la Sayette V, Viader F, Berkouk K, Landeau B, et al. Dissociating atrophy and hypometabolism impact on episodic memory in mild cognitive impairment. Brain. 2003a;126:1955–1967. doi: 10.1093/brain/awg196. [DOI] [PubMed] [Google Scholar]
- Chételat G, Desgranges B, de la Sayette V, Viader F, Eustache F, Baron JC. Mild cognitive impairment: Can FDG-PET predict who is to rapidly convert to Alzheimer’s disease? Neurology. 2003b;60:1374–1377. doi: 10.1212/01.wnl.0000055847.17752.e6. [DOI] [PubMed] [Google Scholar]
- Chételat G, Eustache F, Viader F, de la Sayette V, Pélerin A, Mézenge F, et al. FDGPET measurement is more accurate than neuropsychological assessments to predict global cognitive deterioration in patients with mild cognitive impairment. Neurocase. 2005a;11:14–25. doi: 10.1080/13554790490896938. [DOI] [PubMed] [Google Scholar]
- Chételat G, Fouquet M, Kalpouzos G, Denghien I, de la Sayette V, Viader F, et al. Three-dimensional surface mapping of hippocampal atrophy progression from MCI to AD and over normal aging as assessed using voxel-based morphometry. Neuropsychologia. 2008;46:1721–1731. doi: 10.1016/j.neuropsychologia.2007.11.037. [DOI] [PubMed] [Google Scholar]
- Chételat G, Landeau B, Eustache F, Mézenge F, Viader F, de la Sayette V, et al. Using voxel-based morphometry to map the structural changes associated with rapid conversion in MCI: a longitudinal MRI study. Neuroimage. 2005b;27:934–946. doi: 10.1016/j.neuroimage.2005.05.015. [DOI] [PubMed] [Google Scholar]
- Desgranges B, Baron JC, de la Sayette V, Petit-Taboué MC, Benali K, Landeau B, et al. The neural substrates of memory systems impairment in Alzheimer’s disease. A PET study of resting brain glucose utilization. Brain. 1998;121 (Pt 4):611–631. doi: 10.1093/brain/121.4.611. [DOI] [PubMed] [Google Scholar]
- Drzezga A, Lautenschlager N, Siebner H, Riemenschneider M, Willoch F, Minoshima S, et al. Cerebral metabolic changes accompanying conversion of mild cognitive impairment into Alzheimer’s disease: a PET follow-up study. Eur J Nucl Med Mol Imaging. 2003;30:1104–1113. doi: 10.1007/s00259-003-1194-1. [DOI] [PubMed] [Google Scholar]
- Gaffan D, Wilson CR. Medial temporal and prefrontal function: Recent behavioural disconnection studies in the macaque monkey. Cortex. 2008;44:928–935. doi: 10.1016/j.cortex.2008.03.005. [DOI] [PubMed] [Google Scholar]
- Good CD, Johnsrude IS, Ashburner J, Henson RN, Friston KJ, Frackowiak RS. A voxel-based morphometric study of ageing in 465 normal adult human brains. Neuroimage. 2001;14:21–36. doi: 10.1006/nimg.2001.0786. [DOI] [PubMed] [Google Scholar]
- Grady CL, Furey ML, Pietrini P, Horwitz B, Rapoport SI. Altered brain functional connectivity and impaired short-term memory in Alzheimer’s disease. Brain. 2001;124:739–756. doi: 10.1093/brain/124.4.739. [DOI] [PubMed] [Google Scholar]
- Grady CL, Mcintosh AR, Beig S, Keightley ML, Burian H, Black SE. Evidence from functional neuroimaging of a compensatory prefrontal network in Alzheimer’s disease. J Neurosci. 2003;23:986–993. doi: 10.1523/JNEUROSCI.23-03-00986.2003. [DOI] [PMC free article] [PubMed] [Google Scholar]
- Greicius MD, Srivastava G, Reiss AL, Menon V. Default-mode network activity distinguishes Alzheimer’s disease from healthy aging: evidence from functional MRI. Proc Natl Acad Sci U S A. 2004;101:4637–4642. doi: 10.1073/pnas.0308627101. [DOI] [PMC free article] [PubMed] [Google Scholar]
- Herholz K, Schopphoff H, Schmidt M, Mielke R, Eschner W, Scheidhauer K, et al. Direct comparison of spatially normalized PET and SPECT scans in Alzheimer’s disease. J Nucl Med. 2002;43:21–26. [PubMed] [Google Scholar]
- Ishii K, Sasaki H, Kono AK, Miyamoto N, Fukuda T, Mori E. Comparison of gray matter and metabolic reduction in mild Alzheimer’s disease using FDG-PET and voxel-based morphometric MR studies. Eur J Nucl Med Mol Imaging. 2005;32:959–963. doi: 10.1007/s00259-004-1740-5. [DOI] [PubMed] [Google Scholar]
- Kawachi T, Ishii K, Sakamoto S, Sasaki M, Mori T, Yamashita F, et al. Comparison of the diagnostic performance of FDG-PET and VBM-MRI in very mild Alzheimer’s disease. Eur J Nucl Med Mol Imaging. 2006;33:801–809. doi: 10.1007/s00259-005-0050-x. [DOI] [PubMed] [Google Scholar]
- Kier EL, Staib LH, Davis LM, Bronen RA. MR imaging of the temporal stem: anatomic dissection tractography of the uncinate fasciculus, inferior occipitofrontal fasciculus, and Meyer’s loop of the optic radiation. AJNR Am J Neuroradiol. 2004;25:677–691. [PMC free article] [PubMed] [Google Scholar]
- Kobayashi Y, Amaral DG. Macaque monkey retrosplenial cortex: II. Cortical afferents. J Comp Neurol. 2003;466:48–79. doi: 10.1002/cne.10883. [DOI] [PubMed] [Google Scholar]
- Levine B, Black SE, Cabeza R, Sinden M, Mcintosh AR, Toth JP, et al. Episodic memory and the self in a case of isolated retrograde amnesia. Brain. 1998;121 ( Pt 10):1951–1973. doi: 10.1093/brain/121.10.1951. [DOI] [PubMed] [Google Scholar]
- Markowitsch HJ, Vandekerckhove MM, Lanfermann H, Russ MO. Engagement of lateral and medial prefrontal areas in the ecphory of sad and happy autobiographical memories. Cortex. 2003;39:643–665. doi: 10.1016/s0010-9452(08)70858-x. [DOI] [PubMed] [Google Scholar]
- Marshall GA, Monserratt L, Harwood D, Mandelkern M, Cummings JL, Sultzer DL. Positron emission tomography metabolic correlates of apathy in Alzheimer disease. Arch Neurol. 2007;64:1015–1020. doi: 10.1001/archneur.64.7.1015. [DOI] [PubMed] [Google Scholar]
- McKhann G, Drachman D, Folstein M, Katzman R, Price D, Stadlan EM. Clinical diagnosis of Alzheimer’s disease: report of the NINCDS-ADRDA Work Group under the auspices of Department of Health and Human Services Task Force on Alzheimer’s Disease. Neurology. 1984;34:939–944. doi: 10.1212/wnl.34.7.939. [DOI] [PubMed] [Google Scholar]
- Medina D, DeToledo-Morrell L, Urresta F, Gabrieli JD, Moseley M, Fleischman D, et al. White matter changes in mild cognitive impairment and AD: A diffusion tensor imaging study. Neurobiol Aging. 2006;27:663–672. doi: 10.1016/j.neurobiolaging.2005.03.026. [DOI] [PubMed] [Google Scholar]
- Meguro K, LeMestric C, Landeau B, Desgranges B, Eustache F, Baron JC. Relations between hypometabolism in the posterior association neocortex and hippocampal atrophy in Alzheimer’s disease: a PET/MRI correlative study. J Neurol Neurosurg Psychiatry. 2001;71:315–321. doi: 10.1136/jnnp.71.3.315. [DOI] [PMC free article] [PubMed] [Google Scholar]
- Mevel K, Desgranges B, Baron JC, Landeau B, de la Sayette V, Viader F, et al. Detecting hippocampal hypometabolism in Mild Cognitive Impairment using automatic voxel-based approaches. Neuroimage. 2007;37:18–25. doi: 10.1016/j.neuroimage.2007.04.048. [DOI] [PubMed] [Google Scholar]
- Minoshima S, Giordani B, Berent S, Frey KA, Foster NL, Kuhl DE. Metabolic reduction in the posterior cingulate cortex in very early Alzheimer’s disease. Ann Neurol. 1997;42:85–94. doi: 10.1002/ana.410420114. [DOI] [PubMed] [Google Scholar]
- Mori S, Wakana S, Nagae-Poetscher L, van Zilj P. MRI atlas of human white matter. Amsterdam: Elsevier; 2008. [DOI] [PubMed] [Google Scholar]
- Mosconi L. Brain glucose metabolism in the early and specific diagnosis of Alzheimer’s disease. FDG-PET studies in MCI and AD. Eur J Nucl Med Mol Imaging. 2005;32:486–510. doi: 10.1007/s00259-005-1762-7. [DOI] [PubMed] [Google Scholar]
- Mufson EJ, Pandya DN. Some observations on the course and composition of the cingulum bundle in the rhesus monkey. J Comp Neurol. 1984;225:31–43. doi: 10.1002/cne.902250105. [DOI] [PubMed] [Google Scholar]
- Nestor PJ, Fryer TD, Ikeda M, Hodges JR. Retrosplenial cortex (BA 29/30) hypometabolism in mild cognitive impairment (prodromal Alzheimer’s disease) Eur J Neurosci. 2003a;18:2663–2667. doi: 10.1046/j.1460-9568.2003.02999.x. [DOI] [PubMed] [Google Scholar]
- Nestor PJ, Fryer TD, Smielewski P, Hodges JR. Limbic hypometabolism in Alzheimer’s disease and mild cognitive impairment. Ann Neurol. 2003b;54:343–351. doi: 10.1002/ana.10669. [DOI] [PubMed] [Google Scholar]
- Nestor PJ, Scheltens P, Hodges JR. Advances in the early detection of Alzheimer’s disease. Nat Med. 2004;10 (Suppl):S34–S41. doi: 10.1038/nrn1433. [DOI] [PubMed] [Google Scholar]
- Petersen RC. Mild Cognitive Impairment: Useful or not? Alzheimer’s & Dementia. 2005;1:5–10. doi: 10.1016/j.jalz.2005.06.013. [DOI] [PubMed] [Google Scholar]
- Quarantelli M, Berkouk K, Prinster A, Landeau B, Svarer C, Balkay L, et al. Integrated software for the analysis of brain PET/SPECT studies with partial-volumeeffect correction. J Nucl Med. 2004;45:192–201. [PubMed] [Google Scholar]
- Remy F, Mirrashed F, Campbell B, Richter W. Verbal episodic memory impairment in Alzheimer’s disease: a combined structural and functional MRI study. Neuroimage. 2005;25:253–266. doi: 10.1016/j.neuroimage.2004.10.045. [DOI] [PubMed] [Google Scholar]
- Rose SE, Chen F, Chalk JB, Zelaya FO, Strugnell WE, Benson M, et al. Loss of connectivity in Alzheimer’s disease: an evaluation of white matter tract integrity with colour coded MR diffusion tensor imaging. J Neurol Neurosurg Psychiatry. 2000;69:528–530. doi: 10.1136/jnnp.69.4.528. [DOI] [PMC free article] [PubMed] [Google Scholar]
- Salmon E, Sadzot B, Maquet P, Degueldre C, Lemaire C, Rigo P, et al. Differential diagnosis of Alzheimer’s disease with PET. J Nucl Med. 1994;35:391–398. [PubMed] [Google Scholar]
- Schmahmann JD, Pandya DN, Wang R, Dai G, D’Arceuil HE, de Crespigny AJ, et al. Association fibre pathways of the brain: parallel observations from diffusion spectrum imaging and autoradiography. Brain. 2007;130:630–653. doi: 10.1093/brain/awl359. [DOI] [PubMed] [Google Scholar]
- Sepulcre J, Masdeu JC, Sastre-Garriga J, Goni J, Velez-de-Mendizabal N, Duque B, et al. Mapping the brain pathways of declarative verbal memory: Evidence from white matter lesions in the living human brain. Neuroimage. 2008;42:1237–1243. doi: 10.1016/j.neuroimage.2008.05.038. [DOI] [PubMed] [Google Scholar]
- Steele JD, Currie J, Lawrie SM, Reid I. Prefrontal cortical functional abnormality in major depressive disorder: a stereotactic meta-analysis. J Affect Disord. 2007;101:1–11. doi: 10.1016/j.jad.2006.11.009. [DOI] [PubMed] [Google Scholar]
- Taoka T, Iwasaki S, Sakamoto M, Nakagawa H, Fukusumi A, Myochin K, et al. Diffusion anisotropy and diffusivity of white matter tracts within the temporal stem in Alzheimer disease: evaluation of the “tract of interest” by diffusion tensor tractography. AJNR Am J Neuroradiol. 2006;27:1040–1045. [PMC free article] [PubMed] [Google Scholar]
- Villain N, Desgranges B, Viader F, de la Sayette V, Mézenge F, Landeau B, et al. Relationships between hippocampal atrophy, white matter disruption, and gray matter hypometabolism in Alzheimer’s disease. J Neurosci. 2008;28:6174–6181. doi: 10.1523/JNEUROSCI.1392-08.2008. [DOI] [PMC free article] [PubMed] [Google Scholar]
- Wang K, Liang M, Wang L, Tian L, Zhang X, Li K, et al. Altered functional connectivity in early Alzheimer’s disease: a resting-state fMRI study. Hum Brain Mapp. 2007;28:967–978. doi: 10.1002/hbm.20324. [DOI] [PMC free article] [PubMed] [Google Scholar]
- Xie S, Xiao JX, Wang YH, Wu HK, Gong GL, Jiang XX. Evaluation of bilateral cingulum with tractography in patients with Alzheimer’s disease. Neuroreport. 2005;16:1275–1278. doi: 10.1097/01.wnr.0000174061.41897.ee. [DOI] [PubMed] [Google Scholar]
- Yasmin H, Nakata Y, Aoki S, Abe O, Sato N, Nemoto K, et al. Diffusion abnormalities of the uncinate fasciculus in Alzheimer’s disease: diffusion tensor tract-specific analysis using a new method to measure the core of the tract. Neuroradiology. 2008;50:293–299. doi: 10.1007/s00234-007-0353-7. [DOI] [PubMed] [Google Scholar]
- Zhong YM, Yukie M, Rockland KS. Distinctive morphology of hippocampal CA1 terminations in orbital and medial frontal cortex in macaque monkeys. Exp Brain Res. 2006;169:549–553. doi: 10.1007/s00221-005-0187-7. [DOI] [PubMed] [Google Scholar]
Associated Data
This section collects any data citations, data availability statements, or supplementary materials included in this article.