Abstract
The normal neonatal canine brain exhibits marked differences from that of the mature brain. With development into adulthood there is a decrease in relative water content and progressive myelination; these changes are observable with magnetic resonance (MR) imaging and are characterized by a repeatable and predictable time course. We characterized these developmental changes on common MR imaging sequences and identified clinically useful milestones of transition. To accomplish this, 17 normal dogs underwent MR imaging of the brain at various times after birth from 1 to 36 weeks. Sequences acquired were T1-weighted, T2-weighted, Fluid Attenuated Inversion Recovery, Short Tau Inversion Recovery and Diffusion Weighted Imaging sequences. The images were assessed subjectively for gray and white matter relative signal intensity and results correlated with histologic findings. The development of the neonatal canine brain follows a pattern that qualitatively matches that observed in humans, and which can be characterized adequately on T1-weighted and T2-weighted images. At birth, the relative gray matter to white matter signal intensity of the cortex is reversed from that of the adult with an isointense transition at 3–4 weeks on T1-weighted and 4–8 weeks on T2-weighted images. This is followed by the expected mature gray matter to white matter relative intensity that undergoes continued development to a mostly adult appearance by 16 weeks. On the Fluid Attenuated Inversion Recovery sequence the cortical gray and white matter exhibit an additional signal intensity reversal during the juvenile period that is due to the initial high relative water content at the subcortical white matter, with its marked T1 relaxation effect.
Introduction
The brain of altricial mammals, such as primates, dogs, cats and rats, is incompletely developed at birth.1–5 This is in contrast to that of precocial mammals, such as the horse, which exhibit a more mature appearance shortly after birth.6, 7 A major feature of postnatal brain maturation is continuation of neuronal myelination that began in utero. The development of the postnatal brain, and particularly the progressive myelination of the cerebral white matter as observed with magnetic resonance (MR) imaging, and correlated with histologic observations, is thoroughly described in humans, and this database is used routinely as a normal reference when evaluating abnormal neonates.8, 9 For the dog, there are few similar data, and what is available is not in a form suitable for use as a reference during evaluation of clinical cases.4, 7 The purpose of this report is to describe the qualitative changes observed with various MR imaging sequences during normal canine brain maturation and to identify clinically useful milestones for the transition from juvenile to mature patterns of cerebral gray and white matter relative signal intensity.
Materials & Methods
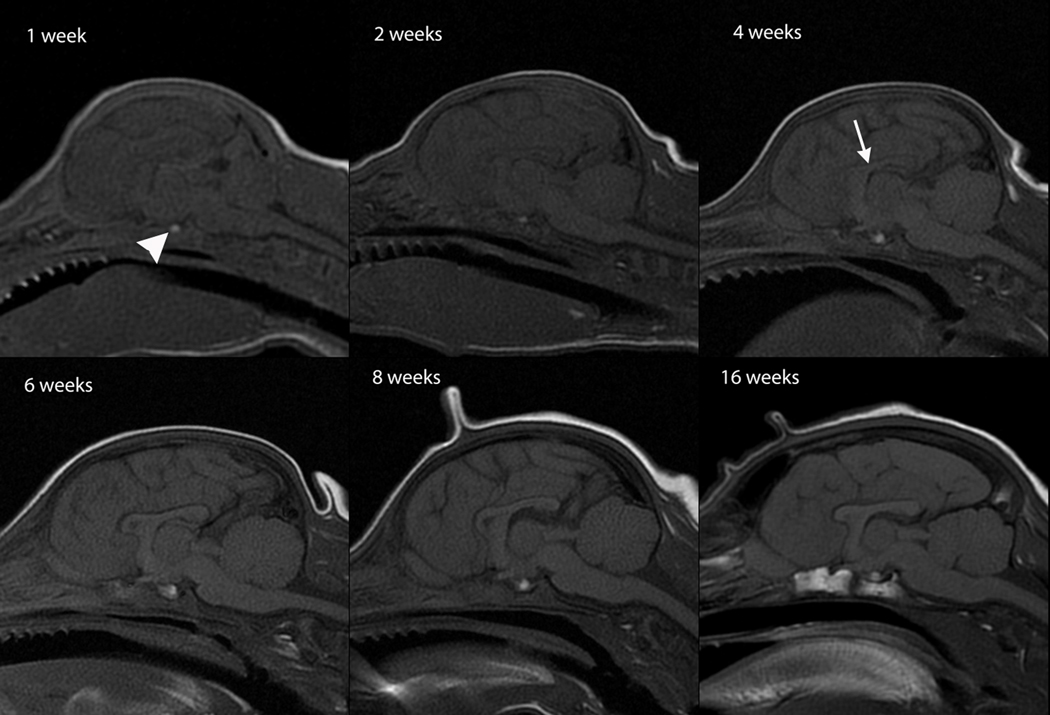
MR brain images of 17 sexually intact dogs, born naturally following normal gestation and parturition, were acquired at various times after birth. Gestation varied from 60 to 64 days, with no special consideration given to this variation when evaluating the images. The dogs used for this report originated from a breeding colony of individuals genetically affected with one of several forms of mucopolysaccharidosis (MPS); MPS-I, MPS-IIIB or MPS-VII. These MPS variants are autosomal recessive disorders and the individuals used for this brain maturation study underwent DNA testing prior to imaging to confirm they were genetically normal or were a carrier of only one allele.10–13 The colony consists of mixed breed dogs that were of predominantly beagle, schipperke and hound lineage with an average adult body weight of approximately 12 to 16 kg. At 1 week the individuals weighed approximately 0.5 kg and at 36 weeks approximately 10 kg. All dogs were assessed as physically, behaviorally and neurologically normal during their development.14, 15
For the MR images of dogs aged one week through eight weeks, anesthesia was induced using isoflurane† gas masking with subsequent intubation and maintenance using isoflurane gas to effect. For dogs greater than eight weeks of age, butorphenol‡ and atropine§ were administered intramuscularly, followed by intravenous propofol‖ with subsequent intubation and maintenance using isoflurane gas.
MR brain images were acquired using a 1.5 Tesla system and 8-channel HR Brain coil*. Each study consisted of nine 2D series: T2-weighted (T2W) dorsal, transverse and sagittal images, T1-weighted (T1W) transverse and sagittal images; T2-weighted Fluid Attenuation Inversion Recovery (FLAIR) transverse images; Short Tau Inversion Recovery (STIR) transverse images and Diffusion Weighted Imaging (DWI) in dorsal and transverse planes (Table 1). Apparent Diffusion Coefficient (ADC) maps were constructed from the DWI data using the proprietary scanner software. There were a total of 35 studies from ages 1 to 36 weeks postnatal (Table 2). The MR images were reviewed by a board certified radiologist and a third-year radiology resident (E.R. and B.G.). Qualitatively, signal intensity of structures being evaluated was referenced against that of cortical gray matter intensity on the same series. In addition, subjective evaluation of structures relative to that observed in adults, based on published reports, a standard anatomic text and from personal experience, was documented.16–18 ADC values were measured on dorsal and transverse plane ADC maps in the subcortical white matter of the left occipital lobe using a 0.145 cm2 region of interest and plotted as a function of age.
Table 1.
MRI Sequence Parameters*
| Series | Sequence | TR (ms) | TE (ms) | TI (ms) | Slice Thickness/ Interslice Gap (mm) |
NEX |
|---|---|---|---|---|---|---|
| T2W transverse |
FRFSE-XL ETL 15 |
3000 | 95–108 | - | 4/0.8 | 4 |
| T2W sagittal |
FRFSE-XL ETL 15 |
3000 | 105–106 | - | 3/0.6 | 4 |
| T2W dorsal | FRFSE-XL ETL 15 |
3000 | 105–108 | - | 3/0.3 | 4 |
| T1W transverse |
SE | 500 | 15 | - | 4/0.8 | 3 |
| T1W sagittal |
SE | 500 | 15 | - | 3/0.6 | 3 |
| FLAIR transverse |
FSE-IR | 8000 | 127–131 | 2000 | 4/0.8 | 2 |
| STIR transverse |
FSE-IR | 3800 | 13–14 | 170 | 4/0.8 | 2 |
| DWI transverse |
DWI-EPI | 8000 | 105–120 | - | 3/0.0 | 1 |
| DWI dorsal | DWI-EPI | 8000 | 105–120 | - | 3/0.0 | 1 |
All scans, in all planes and at all ages, were obtained using a 256 × 256 matrix and field of view of 14 cm × 14 cm with the exceptions that DWI acquisitions used a matrix of 128 × 128 and that some sagittal plane sequences were acquired with a FOV of 18 cm × 18 cm. DWI acquired with b-values of 0 s/mm2 and 1,000 s/mm2 in three directions with ADC map generation using the GE Signa Excite 11.0 workstation. T2W: T2-weighted; T1W: T1-weighted; FLAIR: Fluid Attenuated Inversion Recovery; STIR: Short Tau Inversion Recovery; DWI-EPI: Diffusion Weighted Imaging – Echo Planar Imaging; FRFSE-XL: Fast Recovery Fast Spin Echo – Accelerated; SE: Spin Echo; FSE-IR: Fast Spin Echo-Inversion Recovery; ETL: Echo Train Length.
Table 2.
Ages of Individual Dogs at Time of Brain MR Imaging.
| Age at MRI Scan* | ||||||||||
|---|---|---|---|---|---|---|---|---|---|---|
| Dog† | Week 1 | Week 2 | Week 3 | Week 4 | Week 6 | Week 8 | Week 12 | Week 13–20 |
Week 24–36 |
|
| A - f/c | 7 | |||||||||
| B - m/n | 7 | |||||||||
| C - m/n | 8 | |||||||||
| D - f/c | 8 | 15 | 91 & 113 | |||||||
| E - f/c | 14 | |||||||||
| F - m/n | 15 | 28 | 43 | |||||||
| G - f/n | 16 | 23 | ||||||||
| H - m/c | 16 | |||||||||
| I - m/n | 20 | |||||||||
| J - m/c | 21 | 28 | ||||||||
| K - m/c | 23 | |||||||||
| L - f/c | 28 | 42 | 56 | 83 | 95 | 173 & 252 | ||||
| M - m/n | 28 | 43 | 57 | |||||||
| N - f/c | 42 | 56 | 84 | |||||||
| O - m/c | 56 | |||||||||
| P - f/c | 83 | |||||||||
| Q -f/c | 133 | 227 | ||||||||
Ages listed in days postnatal at time of scan; underline indicates brain collected for histopathology following MRI.
Individuals (A through Q) with their gender (f=female, m=male) and mucopolysaccharidosis genetic state (n=normal, c=carrier).
During each time point of weeks 1 through 12, one dog underwent euthanasia immediately following MR imaging, and the brain collected immediately and prepared for histologic evaluation. Each brain was placed in 10% buffered formalin for one week. After fixation each brain was placed in Bouin’s solution for 24 hours to increase tissue firmness. The brain was rinsed with alkaline alcohol and sectioned transversely with the intent being to place the slices in roughly the same locations as the transverse MR images. Brain sections were processed in an automatic tissue processor and embedded in paraffin. Five-micrometer thick sections were obtained and mounted on positively charged glass slides to be stained with Hematoxylin & Eosin and myelin-specific Luxol Fast Blue stains. Microscopic examination was performed by a board certified pathologist (D.G-T.) who was unaware of the MR image appearances. For the microscopic examination, particular attention was given to the appearance and changes in the subcortical white matter, internal capsule and corpus callosum.
Results
At each postnatal age the different individuals exhibited similar signal characteristics on all sequences. The signal intensity of the subcortical white matter was characterized by a signal reversal on all sequences. Initially, the relative intensity of white vs. gray matter was reversed from that observed in the adult. This was followed by a transition phase where the white and gray matter were isointense to each other. Finally there was a transition to the white and gray matter relative signal intensity characteristic of that observed in the adult, with progressive refinement to the appearance of a mature brain. On FLAIR images, the white matter exhibited more signal transitions than in T1W or T2W images, similar to that in human brain but with earlier milestones of transition19; this is described in detail below. On all sequences, signal intensity changed from caudal to rostral at the brainstem, and from central to peripheral at the internal capsule and cerebrum (Table 3).
Table 3.
Sequence-Specific Canine Brain Maturation Milestones
| Sequence | Cortex Juvenile Phase |
Cortex Transition Phase |
Cortex Maturing Phase |
Brainstem & Cerebellum Mature |
Corpus Callosum | |
|---|---|---|---|---|---|---|
| Partial Complete | ||||||
| T1W | 1–3 weeks | 3–4 weeks | 4–16 weeks | 4 weeks | 4 weeks | 6 weeks |
| T2W / STIR | 1–4 weeks | 4–8 weeks | 8–16 weeks | 6 weeks | 6 weeks | 8 weeks |
| FLAIR* | A: 1–3 weeks B: 3–6 weeks |
A: 3 weeks B: 6–12 weeks |
12–36 weeks | 12 weeks | 8 weeks | 12 weeks |
A and B designate the two juvenile subphases observed on FLAIR and their associated transitions. T1W: T1-weighted; T2W: T2-weighted; STIR: Short Tau Inversion Recovery; FLAIR: Fluid Attenuated Inversion Recovery.
The corpus callosum, as a distinct feature, varies in its temporal appearance on various sequences as described below. However, on all sequences, the complete corpus callosum from genu through body and splenium was not distinctly identifiable at 3 weeks or earlier but was clearly distinguishable at 8 weeks and later, and had an adult appearance at 16 weeks.
On T1W, T2W and STIR images, the cerebellum had a mature appearance by approximately 6 weeks, while the cerebrum had a predominantly adult appearance at 16 weeks.
In FLAIR images there was a delay in the appearance of brain maturation compared to other sequences, as described below. There was continued volume expansion and mild refinement of subcortical white matter arborization and border distinction continuing to 36 weeks. A separate observation was that the normal neurohypophyseal focal T1-hyperintensity was recognizable at all ages.20–22
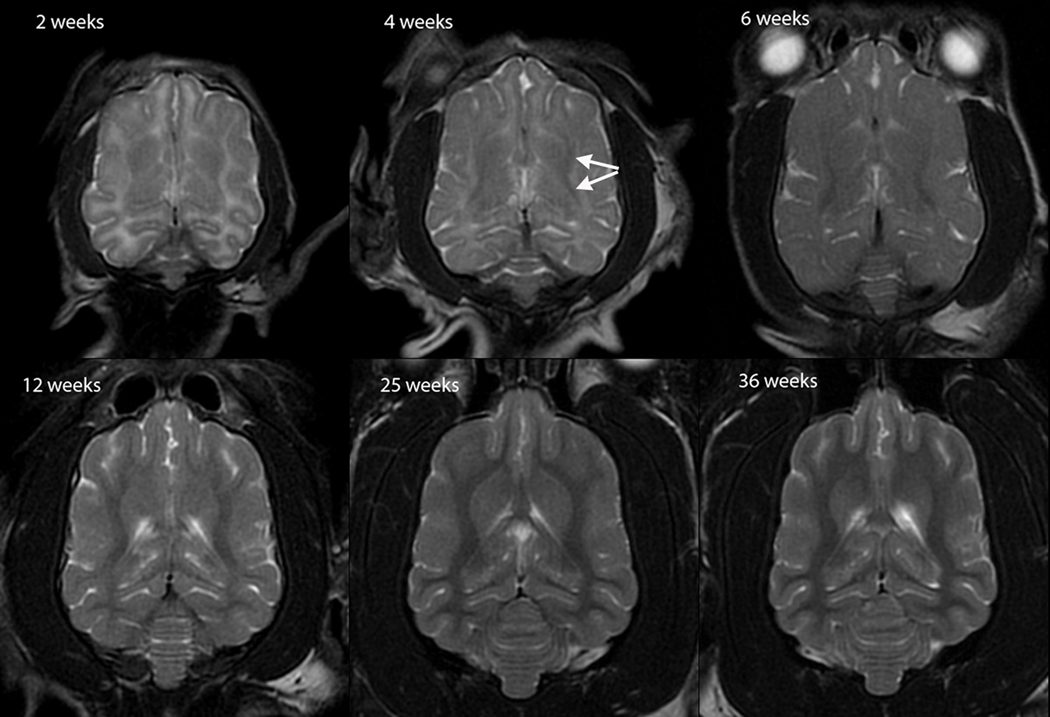
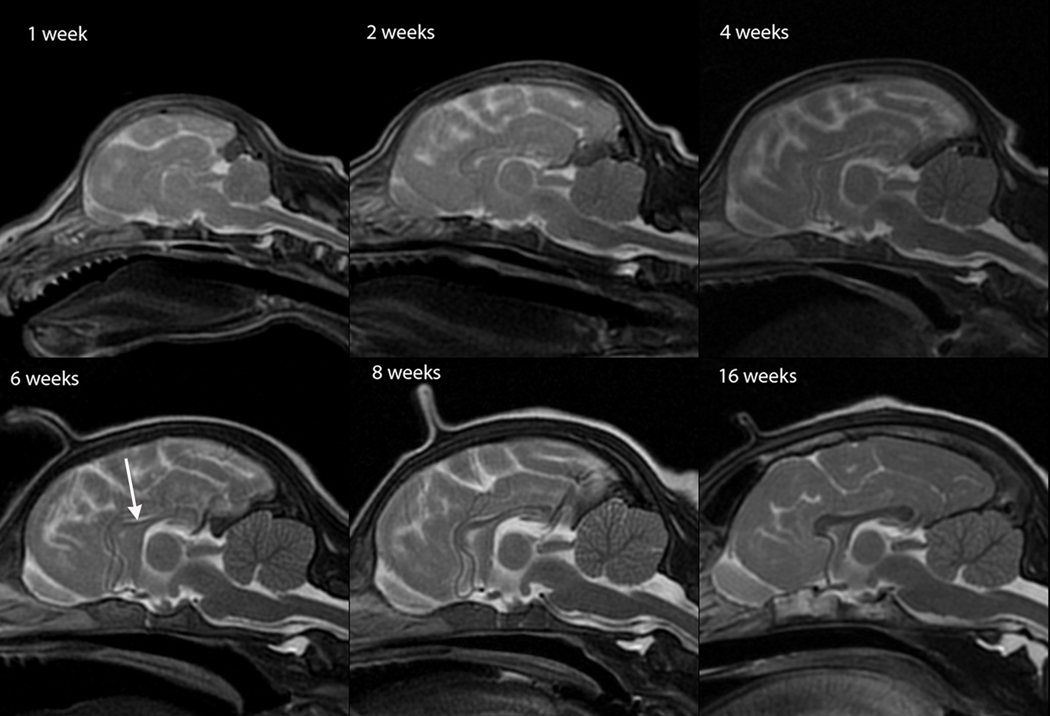
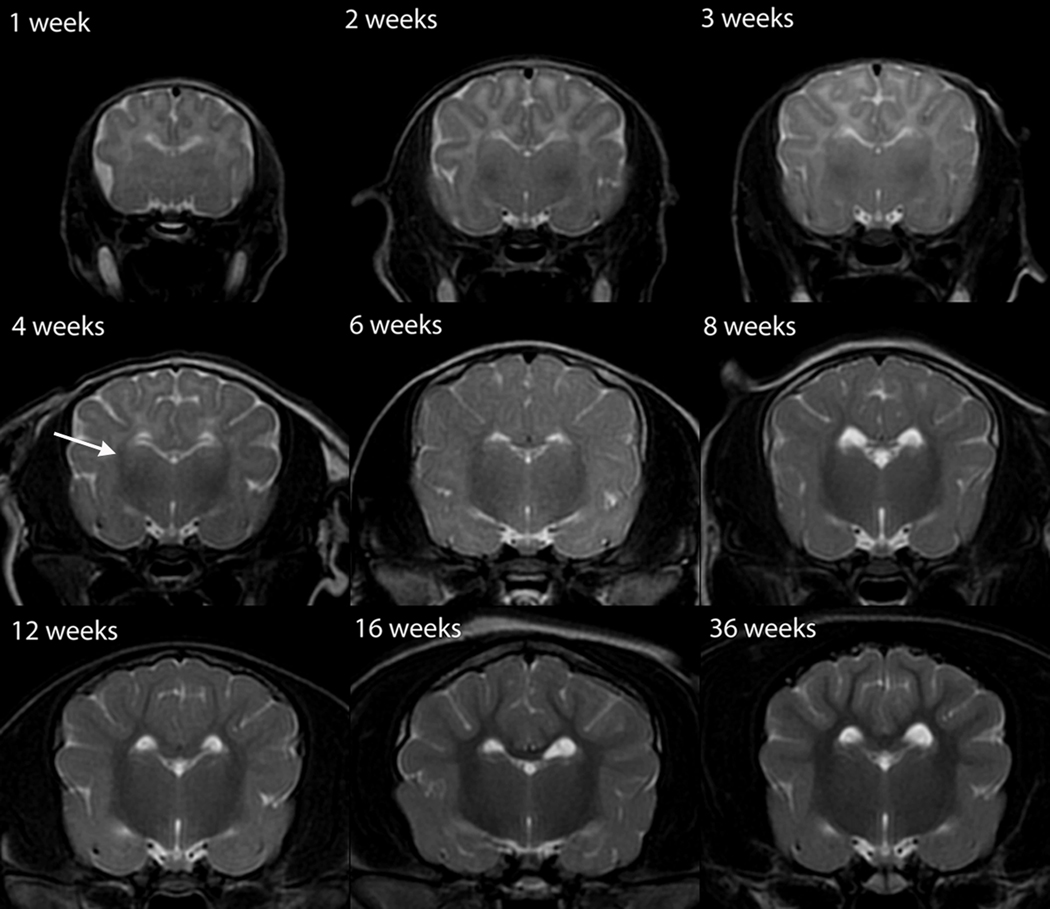
T2W white matter development was evaluated in dorsal (Figure 1), sagittal (Figure 2) and transverse (Figure 3) images. Dorsal images of Figure 1 are at the level of the dorsal internal capsule and are representative of the subcortical white matter changes throughout the rostral and caudal portions of the telencephalon. The sagittal images of Figure 2 are at midline and were thought to be the most useful for assessment of the cerebellum and corpus callosum. The transverse images of Figure 3 are at the level of the interthalamic adhesion; this location was chosen because it depicted the relevant gray and white matter anatomy at the mid telencephalon and because it was the most consistently acquired image location for all individuals at all ages.
Fig. 1.
Dorsal T2-weighted canine brain maturation progression. Image location is through the cerebral cortex at the level of the dorsal internal capsule. The subcortical white matter is hyperintense to gray matter during the juvenile phase (2 weeks and 4 weeks), isointense during the transition phase (6 weeks) and exhibits hypointensity during the maturing phase and into adulthood (12–36 weeks). The relative decrease in white matter intensity is predominantly due to a decrease in water content during myelination. The internal capsule is first consistently identifiable at 4 weeks (arrows).
Fig. 2.
Sagittal T2-weighted canine brain maturation progression. Image location is midline. Hypointensity of the brainstem, relative to the cerebral gray matter, progresses from caudal to rostral during the first 6 weeks. At 6 weeks the brainstem and cerebellum exhibit an adult appearance. The relative decrease in white matter intensity is predominantly due to a decrease in water content during myelination. A hypointense linear feature corresponding with the corpus callosum becomes evident at 6 weeks (arrow). The full length of the corpus callosum is observed at 8 weeks and at 16 weeks it has an adult appearance.
Fig. 3.
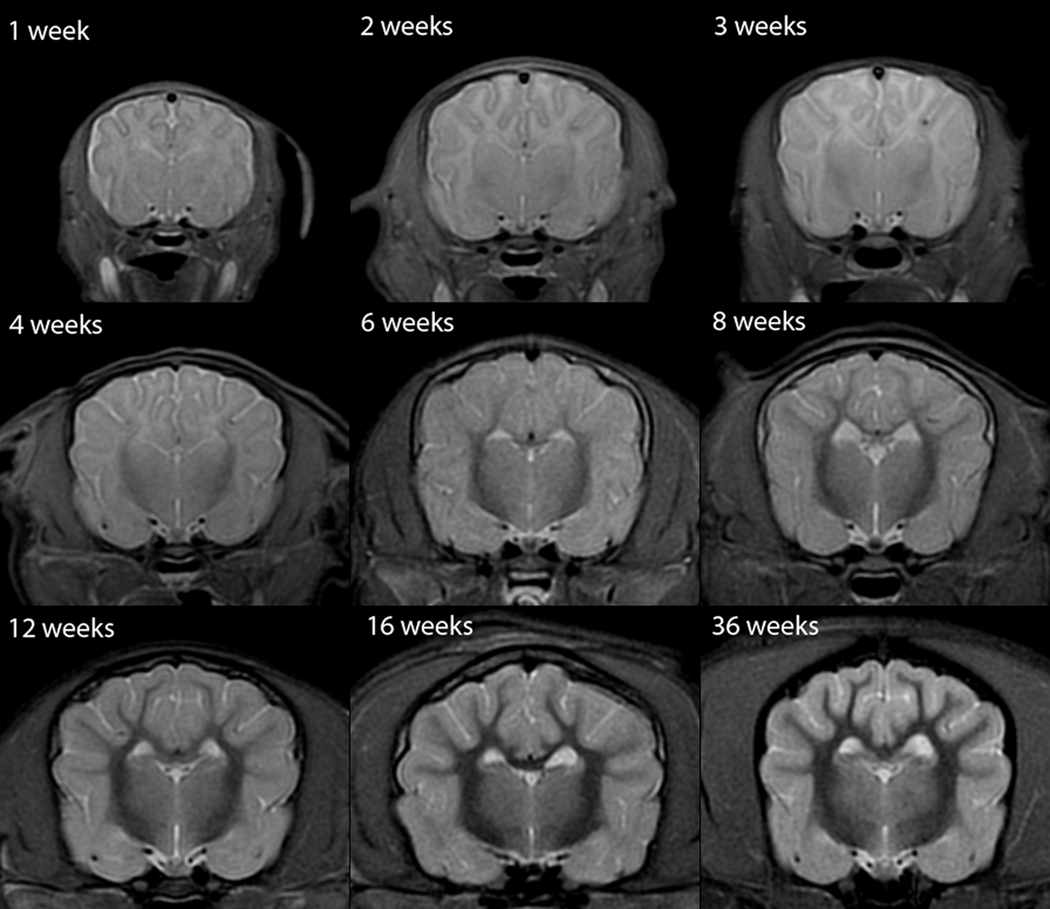
Transverse T2-weighted canine brain maturation progression. Image location is mid telencephalon, at the level of the interthalamic adhesion. The subcortical white matter is hyperintense to gray matter during the juvenile phase (weeks 1–4), isointense during the transition phase (6 weeks) and exhibits a hypointensity during the maturing phase and into adulthood (8–36 weeks). The relative decrease in white matter intensity is predominantly due to a decrease in water content during myelination. The internal capsule is first consistently identifiable at 4 weeks (arrow), lateral to the geniculate bodies of the thalamus.
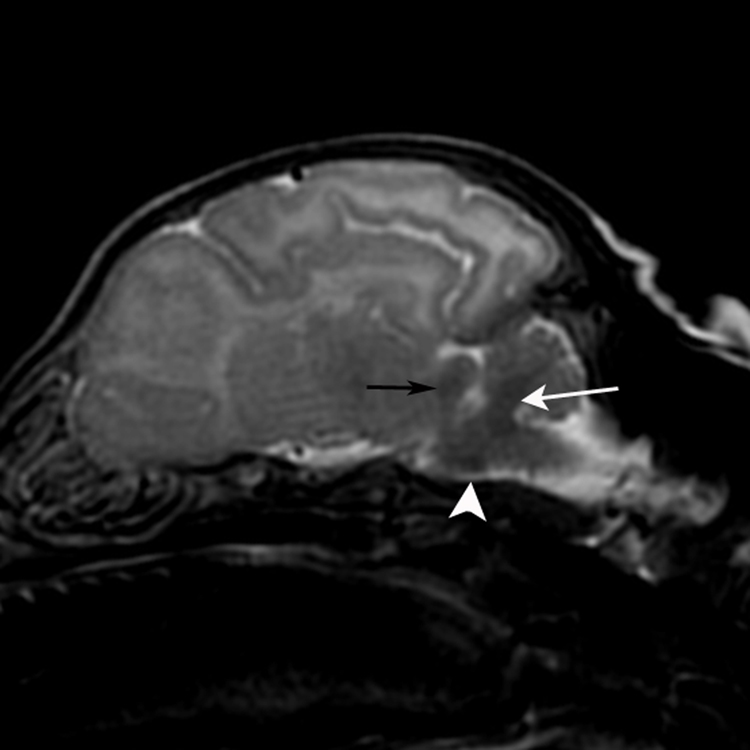
At 1 week the brainstem was isointense while the subcortical white matter was T2-hyperintense (Figure 2). From 2 to 6 weeks the brainstem became more T2-hypointense (Figure 2). Within the brainstem, the caudal colliculi, the trapezoid bodies, lateral lemnisci and cerebellar peduncle were hypointense to the remainder of the brainstem (Figure 4). These areas became isointense to the remainder of the brainstem by 6 weeks, when the brainstem exhibited a mature appearance. During this same time there was rapid development of the cerebellar arbor vitae, with an adult appearance to the cerebellum at 6 weeks (Figure 2). The internal capsule was mildly T2-hypointense at 2 and 3 weeks and was distinguishable as a T2-hypointense feature on dorsal and transverse images at 4 weeks of age (Figures 1 and 3). On T2-weighted image identification of the internal capsule at weeks 2 through 4 there was no consistent bias towards which part, rostral or caudal crus, was identified earliest. The corpus callosum was poorly and inconsistently identified at 4 weeks but was clearly evident as a thin and sometimes incomplete T2-hypointense feature on mid-sagittal images beginning at 6 weeks. The complete corpus callosum, including the genu, body, and splenium, was not consistently seen until 8 weeks.
Fig. 4.
Parasagittal T2-weighted 3-week-old canine brain with early myelinating regions of the brainstem. The cerebellar peduncle (white arrow), trapezoid body (white arrowhead) and caudal colliculus (black arrow) exhibit prominent hypointensity at 2 and 3 weeks as a result of the relative decrease in water content that accompanies myelin formation and maturation.
The cerebral white matter was uniformly T2-hyperintense during the first 4 weeks but its signal decreased visibly during this time (Figures 1–3). At 6 weeks the subcortical white matter was isointense or variably mildly hypo- and hyperintense, with all individuals having a mild heterogeneous appearance to the cerebral cortex (Figure 3). At 8 weeks and later, the subcortical white matter was T2-hypointense, with its signal gradually decreasing, until 16 weeks when the white matter appearance was similar to that of an adult (Figures 1 and 3). A mild appreciable decrease in relative intensity and increase in relative volume of the white matter continued to 36 weeks (Figures 1 and 3).
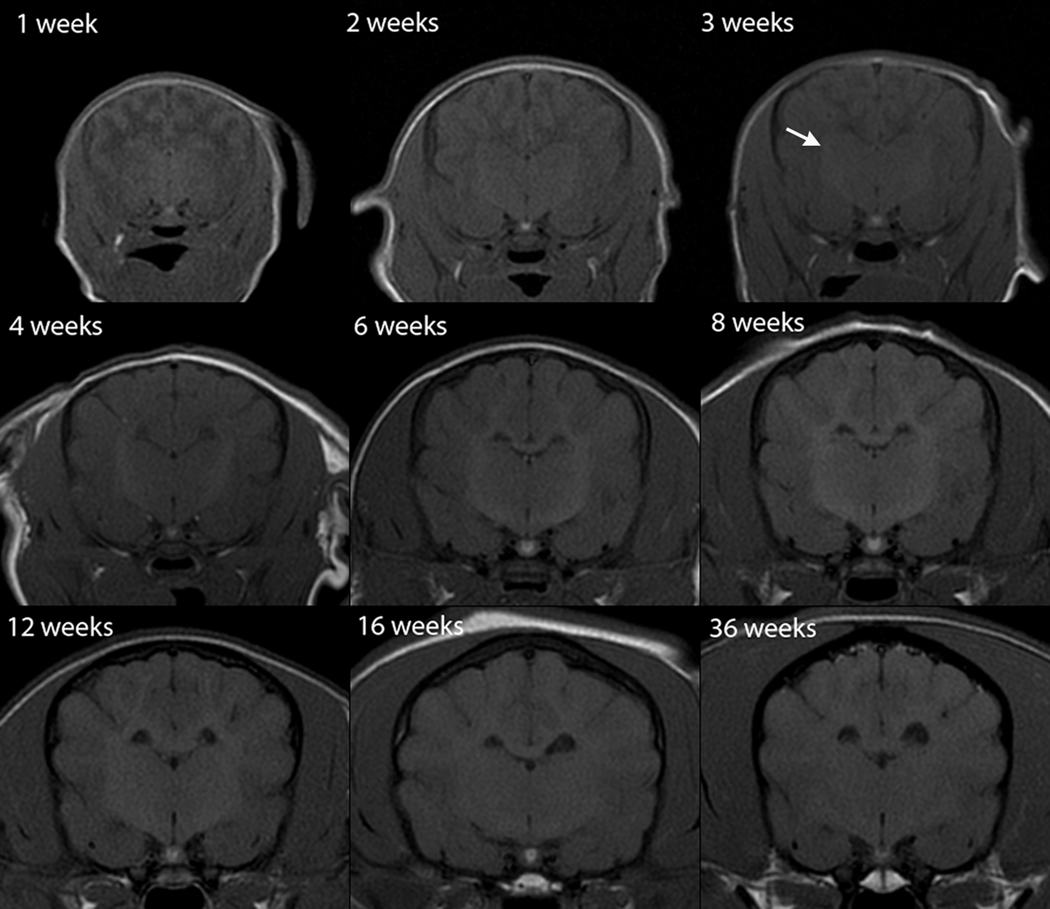
T1W white matter progression was assessed in sagittal and transverse images (Figures 5,6). The brainstem exhibited a mildly heterogeneous isointensity at 1 week that progressed to a mature uniform mild T1-hyperintensity by week 4 (Figure 5). The cerebellum also exhibited a mature appearance by week 4 (Figure 5). At 2 weeks the internal capsule was inconsistently identified as a faint T1-hyperintensity, at 3 weeks it remained faint but was consistently observed and by 4 weeks was a clearly distinguished T1-hyperintense structure (Figure 6). On T1-weighted image identification of the internal capsule at weeks 2 through 4 there was no consistent bias towards which part, rostral or caudal crus, was identified earliest. The corpus callosum was poorly and inconsistently observed at 2 and 3 weeks but at 4 weeks was clearly identifiable on mid-sagittal images, though thin and sometimes incomplete. At 6 weeks the corpus callosum was similar in appearance to its appearance in the adult (Figure 5).
Fig. 5.
Sagittal T1-weighted canine brain maturation progression. Image location is midline. A hyperintense linear feature corresponding with the corpus callosum is evident at 4 weeks (arrow). The relative increase in white matter intensity is due to a combination of increasing lipid and decreasing water during myelination. The full length of the corpus callosum is observed at 6 weeks and by 16 weeks it has an adult appearance. The normal neurohypophyseal focal hyperintensity, thought due to neurotransmitters, is evident at 1 week and beyond (arrowhead).
Fig. 6.
Transverse T1-weighted canine brain maturation progression. Image location is mid telencephalon, at the level of the interthalamic adhesion. The subcortical white matter is hypointense to gray matter during the juvenile phase (weeks 1–3), isointense during the transition phase (4 weeks) and exhibits hyperintensity during the maturing phase and into adulthood (6–36 weeks). The relative increase in white matter intensity is due to a combination of increasing lipid and decreasing water during myelination. The hyperintense internal capsule is first consistently identifiable at 3 weeks (arrow).
As in T2W images, the subcortical white matter underwent three phases in T1W images, but its relative intensity is opposite from that observed on the T2W images, and with an earlier onset of, and more rapid progression through, the transition to its adult appearance. Subcortical white matter T1-hypointensity was observed during the first 2 weeks (Figure 6). The transition to a more intense region occurred between 3 and 4 weeks (Figure 6). At week 3, where there was a 4-day postnatal age variation among the individuals imaged, the white matter was variably mildly T1-hypointense to isointense, with the older two individuals (23 days) having uniformly T1-isointense white matter, and the younger two individuals (20 and 21 days) having predominantly mildly T1-hypointense white matter, with the exception of T1-isointensity at the rostral pole of the cerebrum. At 4 weeks all individuals had faint but consistent white matter T1-hyperintensity at the rostral pole of the cerebrum with the remainder of the subcortical white matter isointense. At 6 weeks the subcortical white matter was characterized by thin branching hyperintense streaks and up to 16 weeks there was a progressive extension and expansion of the T1-hyperintensity throughout the entire volume of subcortical white matter to an adult appearance (Figure 6). There were only mild changes observed between 16 and 36 weeks, with the original marked T1-hyperintensity becoming more subdued and diffuse with age (Figure 6).
White matter progression in STIR images was assessed in the transverse plane (Figure 7). The intensity changes in white matter on STIR images were similar to that seen on T2W images. From 6 weeks on, the myelinated white matter was characterized by a pronounced improvement in the conspicuity of the corpus callosum, the internal capsule and subcortical white matter on STIR images (Figure 7) compared with T2W images (Figure 3).
Fig. 7.
Transverse Short Tau Inversion Recovery (STIR) canine brain maturation progression. Image location is mid telencephalon, at the level of the interthalamic adhesion. The subcortical white matter is hyperintense to gray matter during the juvenile phase (weeks 1–4), isointense during the transition phase (6 weeks) and exhibits hypointensity during the maturing phase and into adulthood (8–36 weeks). The relative decrease in white matter intensity is due to a combination of decreasing water and increasing lipid during myelination. The subcortical white matter changes are similar to those of the T2-weighted sequence but with more pronounced relative white matter hypointensity during the mature phase.
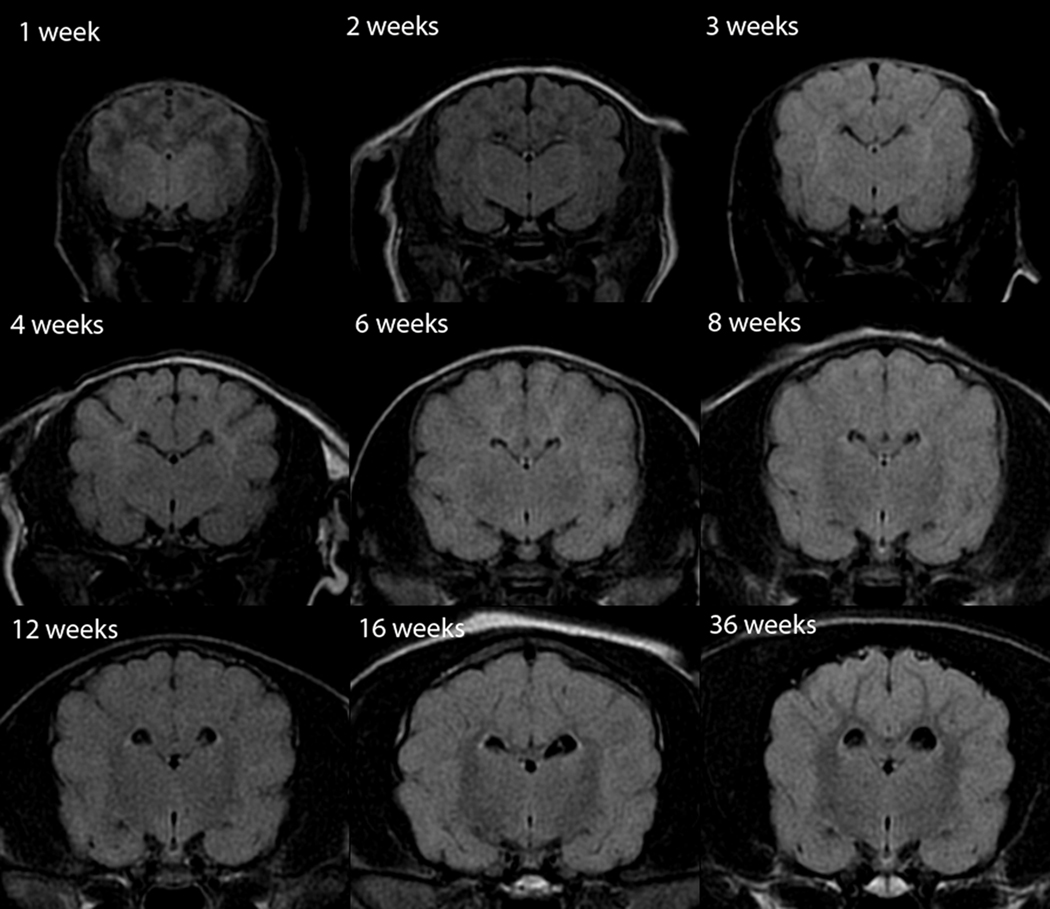
White matter progression on FLAIR images was assessed in the transverse plane (Figure 8). On FLAIR images, the brainstem remained isointense through 4 weeks and at 6 weeks exhibited a heterogeneous mild hypointensity that progressed to a mature appearance at 12 weeks. The internal capsule was poorly distinguished during the first 6 weeks, however from 8 weeks onward it was a conspicuous hypointense structure (Figure 8). The corpus callosum was first seen at 8 weeks and was distinguishable in its entirety at 12 weeks and onward. Distinct from T1W, T2W and STIR images, the subcortical white matter exhibited 5 phases on FLAIR images (Figure 8). There were two juvenile sub-phases with two subsequent transition phases and one maturing phase which was delayed relative to that observed on the other sequences. This is similar to that described in humans.23 At weeks 1 and 2 the cerebral white matter was distinctly hypointense. At 3 weeks there was a shift towards mild hyperintensity. At 4 and 6 weeks the subcortical white matter was distinctly hyperintense. At 8 weeks there was a second transition to generalized white matter hypointensity, with mild variation between individuals. Finally, after 12 weeks, the subcortical white matter remained hypointense, as in the adult. Through 36 weeks, there was continued progression with arborization and expansion of the hypointense regions. This maturation was slower than in the T2W, T1W and STIR images (Figure 8).
Fig. 8.
Transverse Fluid Attenuated Inversion Recovery (FLAIR) canine brain maturation progression. Image location is mid telencephalon, at the level of the interthalamic adhesion. The telencephalon juvenile phase is characterized by two sub-phases, each with an associated transition phase; this differs from the maturation appearance in T1W and T2W images. The subcortical white matter is hypointense to gray matter at weeks 1 and 2 with a transition to being isointense at 3 weeks. This is followed by hyperintensity at weeks 4 and 6 with a second isointensity phase at 8 weeks. From 12 weeks and older the subcortical white matter is characterized by a progressive hypointensity during the maturing phase. The initial period of subcortical white matter hypointensity is attributed to the large amount of free water resulting in a T1 relaxation time similar to CSF, with resultant nulling of the signal by the inversion pulse. Following the rapid initial decrease in free water during the first three weeks, there is not enough free water to result in suppression and the signal intensity follows the T2 relaxation changes as the water content continues to decrease during myelination.
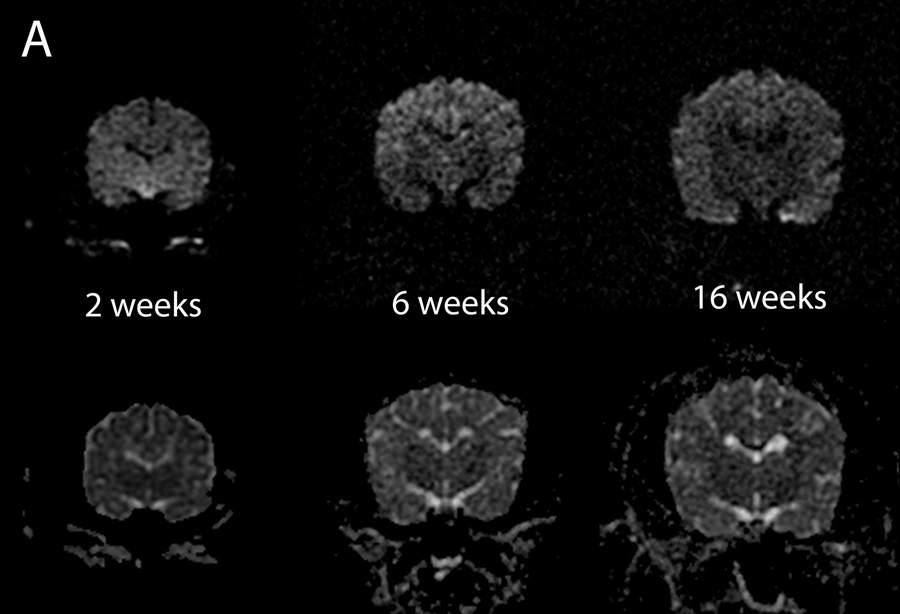
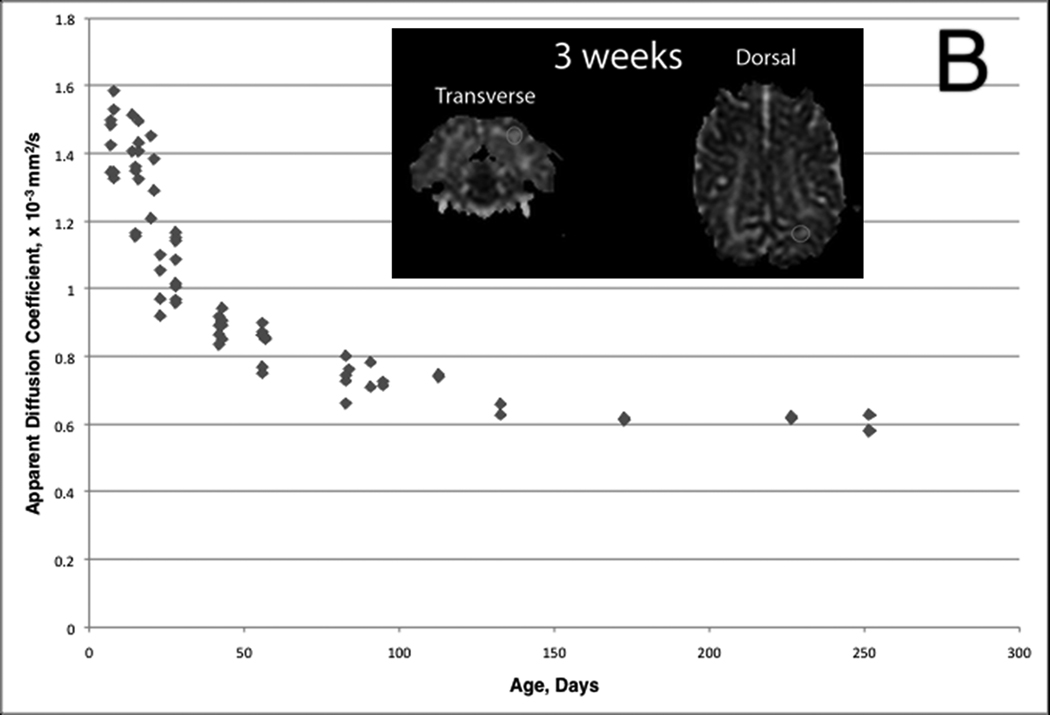
The subcortical white matter exhibited a progressive decrease in diffusivity with age. This was appreciated as a progression on the ADC maps (Figure 9A) similar to that of the T2W images (Figure 3), with the measured apparent diffusion coefficient decreasing throughout the period evaluated.. The ADC decreased most rapidly during the first 4 weeks and then gradually after that (Figure 9B).
Fig. 9.
Diffusivity changes of the subcortical white matter in the developing normal canine brain. A) Diffusion Weighted Images (top row) and corresponding Apparent Diffusion Coefficient (ADC) maps (bottom row). The subcortical white matter is characterized by a progressive decrease in the ADC; evidenced by a decreasing brightness on the ADC maps. B) Mean ADC in a subcortical white matter ROI plotted as a function of time. Mean values are from a region-of-interest (ROI) placed at the subcortical left occipital lobe on dorsal and transverse images. The inset is an example of ROI size and location (white ovals). There is a rapid decrease in mean ADC during the first 4 weeks followed by a gradually declining rate of change through 36 weeks.
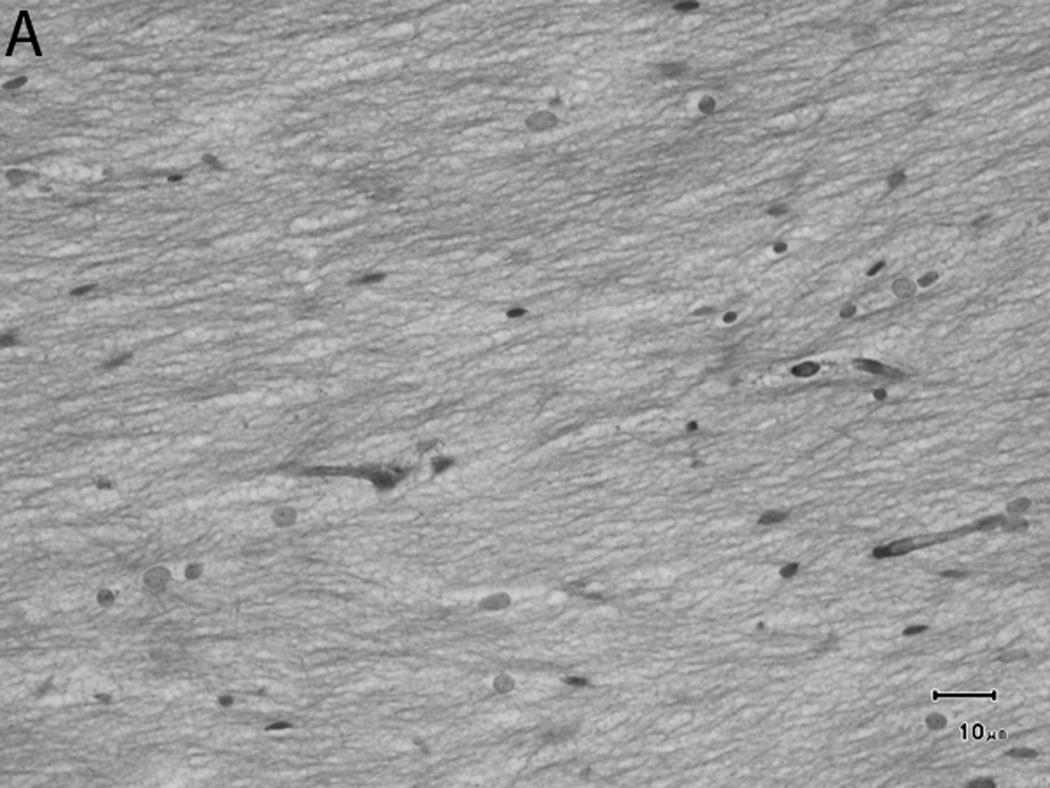
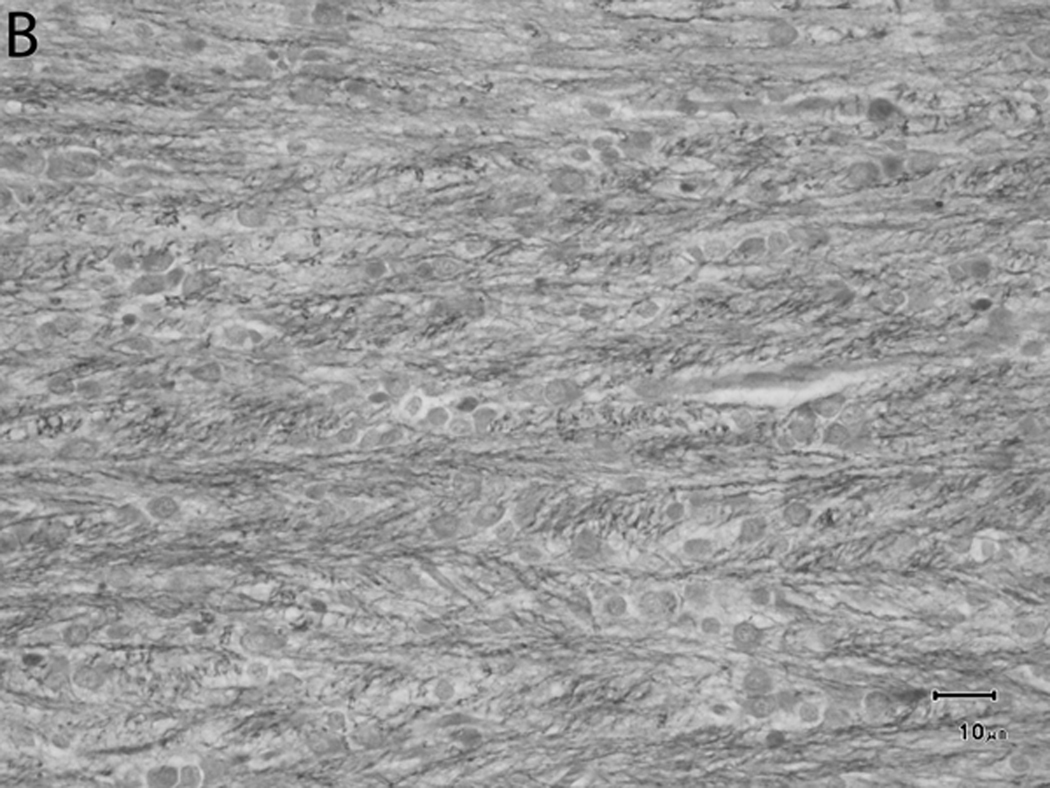
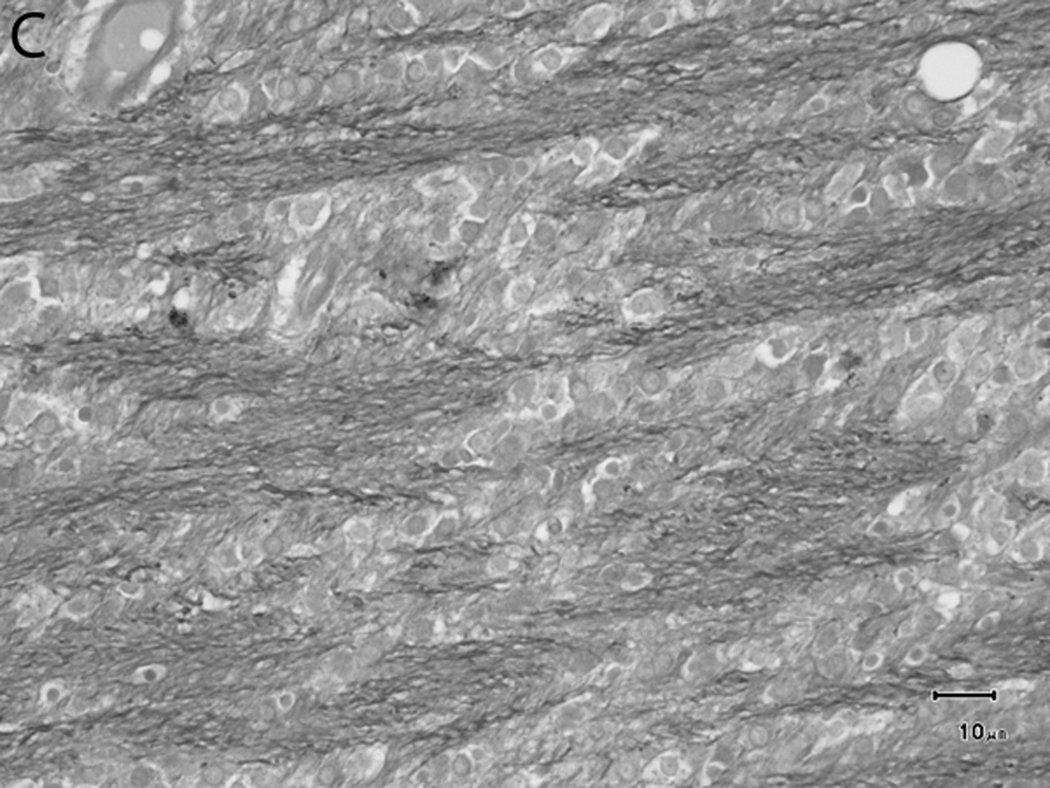
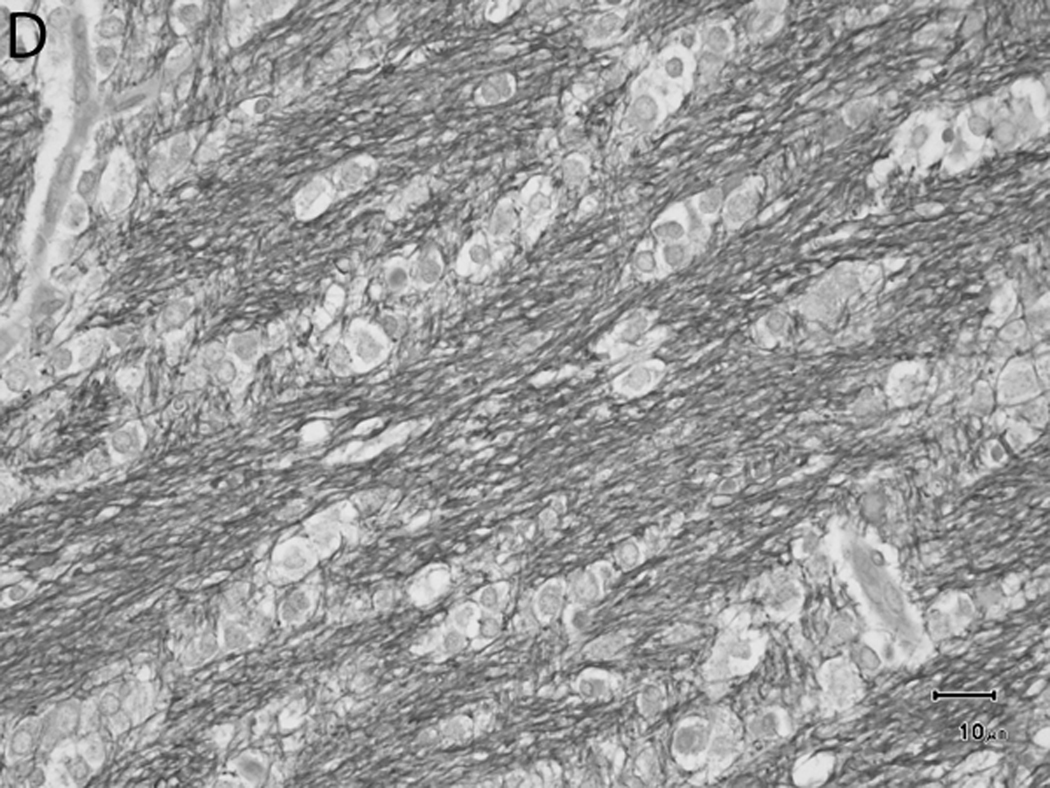
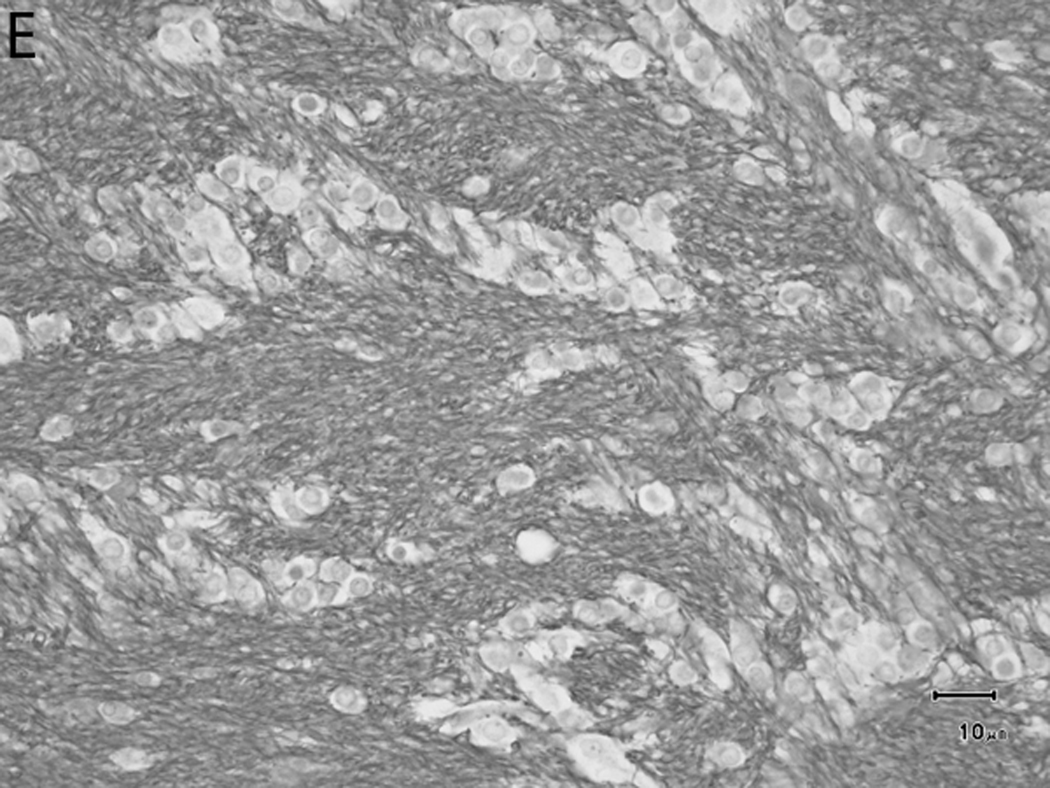
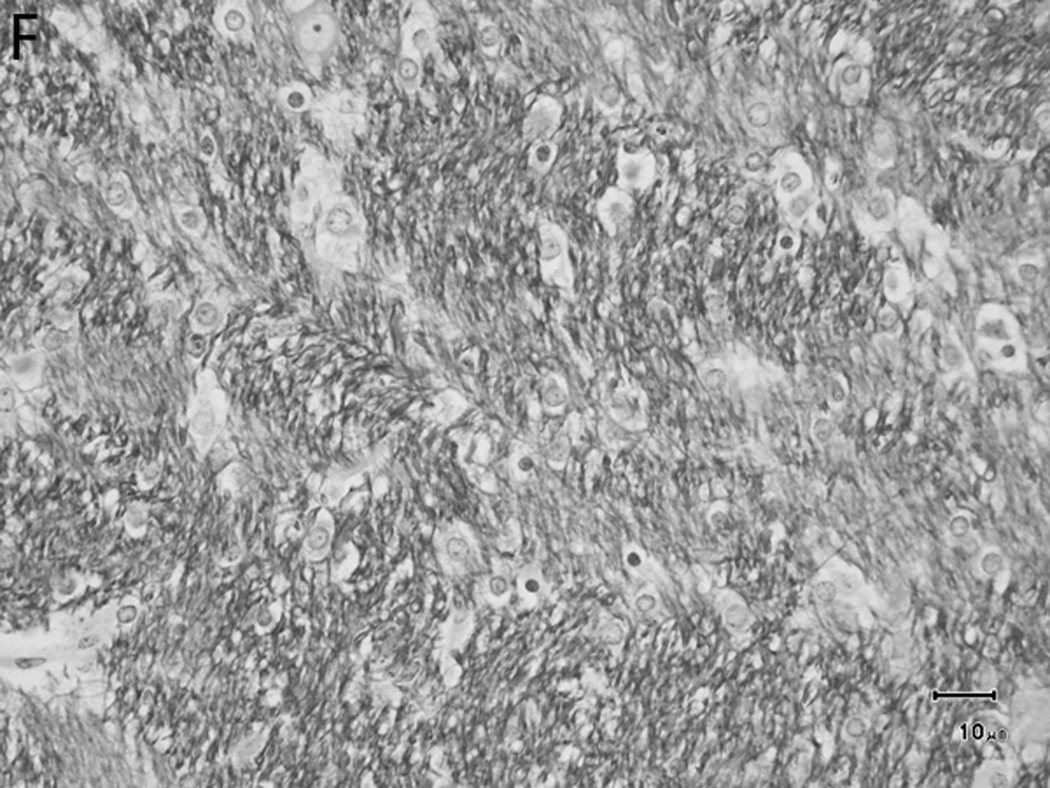
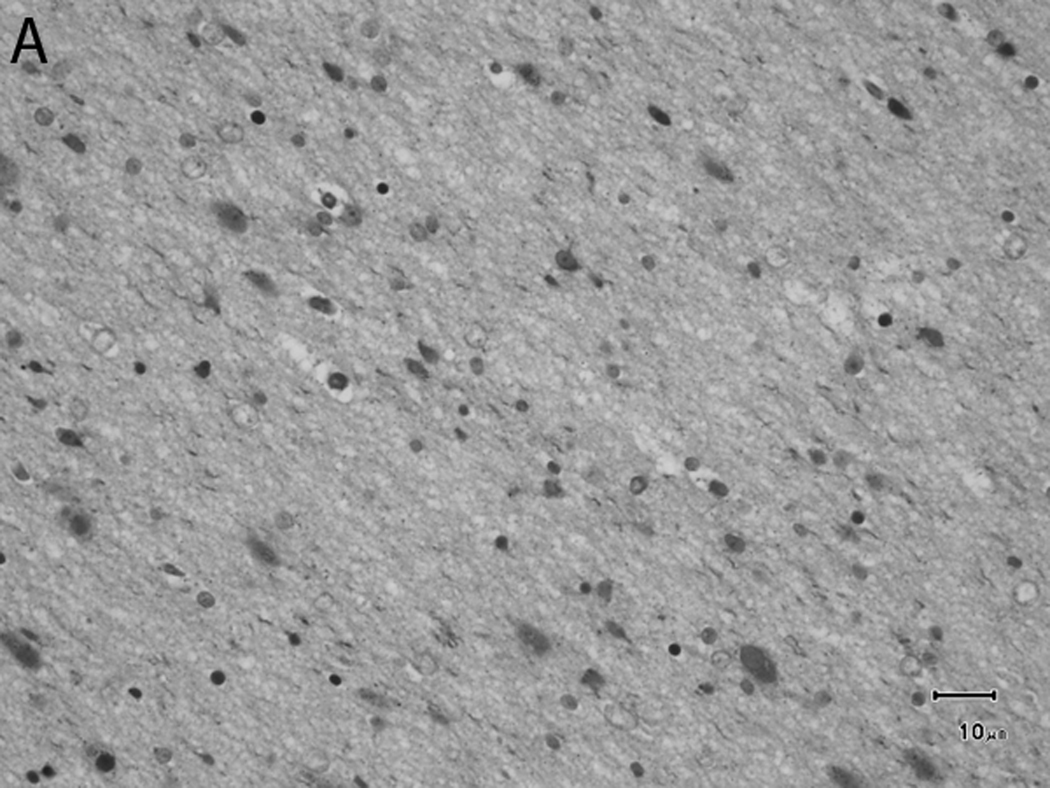
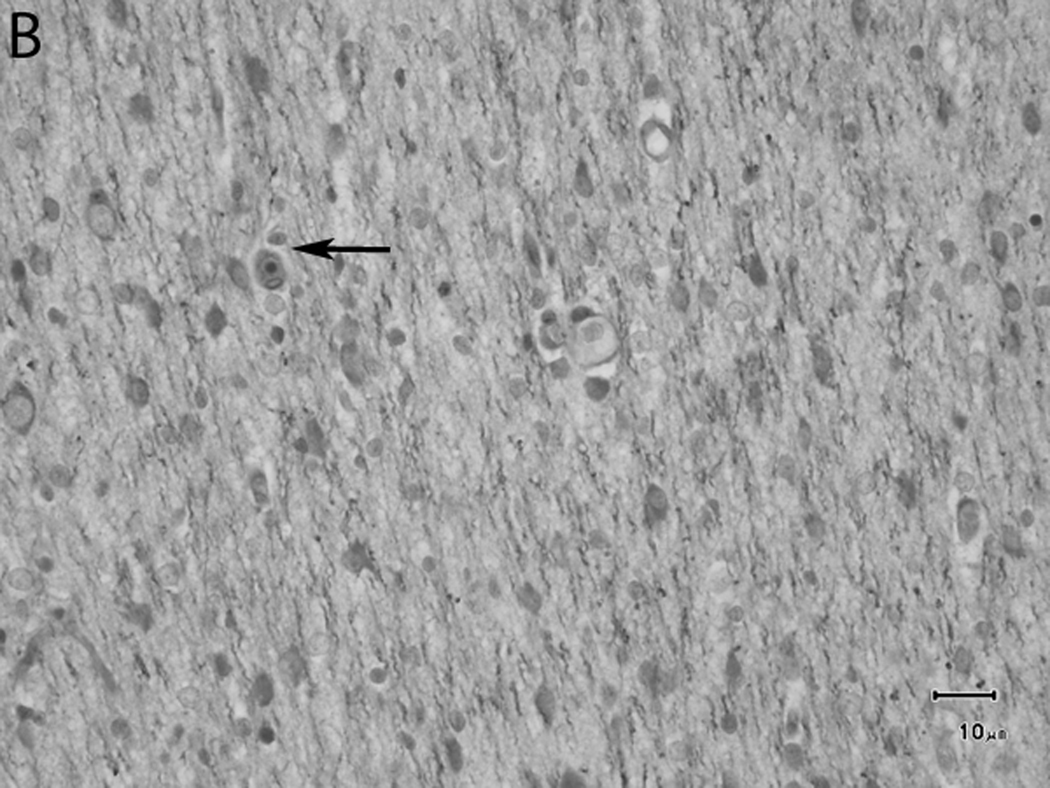
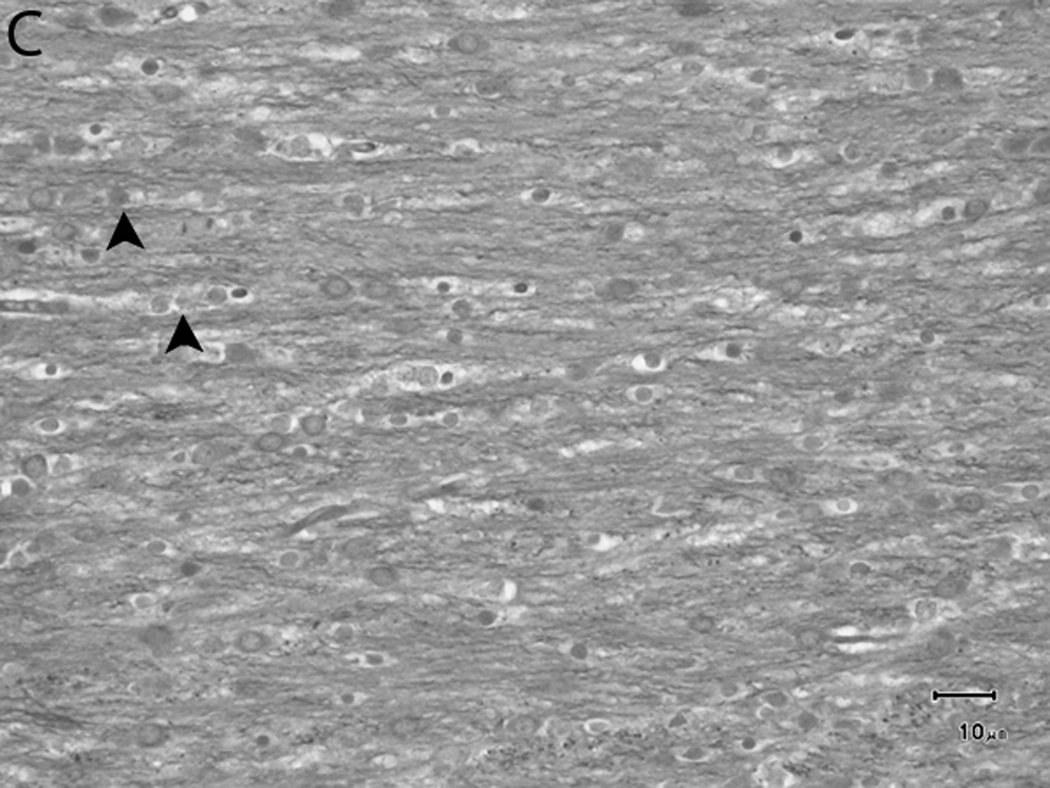
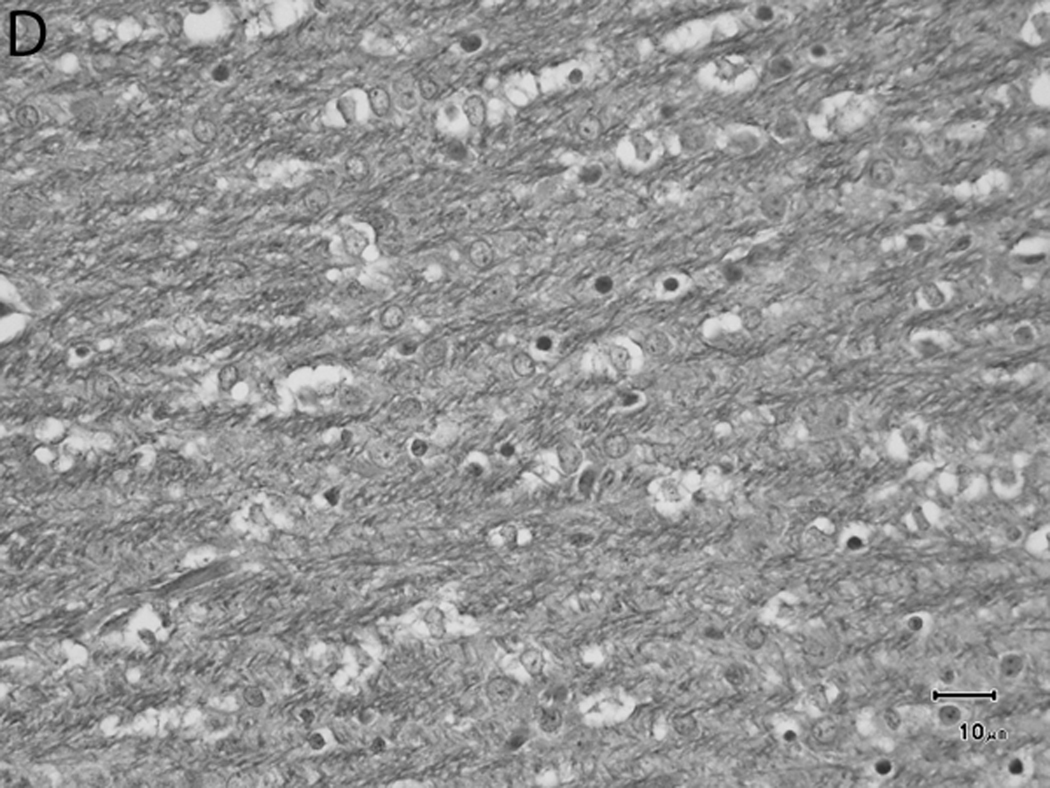
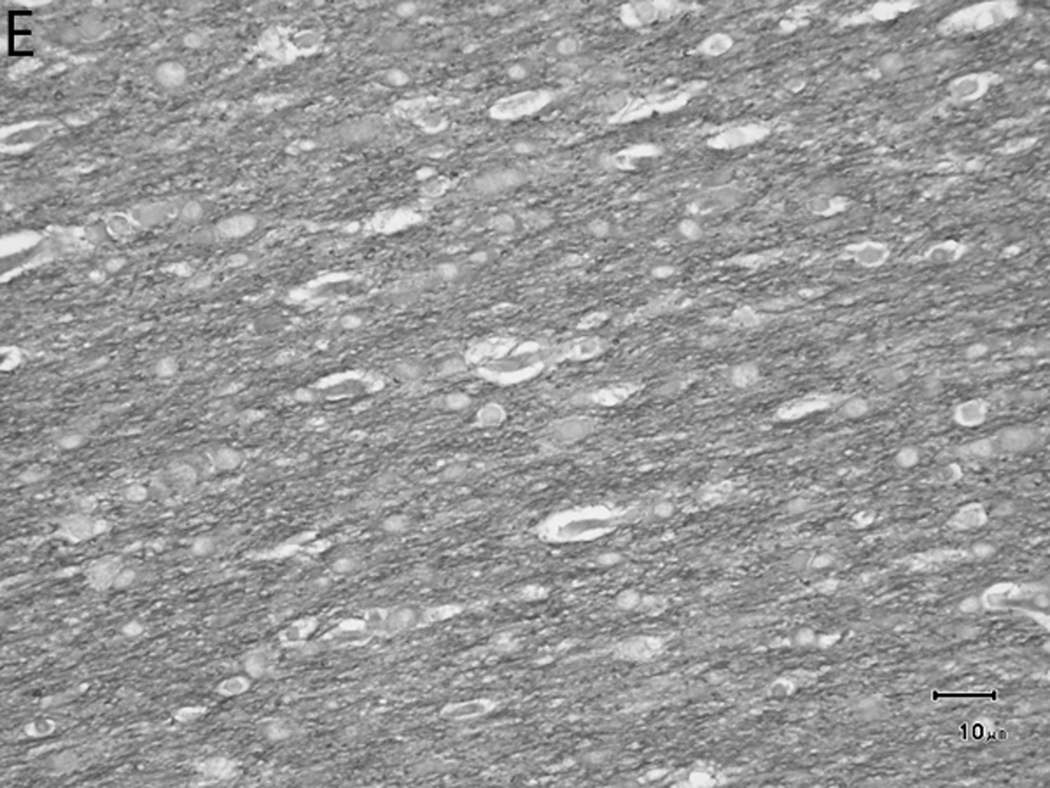
Histologically, there was a progression of cerebral myelination from 1 to 12 weeks, consistent with other data.1 The internal capsule and corpus callosum, as well as the trapezoid bodies, medial and lateral lemnisci, and cerebellar peduncles, demonstrated the earliest signs of myelination, evident at 1 week. A major feature in the corpus callosum and internal capsule at 1 week was the presence of interstitial water with minimal numbers of haphazardly organized mononuclear round cells (oligodendrocyte-like cells) (Figure 10A), while at 2 weeks these regions begin to have higher organization and formation of rows or parallel cords of cells surrounding parallel myelinated fibers (Figure 10B). At week 4, the main change was the marked reduction in interstitial fluid and the beginning of intercrossing organization of myelinated fibers (Figure 10C). Little difference existed from week 4 to week 6, with the exception of an apparent reduction in the concentration of cells (Figure 10D), which is most likely produced by the thickening of the myelinated axons due to an increase in myelin deposition. A dense appearance of the myelinated fibers with reduction in the size and numbers of oligodendrocyte-like cells was observed at week 8 (Figure 10E), with little change at week 12 (Figure 10F).
Fig. 10.
Sequential changes in myelination of the internal capsule. A) 1 week; there is pronounced interstitial water with minimal numbers of haphazardly organized oligodendrocyte-like cells. B) 2 weeks; there is a higher organization of rows or parallel cords of cells surrounding parallel myelinated fibers. C) 4 weeks; there is a marked reduction in the amount of interstitial fluid and a few intercrossing myelinated fibers. D) 6 weeks; there is an apparent reduction in the numbers of cells and thickening of the myelinated axons. E) 8 weeks; there is a dense appearance of the myelinated fibers and a reduction in size and number of the oligodendrocyte-like cells. F) 12 weeks; an increase in the density of the myelinated fibers is seen. Bars represent 10uM. Tissue is stained with Luxol Fast Blue stain.
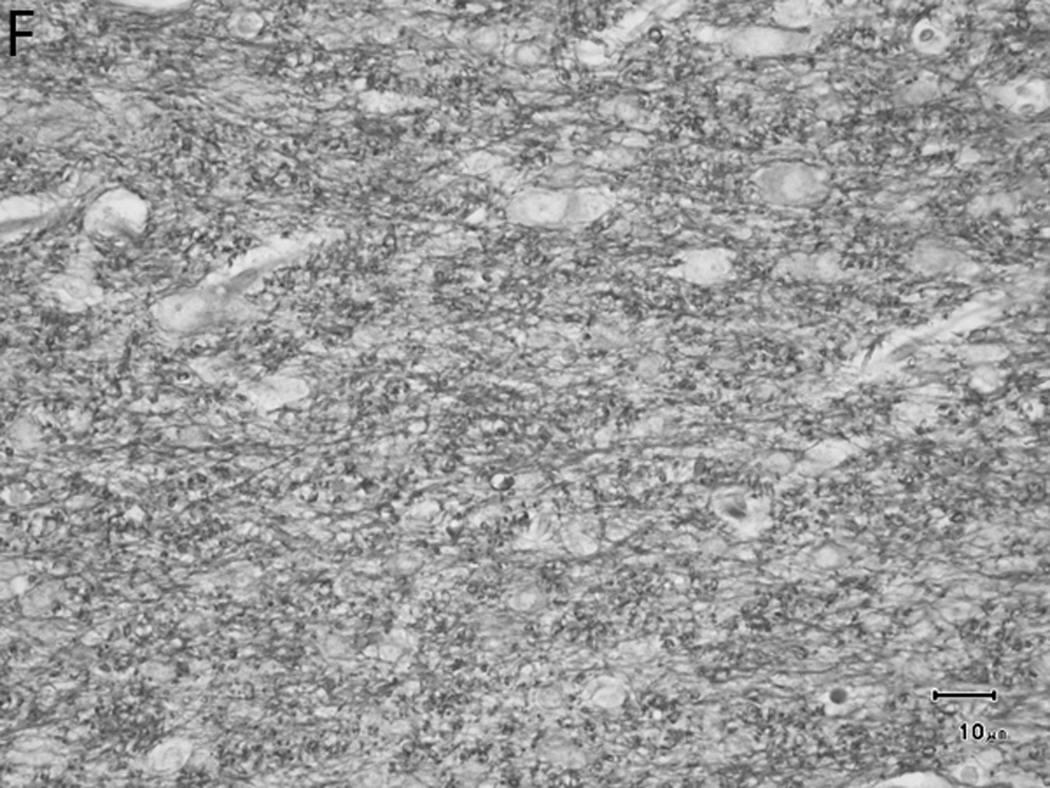
The progression of myelination in the subcortical white matter was slower than in other areas such as the trapezoid bodies, internal capsule or corpus callosum, exhibiting a large accumulation of interstitial fluid at 1 week of age (Figure 11A), with minimal reduction at week 2 (Figure 11B). Less fluid was observed at 4 weeks (Figure 11C), and there was better organization of the oligodendrocyte-like cells. At week 6 (Figure 11D) moderate myelination was present, while interstitial fluid was still identified. By 8 weeks (Figure 11E) the myelinated fibers had a higher organization and the amount of fluid was minimal, giving a more dense appearance to the myelinated tissue. At 12 weeks (Figure 11F) the subcortical white matter appeared denser and intercrossing fibers were present. At 1 week minimal myelination was observed in most of the subcortical white matter. Even at this early stage, however, a higher concentration of myelinated fibers was observed in the frontal lobes than in the parietal and occipital lobes. The mildly higher level of myelination in the frontal lobe than the occipital lobe remained evident at 12 weeks.
Fig. 11.
Sequential changes in the myelination of the subcortical white matter of the frontal lobe. A) 1 week; there is a large accumulation of interstitial fluid. B) 2 weeks, the amount of interstitial fluid is minimally reduced, the cells appear to start aligning in rows (arrow), and myelin accumulation is more apparent than in A. C) 4 weeks; less fluid is observed and cells with parallel arrangement are present (arrowheads). D) 6 weeks; moderate myelination is present, and interstitial fluid is still identified. E) 8 weeks; the myelinated fibers have a higher organization and the amount of fluid is minimal, giving a more dense appearance to the myelinated tissue. F) 12 weeks; the subcortical white matter appears denser and intercrossing fibers are present. Bars represent 10uM. Tissue is stained with Luxol Fast Blue stain.
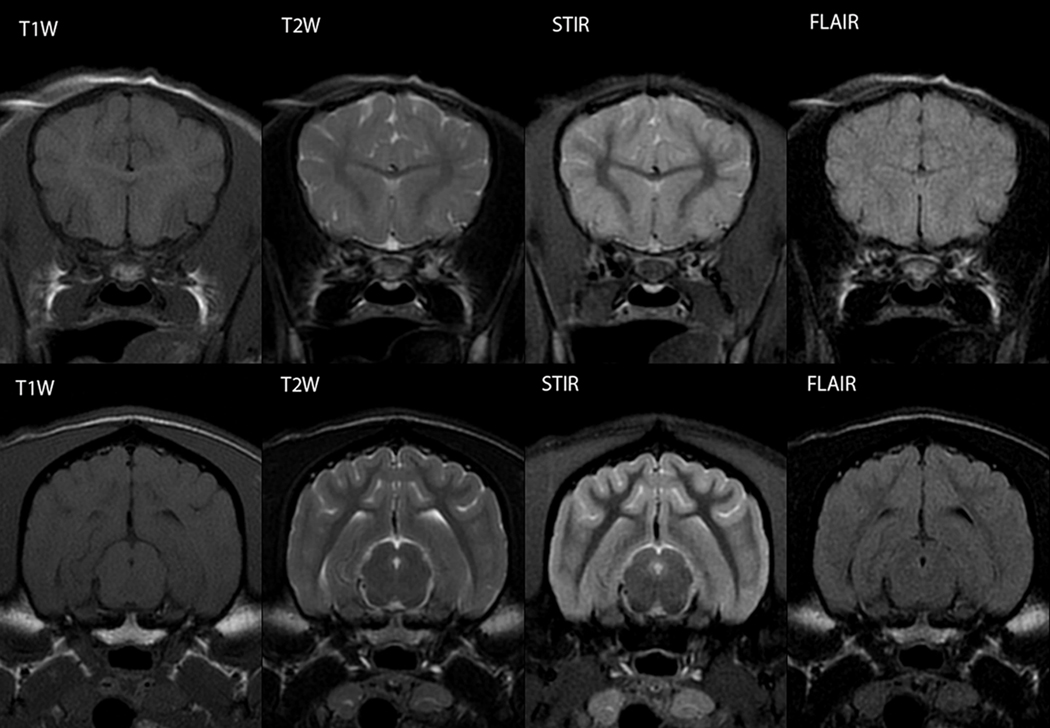
For comparative purposes, transverse images from two regions acquired using the sequences employed in this study are shown in Figure 12.
Figure 12.
MRI sequence comparison of the immature and mature brain. Top row: transverse section through the rostral telencephalon at the level of the genu of the corpus callosum at 8 weeks of age. Bottom row: transverse section through the caudal telencephalon at the level of the mesencephalic aqueduct at 36 weeks of age. Each panel in the respective row is the same individual at the same scan date and same slice location for different MRI sequences, as labeled.
Discussion
The changing appearance of the maturing brain on the various MR imaging sequences can be attributed to several combined processes, with their subsequent complex effects on T1-and T2-relaxation time and proton density.1, 24–26 There was a rapid decrease in the relatively high extracellular water content of the neonate brain. In addition, there was development of axons and dendrites and proliferation and differentiation of glial cells, particularly in the subcortical white matter. Concurrent with these changes was the progressive development and extension of myelin from oligodendrocytes. Myelin contains a relatively high proportion of lipid, however this lipid is in a different form from that of adipose tissue and this affects its T1 and T2 relaxation. Myelin is a sheath consisting of multiple layers composed of glycolipids, phospholipids, proteolipids, cholesterol and proteins. Some of these are hydrophobic while others interact strongly with water. The process of myelination consists of both production of an initial sheath, with composition similar to an oligodendrocyte cell membrane, and a transition to the mature compact structure. During this maturation process the chemical composition and the structure of the sheath undergo changes to the final compact form. There is intra-axonal and extra-cellular water outside the sheath as well as water molecules within the layers of the sheath. The strong interaction of the intramembranous water with several of the component molecules is thought to result in a pronounced T1 shortening effect on this component of the water. At the longer echo times of T2-weighted signal generation, the reduced signal intensity observed with myelination is attributed to the effect of the decreasing axonal and extracellular water content being stronger than that of increased lipids.24
The process of myelin formation and maturation continues into early adulthood following the dramatic rapid early changes observed in the juvenile, as late as into the 2nd or even 3rd decade of life in humans.7, 8, 27 It is not clearly established how long similar changes take in the dog but, based on our observations, they likely continue to and beyond 36 weeks, the last imaging time in our study. This is supported by a previous observation that the lipid percentage of dry matter in developing canine brain gradually increased up to 1 year.1
Based on our results, the MR imaging features of normal canine brain maturation parallels that in humans, but proceeds at an accelerated rate. The brainstem and cerebellum mature first, followed by the cerebrum, in a central to peripheral pattern. The changes observed on T1W images preceded those on T2W and STIR images, with changes seen in FLAIR images being even more delayed. All MR imaging changes lagged behind histologic changes. At the brainstem, the auditory system regions of the trapezoid bodies, cerebellar peduncles, lateral lemnisci and caudal colliculi were clearly identified areas of early myelination with histology and this correlated as distinct areas of early T2W hypointensity in all individuals at 2 weeks of age attributed to the associated decrease in relative water content at these regions. This is consistent with findings of early myelinating structures in humans as well that previously described in the dog.1, 28, 29
Three observations made with MRI and histology in developing human brain were not observed in developing canine brain. First, the posterior limb of the internal capsule (caudal crus) in humans consistently has early myelination that precedes myelination in the anterior limb (rostral crus).30–32 In the dog, we observed simultaneous or inconsistent myelination throughout the internal capsule. A previously described central origin of myelination in the dog was not observed in our dogs.1 Second, in humans and other primates myelination occurs in the subcortical white matter of the occipital lobes before myelination in the frontal lobes.3, 4, 25, 33 Based on our observations, the opposite occurs in the dog with myelination of the rostral pole of the cerebrum preceding that of the caudal pole. This is supported by the appearance of the T1W images at 3 and 4 weeks. Our findings are supported by others.1 Third, there are conflicting reports in humans whether the corpus callosum develops sequentially starting with the splenium, the genu or body, and in what direction it proceeds.32, 34, 35 We observed the corpus callosum to develop simultaneously throughout its length, without a consistent nidus or directionality.
The imaging parameters we used are also commonly used for the evaluation of the adult canine brain, with the exception of the STIR images, which are not a sequence used commonly for the assessment of canine brain disease. STIR images are, however, often used in human pediatric MR imaging protocols.36 Inversion recovery sequences with short inversion times providing more T2 weighting (STIR) and medium inversion times providing more T1 weighting (T1 FLAIR) are useful for increasing the contrast between the cerebral cortex and subcortical white matter which is undergoing normal myelination or is fully myelinated.37, 38 For STIR images, the specific parameters needed for myelin attenuation are generally determined for individual systems.39, 40 We did not conduct a trial to optimize contrast in STIR images, rather we used those based on prior experience in adult dogs.
For routine evaluation of the immature canine brain, our results suggest that, as with the adult, standard transverse and sagittal T2W and T1W images are adequate. The added benefit of FLAIR images is debatable for human infants, depending on their age.19, 36, 41 The added value of FLAIR images is questionable in dogs less than 3 to 4 months of age based on our observations in the normal dog. This is because from 3 weeks until 12 weeks of age the subcortical white matter is mildly hyperintense to gray matter on FLAIR sequences and thus the conspicuity of most lesions that result in increased T2-weighted hyperintensity at the peri-ventricular regions or white matter would not be improved as they are in the adult. STIR images may provide useful information, or increased diagnostic confidence available from T2W images alone, for leukodystrophies, demyelinating diseases and cortical dysplasia in patients with intractable seizures. Some of these conditions have been described in the dog, while others are currently only recognized in humans.42–45 This supposition will require confirmation with future studies involving pathologic conditions. Unfortunately, T1 FLAIR images were not included in this study. They may allow earlier and more conspicuous evidence of myelination than T1W images. The diffusivity within the subcortical white matter of the neonate canine proved to decrease during maturation, as expected with the cellular changes occurring in this region. Diffusion weighted imaging has proven useful in the early evaluation of animal model and human neonates suffering from hypoxic ischemic encephalopathy and is a matter of current research, however the clinical utility of this as applied to the dog remains to be determined.46–49
In conclusion, the normal temporal changes of the developing canine brain that are apparent in MR images are orderly and predictable, correlate with histologic observations of myelination and decreasing water content and are generally consistent with those observed in humans, but proceed at an accelerated pace. These changes reflect the combined effects of decreasing water content and increasing myelin formation and maturation. Understanding the normal progression of changes observed in MR images during the development of the immature brain should reduce the risk of misinterpreting normal changes as disease and failing to recognize altered development.
ACKNOWLEDGMENTS
Funding provided in part by NIH grant: NIH 1 R01 NS054242-01 Principal Investigator. Patricia I Dickson UCLA Harbor Medical School, Iowa State University subcontract 9/29/2006–9/28/2011.
The authors thank Stana Hanson, Marcia Schmidt and Samantha Schmidt for their outstanding MR imaging of the puppies.
Footnotes
Isoflo Abbott Laboratories North Chicago IL USA
Torbugesic Fort Dodge Animal Health Fort Dodge IA USA
Vedco St. Joseph MO USA
Rapinovet Teva Parenteral Medicines Inc. Irvine CA USA
GE Medical Systems Signa Excite 11.0 Milwaukee WI USA
REFERENCES
- 1.Fox MW. Integrative development of brain and behavior in the dog. Chicago and London: The Univerisity of Chicago Press; 1971. [Google Scholar]
- 2.Baratti C, Barnett AS, Pierpaoli C. Comparitive MR imaging study of brain maturation in kittens with T1, T2, and the trace of the diffusion tensor. Radiology. 1999;210:133–142. doi: 10.1148/radiology.210.1.r99ja09133. [DOI] [PubMed] [Google Scholar]
- 3.Barkovich AJ, Kjos BO, Jackson DE, Jr, Norman D. Normal maturation of the neonatal and infant brain: MR imaging at 1.5 T. Radiology. 1988;166:173–180. doi: 10.1148/radiology.166.1.3336675. [DOI] [PubMed] [Google Scholar]
- 4.Miot-Noirault E, Barantin L, Akoka S, Le Pape A. T2 relaxation time as a marker of brain myelination: experimental MR study in two neonatal animal models. J Neurosci Methods. 1997;72:5–14. doi: 10.1016/s0165-0270(96)00148-3. [DOI] [PubMed] [Google Scholar]
- 5.Jacobson S. Sequence of Myelinization in the Brain of the Albino Rat. A. Cerebral Cortex, Thalamus and Related Structures. J Comp Neurol. 1963;121:5–29. doi: 10.1002/cne.901210103. [DOI] [PubMed] [Google Scholar]
- 6.Chaffin MK, Walker MA, McArthur NH, Perris EE, Matthews NS. Magnetic resonance imaging of the brain of normal neonatal foals. Vet Radiol Ultrasound. 1997;38:102–111. doi: 10.1111/j.1740-8261.1997.tb00823.x. [DOI] [PubMed] [Google Scholar]
- 7.Watson RE, Desesso JM, Hurtt ME, Cappon GD. Postnatal growth and morphological development of the brain: a species comparison. Birth Defects Res B Dev Reprod Toxicol. 2006;77:471–484. doi: 10.1002/bdrb.20090. [DOI] [PubMed] [Google Scholar]
- 8.Ballesteros MC, Hansen PE, Soila K. MR imaging of the developing human brain. Part 2. Postnatal development. Radiographics. 1993;13:611–622. doi: 10.1148/radiographics.13.3.8316668. [DOI] [PubMed] [Google Scholar]
- 9.Dietrich RB, Bradley WG, Zaragoza EJt, Otto RJ, Taira RK, Wilson GH, Kangarloo H. MR evaluation of early myelination patterns in normal and developmentally delayed infants. Am J Roentgenol. 1988;150:889–896. doi: 10.2214/ajr.150.4.889. [DOI] [PubMed] [Google Scholar]
- 10.Shull RM, Hastings NE. Fluorometric assay of alpha-L-iduronidase in serum for detection of affected and carrier animals in a canine model of mucopolysaccharidosis I. Clin Chem. 1985;31:826–827. [PubMed] [Google Scholar]
- 11.Ellinwood NM, Henthorn PS, Giger U, Haskins ME. Mucopolysaccharidosis type IIIB: Identification of the causative mutation in the canine model. American Society of Human Genetics, 53rd Annual Meeting; November 4–8, 2003; Los Angeles, CA. [Google Scholar]
- 12.Menon KP, Tieu PT, Neufeld EF. Architecture of the canine IDUA gene and mutation underlying canine mucopolysaccharidosis I. Genomics. 1992;14:763–768. doi: 10.1016/s0888-7543(05)80182-x. [DOI] [PubMed] [Google Scholar]
- 13.Ray J, Bouvet A, DeSanto C, Fyfe JC, Xu D, Wolfe JH, Aguirre GD, Patterson DF, Haskins ME, Henthorn PS. Cloning of the canine beta-glucuronidase cDNA, mutation identification in canine MPS VII, and retroviral vector-mediated correction of MPS VII cells. Genomics. 1998;48:248–253. doi: 10.1006/geno.1997.5189. [DOI] [PubMed] [Google Scholar]
- 14.Beaver BV. Somatosensory development in puppies. Vet Med Small Anim Clin. 1982;77:39–41. [PubMed] [Google Scholar]
- 15.Lavely JA. Pediatric neurology of the dog and cat. Vet Clin North Am Small Anim Pract. 2006;36:475–502. doi: 10.1016/j.cvsm.2005.12.009. [DOI] [PubMed] [Google Scholar]
- 16.Kraft SL, Gavin PP, Wendling LR, Reddy VK. Canine Brain Anatomy on Magnetic Resonance Images. Veterinary Radiology. 1989;30:147–158. [Google Scholar]
- 17.Leigh EJ, Mackillop E, Robertson ID, Hudson LC. Clinical anatomy of the canine brain using magnetic resonance imaging. Vet Radiol Ultrasound. 2008;49:113–121. doi: 10.1111/j.1740-8261.2008.00336.x. [DOI] [PubMed] [Google Scholar]
- 18.Evans HE. Miller's Anatomy of the Dog. 3rd ed. Philadelphia: W.B. Saunders; 1993. [Google Scholar]
- 19.Murakami JW, Weinberger E, Shaw DW. Normal myelination of the pediatric brain imaged with fluid-attenuated inversion-recovery (FLAIR) MR imaging. AJNR Am J Neuroradiol. 1999;20:1406–1411. [PMC free article] [PubMed] [Google Scholar]
- 20.Kurokawa H, Fujisawa I, Nakano Y, Kimura H, Akagi K, Ikeda K, Uokawa K, Tanaka Y. Posterior lobe of the pituitary gland: correlation between signal intensity on T1-weighted MR images and vasopressin concentration. Radiology. 1998;207:79–83. doi: 10.1148/radiology.207.1.9530302. [DOI] [PubMed] [Google Scholar]
- 21.Bonneville F, Cattin F, Marsot-Dupuch K, Dormont D, Bonneville JF, Chiras J. T1 signal hyperintensity in the sellar region: spectrum of findings. Radiographics. 2006;26:93–113. doi: 10.1148/rg.261055045. [DOI] [PubMed] [Google Scholar]
- 22.Konar M, Burgener IA, Lang J. Magnetic resonance imaging features of empty sella in dogs. Vet Radiol Ultrasound. 2008;49:339–342. doi: 10.1111/j.1740-8261.2008.00376.x. [DOI] [PubMed] [Google Scholar]
- 23.Ashikaga R, Araki Y, Ono Y, Nishimura Y, Ishida O. Appearance of normal brain maturation on fluid-attenuated inversion-recovery (FLAIR) MR images. Am J Neuroradiol. 1999;20:427–431. [PMC free article] [PubMed] [Google Scholar]
- 24.Barkovich AJ. Concepts of myelin and myelination in neuroradiology. Am J Neuroradiol. 2000;21:1099–1109. [PMC free article] [PubMed] [Google Scholar]
- 25.Martin E, Kikinis R, Zuerrer M, Boesch C, Briner J, Kewitz G, Kaelin P. Developmental stages of human brain: an MR study. J Comput Assist Tomogr. 1988;12:917–922. doi: 10.1097/00004728-198811000-00002. [DOI] [PubMed] [Google Scholar]
- 26.Van der Knaap MS, Valk J. MR imaging of the various stages of normal myelination during the first year of life. Neuroradiology. 1990;31:459–470. doi: 10.1007/BF00340123. [DOI] [PubMed] [Google Scholar]
- 27.Hayakawa K, Konishi Y, Kuriyama M, Konishi K, Matsuda T. Normal brain maturation in MRI. Eur J Radiol. 1991;12:208–215. doi: 10.1016/0720-048x(91)90074-6. [DOI] [PubMed] [Google Scholar]
- 28.Barkovich AJ. MR of the normal neonatal brain: assessment of deep structures. AJNR Am J Neuroradiol. 1998;19:1397–1403. [PMC free article] [PubMed] [Google Scholar]
- 29.Counsell SJ, Maalouf EF, Fletcher AM, Duggan P, Battin M, Lewis HJ, Herlihy AH, Edwards AD, Bydder GM, Rutherford MA. MR imaging assessment of myelination in the very preterm brain. Am J Neuroradiol. 2002;23:872–881. [PMC free article] [PubMed] [Google Scholar]
- 30.Bird CR, Hedberg M, Drayer BP, Keller PJ, Flom RA, Hodak JA. MR assessment of myelination in infants and children: usefulness of marker sites. Am J Neuroradiol. 1989;10:731–740. [PMC free article] [PubMed] [Google Scholar]
- 31.Cowan FM, de Vries LS. The internal capsule in neonatal imaging. Semin Fetal Neonatal Med. 2005;10:461–474. doi: 10.1016/j.siny.2005.05.007. [DOI] [PubMed] [Google Scholar]
- 32.Girard N, Confort-Gouny S, Schneider J, Barberet M, Chapon F, Viola A, Pineau S, Combaz X, Cozzone P. MR imaging of brain maturation. J Neuroradiol. 2007;34:290–310. doi: 10.1016/j.neurad.2007.07.007. [DOI] [PubMed] [Google Scholar]
- 33.Quencer RM. Maturation of normal primate cerebral tissue: computed tomographic-anatomic correlation. Am J Roentgen. 1982;139:561–568. doi: 10.2214/ajr.139.3.561. [DOI] [PubMed] [Google Scholar]
- 34.Kier EL, Truwit CL. The normal and abnormal genu of the corpus callosum: an evolutionary, embryologic, anatomic, and MR analysis. Am J Neuroradiol. 1996;17:1631–1641. [PMC free article] [PubMed] [Google Scholar]
- 35.Prasad AN, Bunzeluk K, Prasad C, Chodirker BN, Magnus KG, Greenberg CR. Agenesis of the corpus callosum and cerebral anomalies in inborn errors of metabolism. Congenit Anom. 2007;47:125–135. doi: 10.1111/j.1741-4520.2007.00160.x. [DOI] [PubMed] [Google Scholar]
- 36.Saunders DE, Thompson C, Gunny R, Jones R, Cox T, Chong WK. Magnetic resonance imaging protocols for paediatric neuroradiology. Pediatr Radiol. 2007;37:789–797. doi: 10.1007/s00247-007-0462-9. [DOI] [PMC free article] [PubMed] [Google Scholar]
- 37.Hittmair K, Wimberger D, Rand T, Prayer L, Bernert G, Kramer J, Imhof H. MR assessment of brain maturation: comparison of sequences. Am J Neuroradiol. 1994;15:425–433. [PMC free article] [PubMed] [Google Scholar]
- 38.Bydder GM, Hajnal JV, Young IR. MRI: use of the inversion recovery pulse sequence. Clin Radiol. 1998;53:159–176. doi: 10.1016/s0009-9260(98)80096-2. [DOI] [PubMed] [Google Scholar]
- 39.Wolansky LJ, Evans A, Belitsis K, Shaderowfsky PD, Gonzales R, Maldjian JA, Lee HJ, Pak J. Fast inversion recovery for myelin suppression (FIRMS). A new MRI pulse sequence for highlighting cerebral gray matter. Clin Imaging. 1996;20:164–170. doi: 10.1016/0899-7071(96)00015-0. [DOI] [PubMed] [Google Scholar]
- 40.Hallam DK. Investigating Epilepsy: CT and MRI in Epilepsy. Nepal Journal of Neuroscience. 2004;1:64–72. [Google Scholar]
- 41.Kizildag B, Dusunceli E, Fitoz S, Erden I. The role of classic spin echo and FLAIR sequences for the evaluation of myelination in MR imaging. Diagn Interv Radiol. 2005;11:130–136. [PubMed] [Google Scholar]
- 42.Bathen-Noethen A, Stein VM, Puff C, Baumgaertner W, Tipold A. Magnetic resonance imaging findings in acute canine distemper virus infection. J Small Anim Pract. 2008;49:460–467. doi: 10.1111/j.1748-5827.2008.00552.x. [DOI] [PubMed] [Google Scholar]
- 43.Wood SL, Patterson JS. Shetland Sheepdog leukodystrophy. J Vet Intern Med. 2001;15:486–493. doi: 10.1892/0891-6640(2001)015<0486:ssl>2.3.co;2. [DOI] [PubMed] [Google Scholar]
- 44.Cheon JE, Kim IO, Hwang YS, Kim KJ, Wang KC, Cho BK, Chi JG, Kim CJ, Kim WS, Yeon KM. Leukodystrophy in children: a pictorial review of MR imaging features. Radiographics. 2002;22:461–476. doi: 10.1148/radiographics.22.3.g02ma01461. [DOI] [PubMed] [Google Scholar]
- 45.Phal PM, Usmanov A, Nesbit GM, Anderson JC, Spencer D, Wang P, Helwig JA, Roberts C, Hamilton BE. Qualitative comparison of 3-T and 1.5-T MRI in the evaluation of epilepsy. Am J Roentgenol. 2008;191:890–895. doi: 10.2214/AJR.07.3933. [DOI] [PubMed] [Google Scholar]
- 46.D'Arceuil HE, de Crespigny AJ, Rother J, Seri S, Moseley ME, Stevenson DK, Rhine W. Diffusion and perfusion magnetic resonance imaging of the evolution of hypoxic ischemic encephalopathy in the neonatal rabbit. J Magn Reson Imaging. 1998;8:820–828. doi: 10.1002/jmri.1880080411. [DOI] [PubMed] [Google Scholar]
- 47.Vermeulen RJ, van Schie PE, Hendrikx L, Barkhof F, van Weissenbruch M, Knol DL, Pouwels PJ. Diffusion-weighted and conventional MR imaging in neonatal hypoxic ischemia: two-year follow-up study. Radiology. 2008;249:631–639. doi: 10.1148/radiol.2492071581. [DOI] [PubMed] [Google Scholar]
- 48.Liauw L, van der Grond J, van den Berg-Huysmans AA, Palm-Meinders IH, van Buchem MA, van Wezel-Meijler G. Hypoxic-ischemic encephalopathy: diagnostic value of conventional MR imaging pulse sequences in term-born neonates. Radiology. 2008;247:204–212. doi: 10.1148/radiol.2471070812. [DOI] [PubMed] [Google Scholar]
- 49.Liauw L, van Wezel-Meijler G, Veen S, van Buchem MA, van der Grond J. Do apparent diffusion coefficient measurements predict outcome in children with neonatal hypoxic-ischemic encephalopathy? Am J Neuroradiol. 2009;30:264–270. doi: 10.3174/ajnr.A1318. [DOI] [PMC free article] [PubMed] [Google Scholar]


