Abstract
Computational fluid dynamics (CFD) studies provide a valuable tool for evaluating the role of hemodynamics in vascular diseases such as cerebral aneurysms and atherosclerosis. However, such models necessarily only include isolated segments of the vasculature. In this work, we evaluate the influence of geometric approximations in vascular anatomy on hemodynamics in elastase induced saccular aneurysms in rabbits. One representative high aspect ratio (AR—height/neck width) aneurysm and one low AR aneurysm were created at the origin of the right common carotid artery in two New Zealand white rabbits. Three-dimensional (3D) reconstructions of the aneurysm and surrounding arteries were created using 3D rotational angiographic data. Five models with varying extents of neighboring vasculature were created for both the high and low AR cases. A reference model included the aneurysm sac, left common carotid artery (LCCA), aortic arch, and downstream trifurcation/quadrification. Three-dimensional, pulsatile CFD studies were performed and streamlines, wall shear stress (WSS), oscillatory shear index, and cross sectional velocity were compared between the models. The influence of the vascular domain on intra-aneurysmal hemodynamics varied between the low and high AR cases. For the high AR case, even a simple model including only the aneurysm, a small section of neighboring vasculature, and simple extensions captured the main features of the steamline and WSS distribution predicted by the reference model. However, the WSS distribution in the low AR case was more strongly influenced by the extent of vasculature. In particular, it was necessary to include the downstream quadrification and upstream LCCA to obtain good predictions of WSS. The findings in this work demonstrate the accuracy of CFD results can be compromised if insufficient neighboring vessels are included in studies of hemodynamics in elastase induced rabbit aneurysms. Consideration of aspect ratio, hemodynamic parameters of interest, and acceptable magnitude of error when selecting the vascular domain will increase reliability of the results while decreasing computational time.
Keywords: aneurysms, animal models, parent vasculature, hemodynamics, CFD, wall shear stress
1 Introduction
The rupture of intracranial aneurysms represents the leading cause of devastating, spontaneous subarachnoid hemorrhage [1]. The physiologic and hemodynamic mechanisms of initiation, growth, and rupture of saccular aneurysms remain unclear. However, hemodynamic factors such as wall shear stress (WSS), wall shear stress gradient, oscillatory shear index (OSI), and particle residence time are believed to be important in pathologies of the arterial wall and potentially play an important role in aneurysm pathophysiology [2–7]. The measurement of these hemodynamic factors in vivo is challenging but computational fluid dynamics (CFD) modeling can be used to estimate the hemodynamics in the cerebral vascular system [8–12].
In order to better understand the pathophysiology of cerebral aneurysms and design effective clinical treatments to enhance the likelihood of stabilization, it is necessary to evaluate the in vivo response of the aneurysm wall to intra-aneurysmal hemodynamic stresses. A number of animal models have been created for studying aneurysm pathogenesis [13–15]. One such animal model is an elastase induced aneurysm model in rabbits [16]. In this model, saccular aneurysms are created by elastase infusion in, and distal ligation of, the right common carotid artery (RCCA). The hemodynamic features of this animal model have been shown to lie within the normal range for human aneurysms [17]. This model has been used to evaluate the performance of endovascular devices and evaluate changes in histology after device implantation [18–21]. The rabbit model has also been used to study the correlation of altered expression of extracellular matrix and vascular remodeling molecules with areas of low shear [22,23]. For example, expression of vascular cell adhesion molecule-1 (VCAM-1) was shown to be upregulated in aneurysms at both 2 and 12 weeks after aneurysm creation. These results are consistent with results reported by Mohan et al. [24] in which prolonged exposure of human aortic endothelial cells to low shear stress was associated with increased expression of VCAM-1.
To better understand the coupling between hemodynamics and biological response within aneurysms and to evaluate flow devices, accurate estimates of flow in and around the model aneurysms are needed. The relationship between the flow field, resulting WSS in the aneurysm cavity, and the associated vascular morphology can then be confidently investigated.
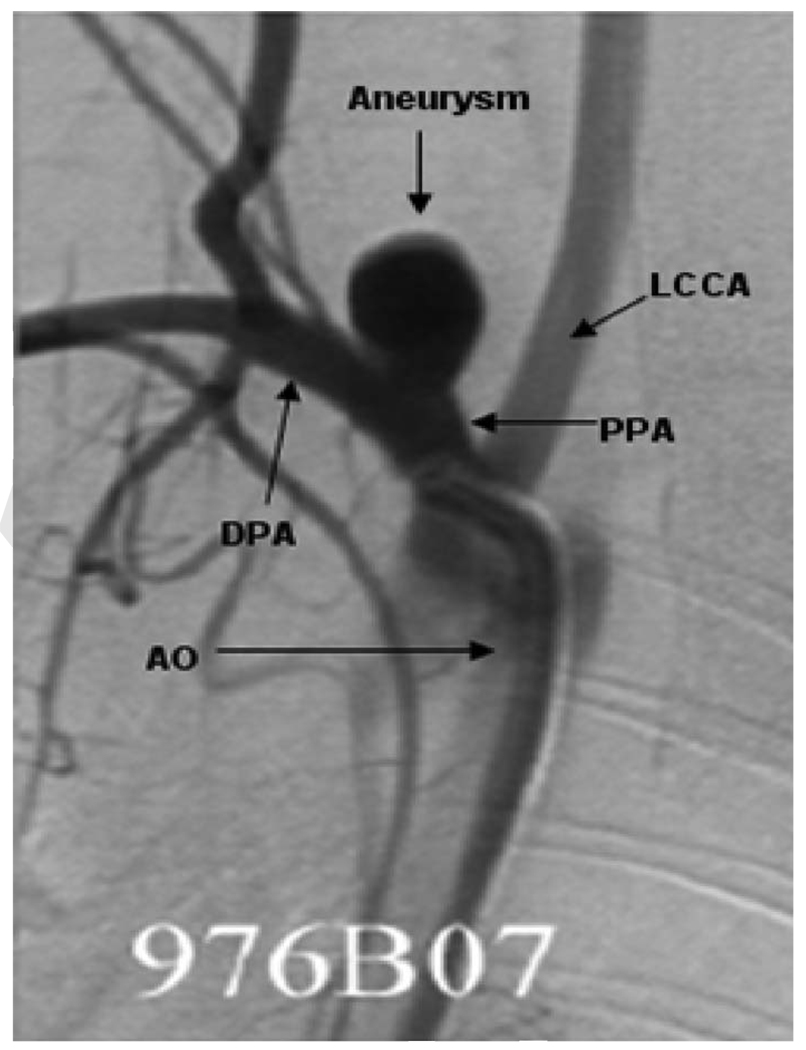
By using high quality computed tomography (CT), magnetic resonance imaging (MRI), or 3D angiographic images, case-specific CFD models can be constructed and used to obtain estimates of detailed flow characteristics in the cerebral vasculature [4,8–11]. To construct the computational model, a certain vascular domain around the aneurysm site must be selected and proper boundary conditions applied. However, aneurysms are usually associated with complex arterial anatomy and the extent of the surrounding vasculature that should be included in CFD models to optimize flow estimates remains unknown. Inclusion of surrounding vessels that do not impact estimated flow will result in needless computational effort while exclusion of vessels that would alter flow estimates will degrade the accuracy of CFD results. For elastase induced aneurysms formed from the RCCA [25], upstream and downstream bifurcations are in close proximity to the aneurysm cavity, Fig. 1. For this type of model aneurysm, casual selection of the extent of the model geometry may lead to unreliable local CFD results in and around the aneurysm cavity or, conversely to consumption of excessive computational resources.
Fig. 1.
Two-dimensional, anteroposterior subclavian artery angiogram with arrows indicating the surrounding vasculature: LCCA, PPA, DPA, AO, and aneurysm
The central goal of this work is to study how the computed hemodynamic factors within the aneurysm cavity change as a result of varying the complexity and extent of the nearby vasculature. In this study, we evaluate the sensitivity of the hemodynamics to extent of vasculature using CFD outputs for various parent artery anatomies. We include two specific aneurysm morphologies—low and high aspect ratio (AR, the ratio of aneurysm height to neck width) aneurysms, considered by many investigators to be at different risk for spontaneous rupture [26–29]. We apply five separate models of upstream and downstream anatomies to these two aneurysm geometries. Quantitative and qualitative analysis of changes in estimated intra-aneurysmal hemodynamics as a function of peri-aneurysm anatomy offer insight into the sensitivity of CFD outputs to different choices of computational domain.
2 Materials and Methods
2.1 Aneurysm Creation
Saccular aneurysms were created in New Zealand white rabbits (bodyweight, 3–4 kg) using a previously reported protocol that was approved by the animal review committee at our institution. Briefly, using a balloon catheter, porcine elastase (Worthington Biochemical Corporation, NJ) was incubated within the lumen of the proximal RCCA for 20 min after which the balloon was deflated and catheter system was removed. The RCCA was then ligated at its midportion. Dilated, arterial segments thus formed from the stump of the RCCA, are termed “aneurysms” for the purpose of this work [30,31].
2.2 Imaging Procedure and Data Acquisition
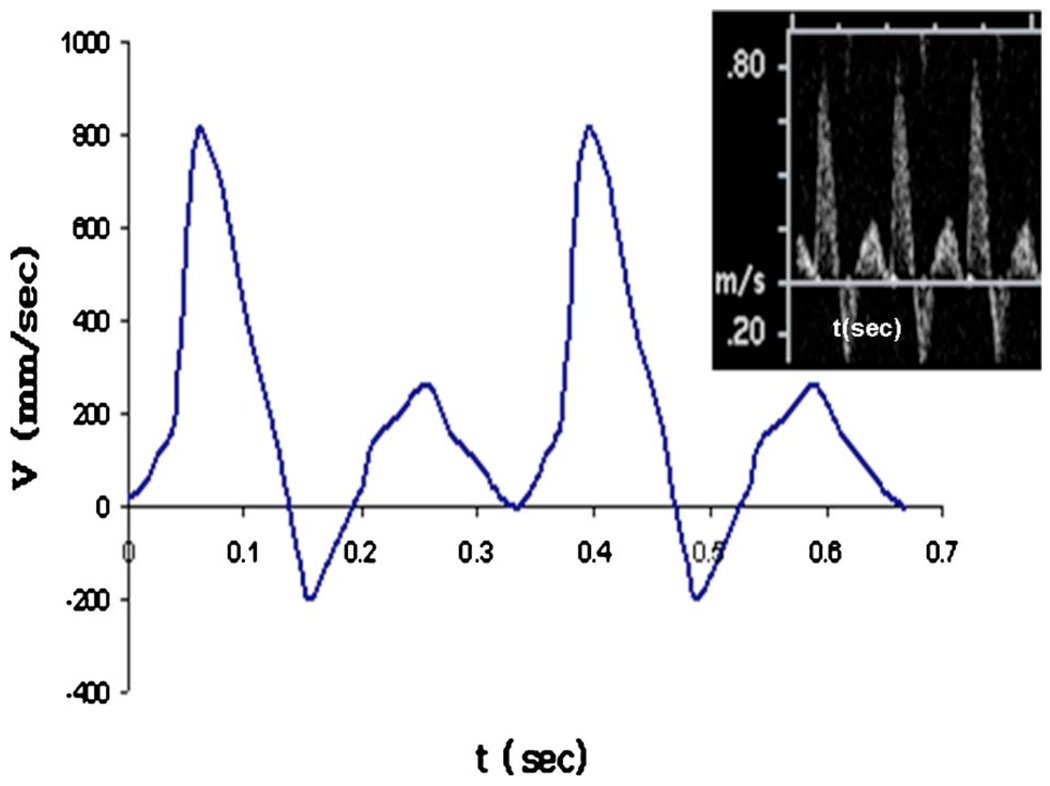
Three-dimensional rotational angiography (3DRA) was performed 12 weeks after aneurysm creation. After femoral artery cut down and sheath placement, a 5 Fr catheter was placed into the aortic arch (AO). During infusion of iodinated contrast, 3DRA was performed. In a separate setting, transthoracic duplex Doppler ultrasound imaging (ACUSON Sequoia 512 machine with a 15L8 transducer, Siemens Medical Solutions, Erlangen, Germany) was performed for these same aneurysms and arterial waveforms (Fig. 2) were obtained within distal parent arteries (DPAs) and left common carotid arteries (LCCA).
Fig. 2.
Raw Doppler velocimetry waveform (upper right) and corresponding idealized waveform used in computational studies (case 976)
2.3 Anatomical Models
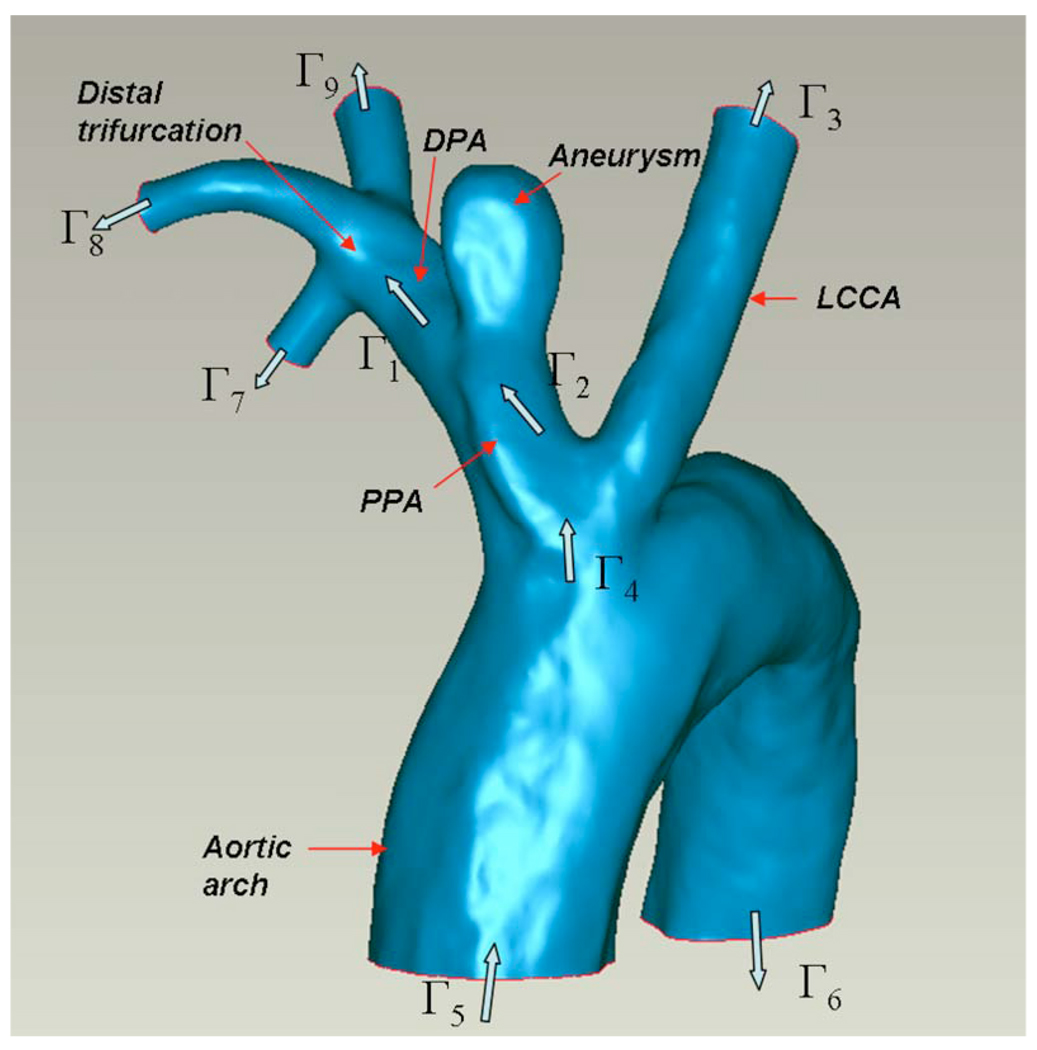
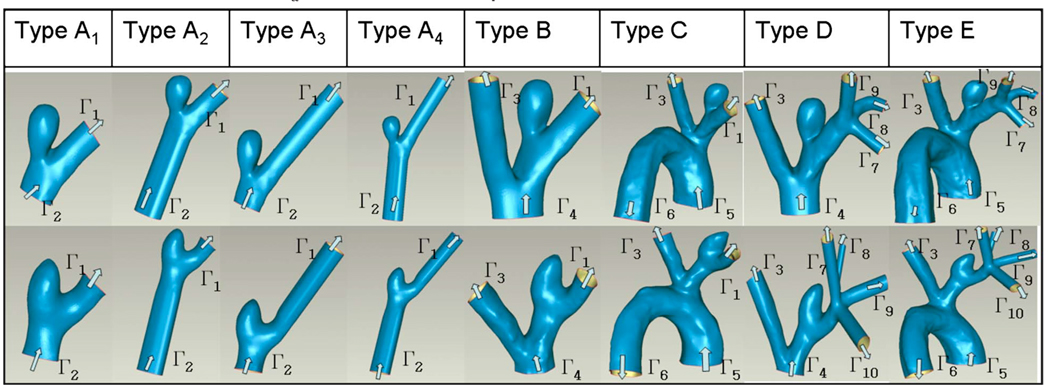
The 3DRA data were used to construct 3D models of the interior surface of the vasculature using a commercial package (MIMICS; Materialise, Leuven, Belguim). Geometric measurements including aneurysm height (H: distance from neck cross section to aneurysm apex), neck width (N: hydraulic diameter of neck cross section), and aneurysm diameter (D: largest hydraulic diameter along the centerline of the aneurysm sac) were taken from the 3D reconstructed models. A 3D reconstruction of the complete set of vessels considered for the high AR case (AR=2.1) is shown in Fig. 3. The structure of the neighboring vessels for the low AR case (AR=1.0) is similar to that shown in Fig. 3 with the exception that the distal trifurcation is replaced by a quadrification for the low AR model. For both the low and high AR cases, models of four distinct vascular subregions denoted as models A–E were created in order to explore the importance of the various vessels surrounding the aneurysm (Table 1). Model A is the smallest subregion including only the aneurysm, the proximal parent artery (PPA), and the DPA. Model B includes the LCCA in addition to the model A vessels. Model C is composed of the model B vessels and the aortic arch. Model D includes the distal trifurcation (quadrification in the low AR case) as well as the model B vessels. Model E is the most complete model consisting of the model D geometry and the aortic arch and was used as the reference model. To evaluate the role of vessel extensions, four variations in model A were considered and are denoted A1–A4 (Table 1). Model A1 consists of the native aneurysm, PPA, and DPA. Models A2, A3, and A4 are composed of the submodel A1 as well as straight vessel extensions of the PPA, DPA, and both PPA and DPA, respectively. The extensions have the same cross sectional shape as the native vessel at the corresponding surfaces of A1 with length three times the effective diameter. This length was chosen because of the invariance in results to longer extensions. In order to generate a structured brick element mesh in models B and D, it was necessary to add a half diameter length extension proximal to Γ4 of these models.
Fig. 3.
3D reconstruction of vascular domain used for high AR model E; inlet/outlet cross sections for model E and various submodels are labeled as Γα
Table 1.
Model geometry and computational domains for high AR (upper row) and low AR (lower row) cases: arrows indicate the flow directions and Γα indicate different computational domain boundaries
 |
2.4 CFD Analysis
The blood flow in the reconstructed models was simulated based on the unsteady, 3D Navier–Stokes equations, using the finite element method with ADINA software (64 bit) (ADINA R&D Inc., Watertown, MA). The blood was modeled as a Newtonian fluid with constant density and viscosity chosen as ρ=1050 kg/m3 and μ=3.5 mPa s, respectively. The time varying boundary conditions on the computational domain are given below. To attain highly accurate computational results, the finite element mesh was composed of hexahedral (brick) elements. The mesh density was chosen such that the change in maximum WSS upon doubling that density was less than 3%. The resulting number of elements ranged from 15,000 to 85,000 in the various models.
The CFD analyses were performed for each model for a period of two cardiac cycles using 100 time steps per cycle. The simulations were done using a 3 GHz dual Xeon processor work station with 4 GB of memory (upgraded to 8 GB for model E).
2.5 Boundary Conditions
The vessel wall was idealized as rigid and the no-slip boundary condition was applied to the walls of all models. In this work, three types of inlet and outlet conditions were applied at surfaces labeled Γ1–Γ10 in Fig. 3 and Tables 1 and 2.
Table 2.
Inflow and outflow conditions used in computational studies; FOW denotes “first order Womersley” velocity profile, MT denotes “modified traction” condition, and TVU stands for “time varying uniform” velocity profile
| Γ1 | Γ2 | Γ3 | Γ4 | Γ5 | Γ6 | Γ7 | Γ8 | Γ9 | Γ10 | |
|---|---|---|---|---|---|---|---|---|---|---|
| Model A | FOW | MT | -- | -- | -- | -- | -- | -- | -- | -- |
| Model B | FOW | -- | FOW | MT | -- | -- | -- | -- | -- | -- |
| Model C | FOW | -- | FOW | -- | TVU | MT | -- | -- | -- | -- |
| Model D | -- | -- | FOW | MT | -- | -- | TVU | TVU | TVU | TVU (low AR) |
| Model E | -- | -- | FOW | -- | TVU | MT | TVU | TVU | TVU | TVU (low AR) |
We approximate the velocity field at the outlet of a number of the vessels (boundaries Γ1 and Γ3) with a first order Womersley approximation (FOW), implemented using a biquadratic function with velocity specified at surface vertex and mid/internal grid points (implemented in ADINA spatial functions). The FOW is the pulsatile velocity field corresponding to a steady plus first order term (fundamental frequency) of the exact solution for fully developed, pulsatile flow in a straight pipe of circular cross section (e.g., Ref. [32]). It is mapped to the noncircular vessel cross section. From the intravascular duplex Doppler measurements at boundaries Γ1 and Γ3, the shape of pulsatile waveform was noted to be similar in each model although the magnitude differed. For this reason, a standard time varying shape was used and an animal specific maximum velocity was chosen at the appropriate location (Fig. 2).
The velocity profile in arteries leaving the heart has been reported to be closer to a time varying uniform (TVU) profile than a parabolic profile [33,34]. For this reason, we apply TVU conditions at the inlet of models C and E (Tables 1 and 2). Doppler measurements could not be made in this location so a parametric study was performed. A base time averaged volumetric flow rate Q5 was chosen proportional to the cross section area at Γ5. Studies were then performed with Q5 increased and decreased by 50% to examine the sensitivity of the hemodynamic results to this value. The same standard time varying waveform was used as for the FOW conditions.
At other cross sections, the velocity has a more complex dependence on cross sectional position and is not well approximated as either FOW or TVU. At these locations, we applied the so called “do nothing” boundary condition using a modified stress tensor, which has the same divergence as the Cauchy stress tensor
| (1) |
In Eq. (1), p is the mechanical pressure, vi are the rectilinear components of the velocity vector v̠, and T′ij are the components of the modified stress tensor. We have employed standard indicial notation in Eq. (1). The modified stress vector is specified to be parallel to the local normal [35]
| (2) |
where ni are the components of the outward normal to surface Γα and C is a prescribed constant. Here, α corresponds to 2, 4, and 6 for models A, B/D, and C/E, respectively, Table 1. For our rigid wall model, this constant can be set to zero without any loss in generality of the results. From a physical perspective, the modified traction (MT) condition given in Eq. (2) is preferable over specifying the Cauchy stress vector to be constant, which violates even the Womersley solution. For a comparison of condition (2) with other inflow/outflow conditions see Ref. [36]. A discussion of physical anomalies arising when the usual Cauchy stress vector rather than the modified stress vector is specified at outflow boundaries is given in Ref. [37].
The TVU condition was also applied at the trifurcation surfaces, Γ7–Γ9 (high AR), and quadrification surfaces Γ7–Γ10 (low AR model). The trifurcation/quadrification is a more complete outflow vasculature for models A–C. Therefore, for consistency with these models, the sum of the flow rates through the trifurcation/quadrification in models D and E was specified to match that for outflow surfaces Γ1 in models A–C. For example, Q7 + Q8 + Q9=Q1 for the high AR model. The flow rate division among Γ7–Γ9 (high AR) and Γ7–Γ10 (low AR) was specified such that the WSS was equal in these branches [38]. For these conditions, the WSS was approximated as 4μQ/πR3, where and A is the cross sectional area. Thus the velocity magnitude |v̠| for the uniform profile can be calculated as |v̠|=Q/A. The inflow and outflow conditions for all models at the relevant computational surfaces are given in Table 2.
From a mathematical perspective, the combinations of inflow and outflow conditions chosen for our models, Table 2, generate problems which are well posed. In particular, local existence and uniqueness can be shown for small data for both steady and unsteady cases [39,40].
2.6 Hemodynamic Parameters
Using the parameters given above, the time averaged Reynolds number at the PPA region ranged from 200 to 400. The Womersley number, defined as [41]
| (3) |
ranged from 3 to 5 based on the PPA radius, where R is the vessel radius and f is the fundamental frequency of the pulsatile waveform (hertz).
Here, the projection of the Cauchy stress vector on the arterial surface will be denoted as τ̠w. The time averaged value of the magnitude of τ̠w over a period of one cardiac cycle will be denoted as WSS. While there is no clear demarcation of normal and abnormal WSS levels, the values between 1.0 and 7.0 Pa are typically considered normal in human arteries while those above 7.0 Pa and below 0.4 Pa are believed to be pathological [7].
To study the shear stress characteristics associated with pulsatile loading, the OSI was calculated using
| (4) |
where T is the period of one cardiac cycle [42].
The contours of velocity magnitude are obtained for cross sectional slices perpendicular to the centerline and one diameter upstream from the aneurysm neck (same location for every model) in order to better understand the effect of domain truncation on flow into the aneurysm region.
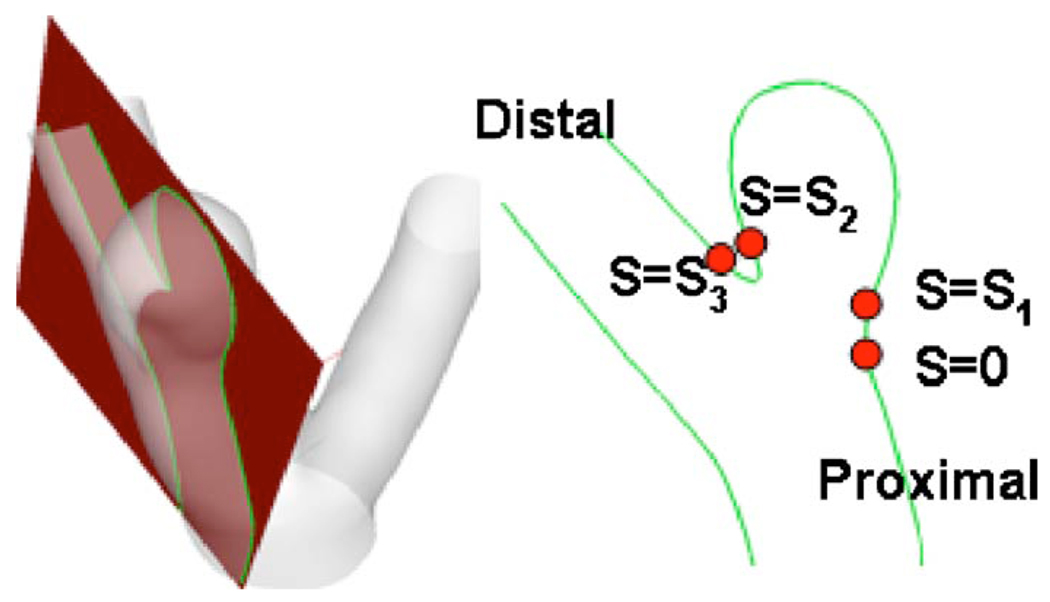
For quantitative comparison between models, the WSS distribution was extracted along a representative curve in all models. This curve is the intersection of the lumen surface with the intersection plane shown in Fig. 4. The curve extends from the proximal neck (position s=0) to distal neck (position s=s3) (Fig. 4). To further quantify the comparison between models, the spatial average of the WSS error relative to model E was calculated along these curves in aneurysm sac region as follows:
| (5) |
where ds is the infinitesimal arc length along the curve, WSSE denotes the WSS at the corresponding point in model E. The error is calculated in the sac, which extends from s=s1 to s=s2, where (s1, s2)=(2 mm, 12 mm) for the high AR model and (2mm, 9mm) for the low AR model. This error was also reported normalized by a representative parent artery WSS value of 1.2 Pa to obtain the percentage differences of error for each model.
Fig. 4.
Schematic view of intersecting plane used for error analysis, the cross section plane (left), and the resulting intersecting curve (right)
3 Results
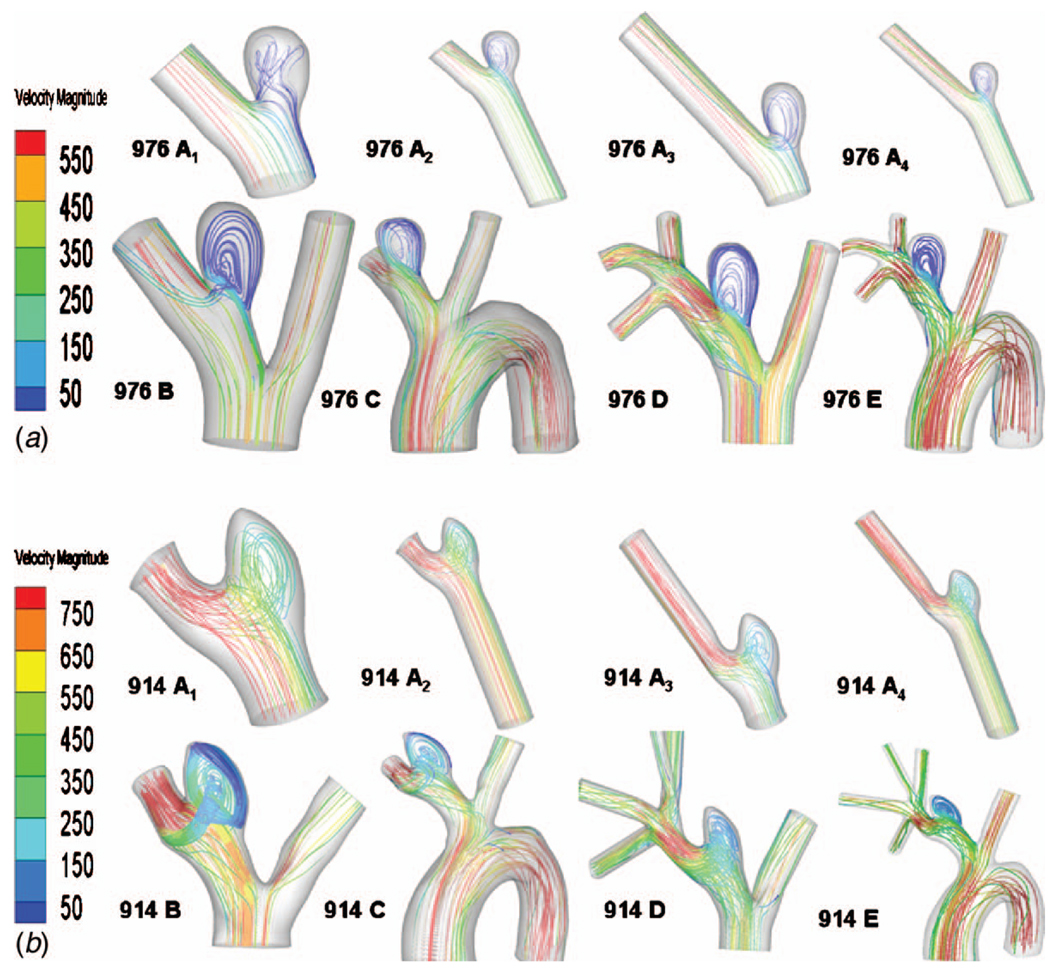
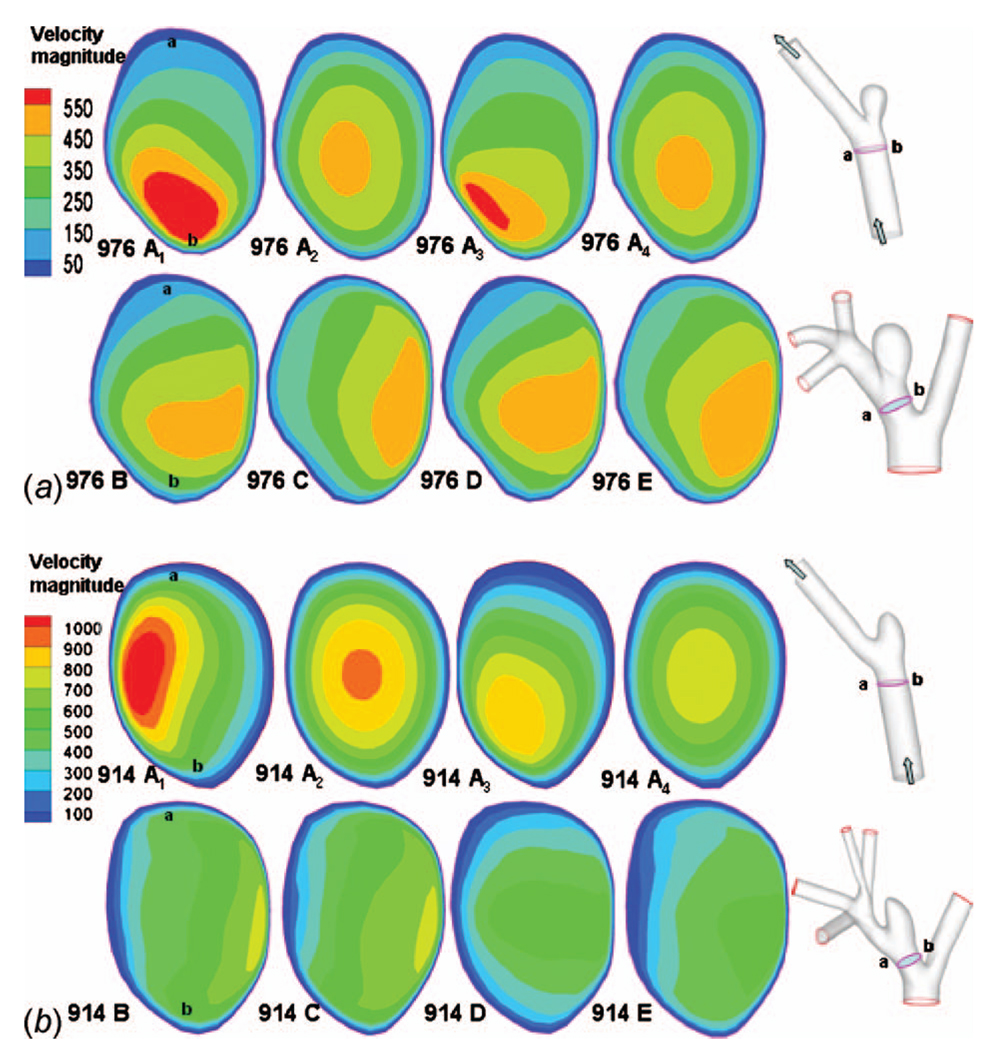
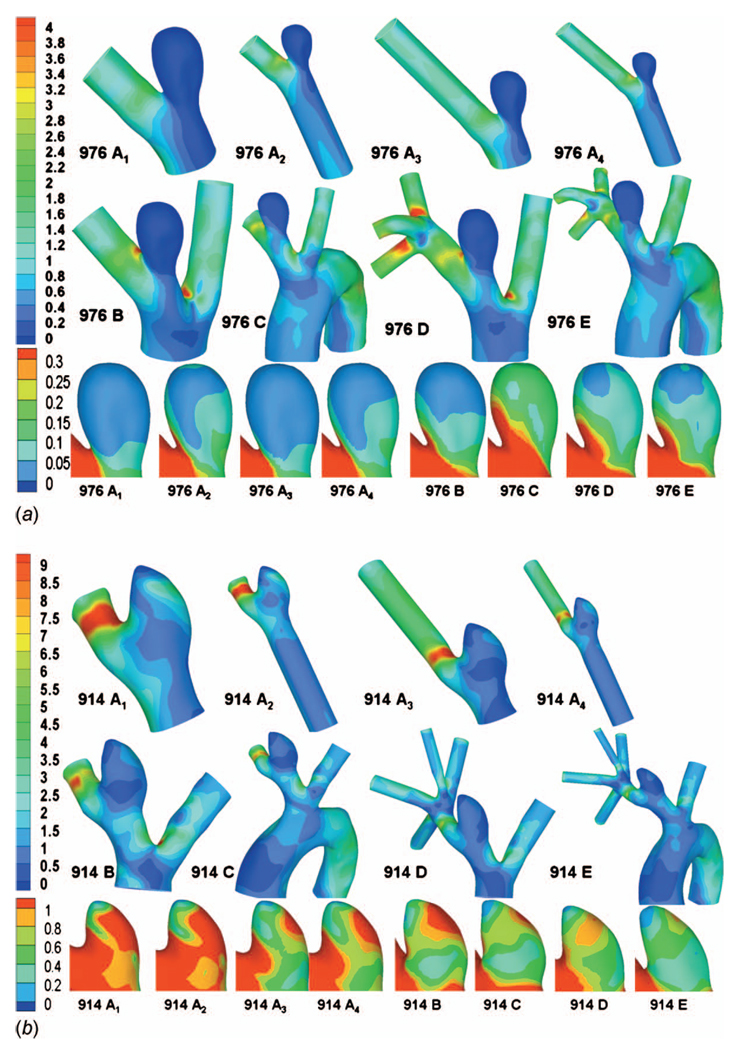
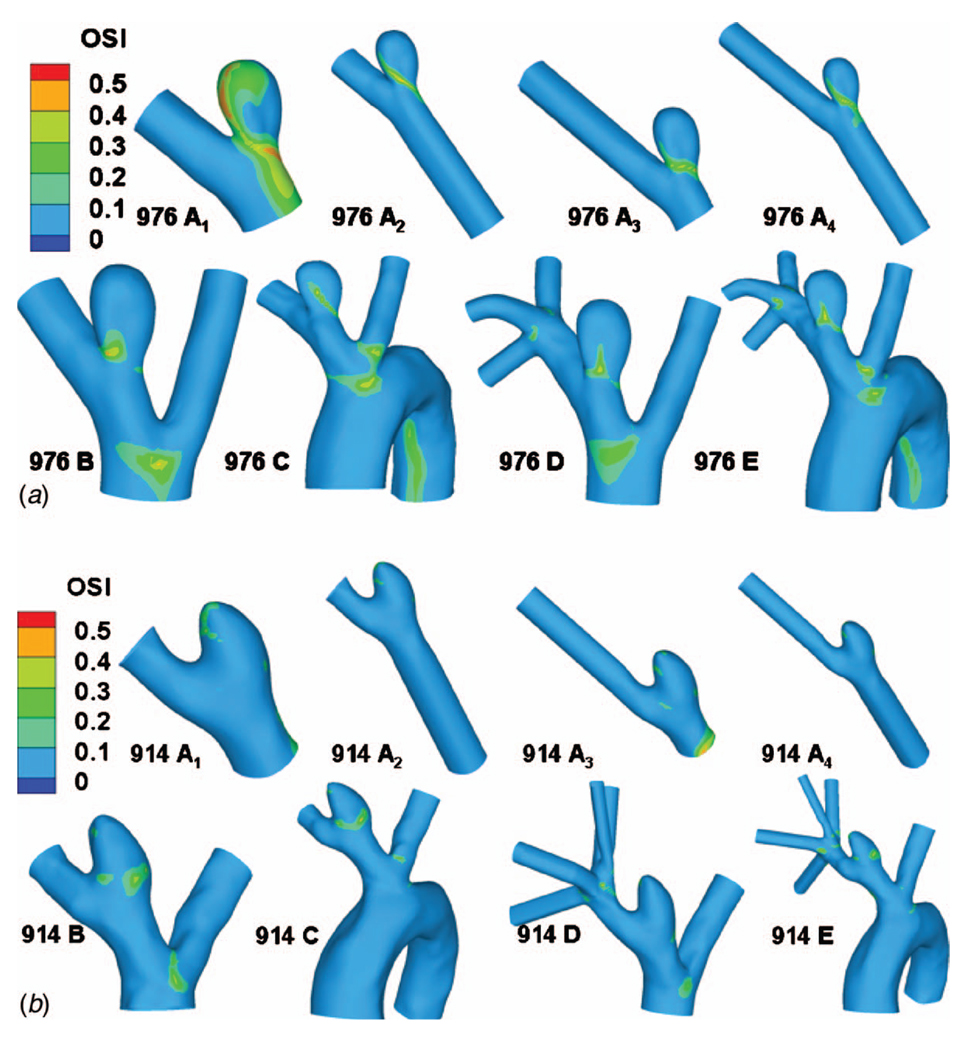
The computational results for streamlines, WSS, OSI, and contours of velocity magnitude for each model have been calculated and are shown in Figs. 5–10. In Table 3, the results for the streamlines, the WSS, and the OSI are then categorized as similar (S) or not similar (NS) to model E to provide a succinct summary of the comparison between models. The computational run times for the models are given in Table 4, and the errors along the intersecting curves are given in Table 5.
Fig. 5.
Streamlines for all models: (a) high AR case and (b) low AR case; color of the streamlines indicates the velocity magnitude (mm/s)
Fig. 10.
Contours of magnitude of velocity (mm/s) at systole in cross sectional slices of the PPA: (a) high AR case and (b) low AR case; a and b in column one indicate the orientation of cross sections in the schematics at the right
Table 3.
Summary of results for the comparison of results for models A–D with reference model E: NS denotes not similar, S denotes similar
| Hemodynamic features in the sac | A1 | A2 | A3 | A4 | B | C | D | |
|---|---|---|---|---|---|---|---|---|
| High AR case | WSS | NS | S | NS | S | S | NS | S |
| OSI | NS | S | S | S | S | S | S | |
| Streamlines | NS | S | S | S | S | S | S | |
| Velocity contour | NS | NS | NS | NS | S | S | S | |
| Low AR case | WSS | NS | NS | NS | NS | NS | NS | S |
| OSI | NS | NS | NS | NS | S | S | S | |
| Streamlines | S | S | S | S | NS | NS | S | |
| Velocity contour | NS | NS | NS | NS | NS | NS | S |
Table 4.
Number of elements and computational time used for different model types
| Model type | A1 | A2 | A3 | A4 | B | C | D |
|---|---|---|---|---|---|---|---|
| Element quantity | 15,000 | 20,000 | 20,000 | 25,000 | 26,000 | 40,000 | 70,000 |
| Computational time (h) | 12 | 16 | 16 | 22 | 25 | 60 | 100 |
Model E has 85,000 elements and took approximately 90 h to complete after the computer was upgraded to 8 GB memory. It could not be studied without this increase in memory.
Table 5.
Spatially averaged magnitude of WSS error (relative to model E) along curves formed by lumen surface and intersecting plane of the aneurysm sac region (Fig. 4) (units in pascal) and percentage difference of the error normalized by parent artery WSS
| A1 | A2 | A3 | A4 | B | C | D | |
|---|---|---|---|---|---|---|---|
| High AR (976) case ε (Pa) | 0.0412 | 0.0123 | 0.0501 | 0.0084 | 0.0236 | 0.0847 | 0.0031 |
| Percentage error, normalized by parent artery WSS (%) |
3.4 | 1.0 | 4.2 | 0.7 | 2.0 | 7.1 | 0.3 |
| Low AR (914) case ε (Pa) | 1.5352 | 1.3790 | 0.8021 | 0.5843 | 0.4153 | 0.2250 | 0.1354 |
| Percentage error, normalized by parent artery WSS (%) |
130 | 115 | 67 | 49 | 35 | 19 | 11 |
3.1 Model E (Reference Model)
Model E includes the most extensive vasculature and is used as a reference model to evaluate all other models.
3.2 Model D
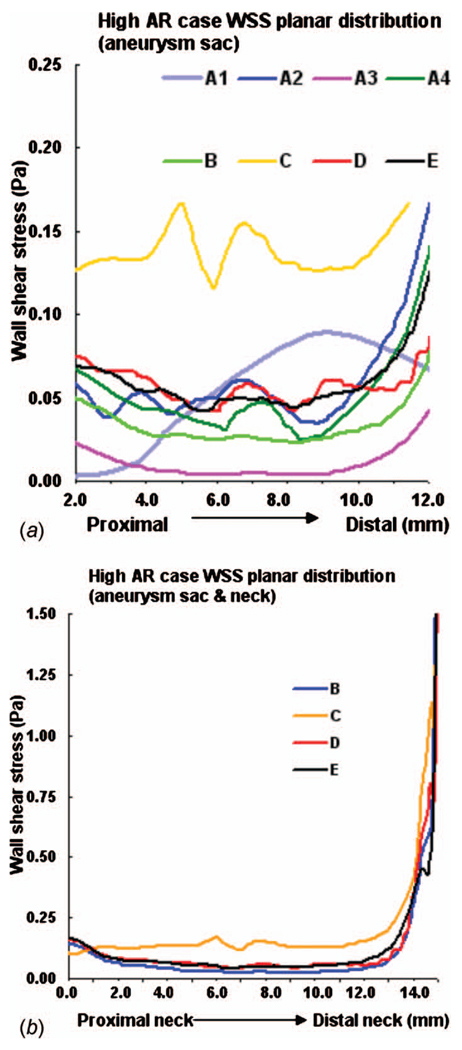
By comparing the results for model D with reference model E, we can analyze the effects of truncating the aortic arch from the computational domain. For the high AR case (976), there is very good agreement in streamlines, WSS, OSI, and velocity magnitude in the aneurysm sac (Figs. 5(a), 6(a), 9(a), and 10(a)). The WSS distribution in the sac region of the high AR model D is quantitatively and qualitatively similar to model E (Figs. 6(a) and 7). The error ε for model D is 0.0031 Pa and the error relative to a representative parent value of 1.2 Pa is less than 0.3%, Table 5.
Fig. 6.
WSS contours for all models: (a) high AR case and (b) low AR case; unit in pascal
Fig. 9.
Contours of OSI: (a) high AR case and (b) low AR case
Fig. 7.
WSS along intersecting curve for high AR case: (a) entire aneurysm region (sac and neck, models B–E) and (b) aneurysm sac only (models A–E)
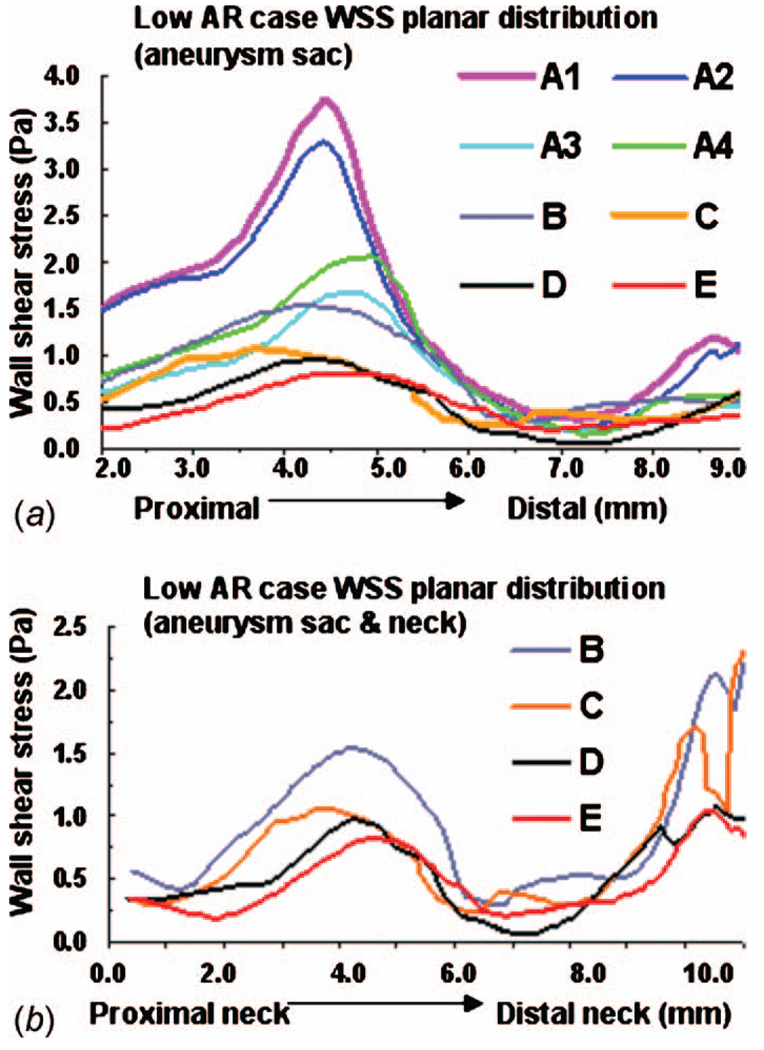
For the low AR case (914), the truncation of the aortic arch in model D generates some minor differences with model E. Little difference is seen in cross sectional velocity contours (Fig. 10(b)) but the magnitude of velocity in the sac at the proximal wall is increased in model D compared with model E (Fig. 5(b)). The WSS distributions are qualitatively similar in models D and E of the low AR models with respect to the location of the maximum and minimum although the WSS is slightly elevated in model D at the proximal sac (Figs. 6(b) and 8). Specifically, the error ε is 0.1354 Pa (11%) in this case. While model D correctly predicts the absence of elevation in OSI throughout the low AR aneurysm sac, the region of elevated OSI at the proximal neck of model E (Fig. 9(b)) is shifted.
Fig. 8.
WSS along intersecting curve for low AR case: (a) entire aneurysm region (sac and neck, models B–E) and (b) aneurysm sac only (models A–E)
3.3 Model C
A comparison of results for models C–E for both high and low AR cases shows the inclusion of the downstream trifurcation (quadrification) is more important than the inclusion of the aortic arch (Figs. 5–10). In particular, although the qualitative distribution is similar across the three models, the WSS magnitude is markedly higher in model C than in models D and E (Figs. 6–8). Furthermore, ε increased to 0.0847 Pa (7.1%) in the high AR model and to 0.2250 Pa (19%) in the low AR model. The increased error in WSS for the low AR model C is likely due to the error in velocity profile upstream of the sac (Fig. 10(b)). The general structure of the streamlines in the sac is similar across all three models, Fig. 5. There are only minor differences in the OSI patterns (Fig. 9(b)) between model C and model E. In particular, model C predicts the region of elevated OSI at the neck of model E. For the high AR case, the velocity contours upstream of the aneurysm are quite similar to those of model E with respect to maximum and general distribution. The maximum is elevated in the low AR case, Fig. 10(b).
3.4 Model B
The error in employing a simple model in which both downstream trifurcation/quadrification and upstream aortic arch are removed can be evaluated by comparing model B with model E. The general structure of the streamlines is similar for the high AR case but differs slightly for the low AR case (Fig. 5). In the low AR case, the streamlines have a pronounced out of plane structure. For the high AR case, the WSS is in general slightly lower than in model E, (Figs. 6(a) and 7) although the error is less than for model C (Table 5). For example, the error is 2.0% for model B and 7.1% for model C. In contrast, for the low AR case, model B has an elevated WSS value (Figs. 6(b) and 8) resulting in an error of approximately 35% for model B compared with 19% for model C and 11% for model D. The velocity contours of model B are quite similar to model C for both cases, displaying the same error in magnitude relative to model E for the low AR case.
3.5 Model A
The vasculature contained in model A is vastly reduced compared with model E, containing none of the upstream and downstream branching. Because of the simplicity of this model, upstream and downstream extensions were also included in an effort to diminish the impact of the imposed inlet and outlet conditions. Despite the simplicity of model A, with the exception of the high AR model A1, the streamlines for models A1–A4 are similar to those of model E (Fig. 5). In these models, the fluid can be seen to enter the aneurysm at the distal neck and circulate in a single vortex before exiting the sac. In contrast, in high AR model A1, the flow enters the aneurysm sac through a larger region of the neck after which the flow is diverted to both proximal and distal sides of the sac.
Of the four models, A2 and A4 best approximate the WSS for the high AR case. In fact, the error ε along the intersecting curve is less than for models B and C although greater than D (Table 5). However, the region of elevated WSS at the distal neck in the sac of the high AR model E (Fig. 6(a)) is not seen in models A1 and greatly reduced in models A2, A3, and A4. For the WSS prediction in the low AR case, models A1 and A2 perform the worst while the errors in models A3 and A4 are closer to that seen in models B and C (Figs. 6(b) and 8 and Table 5). The elevated OSI at the neck of high AR model E is seen in models A2–A4 although it differs in distribution, Fig. 9(a). For the low AR case, regions of elevated OSI are seen at the neck of models A1–A4 but shifted and diminished in size compared to the distribution in model E. The high AR models with inlet extension (A2 and A4) have upstream velocity contours most similar to those of model E with respect to distribution and maximum, Fig. 10(a). For the low AR case, the PPA cross section velocity magnitude is elevated in all models A1–A4. While A4 provides the closest overall match of results to those of model E, there is little improvement in run time for model A4 compared with model B, Table 4.
3.6 Further Evaluation of Model Conditions and Idealizations
As noted in Sec. 2.5, the flow rate into the arch for models C and E could not be measured, so was chosen to be proportional to the cross section area at Γ5. This sensitivity of the solution to this condition was evaluated by reanalyzing the flow in model C with the volumetric flow rate Q5 increased and decreased from this value by 50%. The flow rates prescribed at outflow boundaries Γ1 and Γ3 were maintained at the same measured values for all three runs. The WSS distribution in the aneurysm was not visibly changed and the maximum WSS magnitude changed less than 5%. Results with the baseline value of Q5 of model C are shown in Figs. 5–10.
Necessarily, there is a limit to the extent of the downstream domain, which can be included in the computational model. The most extensive downstream vasculature was used in models D and E, which included the downstream trifurcation/quadrification. To further evaluate this choice, we analyzed results for model D with extensions on the outlets of these downstream vessels. Since the flow in the sac of the low AR model was found to be more sensitive to other changes in vasculature, this model was considered. The spatial average WSS along the intersecting curve in the sac region changed less than 1% with the addition of these extensions.
4 Discussion
The current study evaluated the influence of the extent of the computational domain on calculated hemodynamic features within saccular aneurysms in an animal model. If only a bulk measurement of WSS magnitude in the aneurysm sac is of interest, it is sufficient to consider even the simplest model with inlet and outlet extensions (model A4). For example, the high AR model A4 correctly predicts the WSS to be pathologically low through almost the entire aneurysm sac and correctly predicts the minimum at the dome and maximum at the distal neck. Model A4 is less effective for the low AR case, it correctly predicts the locations of the maximum and minimum WSS in the aneurysm sac, however, the magnitude is elevated in general. With the advent of more localized measurements of biological function it is often desirable to have reliable local estimates of these hemodynamics (e.g., Ref. [43]). In these cases, more exacting criteria must be used for model selection and more extensive vasculature is required.
Our results have shown the level of sensitivity of local values of WSS and OSI to the extent of model geometry depends strongly on the aspect ratio. For the high AR model, WSS and OSI results are fairly similar among models A2, A4, B, D, and E with model D giving the most accurate reproduction of results for WSS. Namely, our results suggest that removing the aortic arch is suitable for high AR studies, yielding errors in WSS of 2% or less along the intersecting curve for all these models. Using simple models for the high AR studies results in substantial savings in computational time. For example, model A4 requires 78% less computational time than model D, Table 4.
The low AR hemodynamic results were much more sensitive to the inclusion of surrounding vasculature. If a reliable estimate of local values of WSS is needed, model D is the clear choice yielding an error along the intersecting curve of less than 11% for the aneurysm sac region. Model D correctly captures the location of the maximum and minimum in WSS. Unlike the high AR model, the low AR model A4 does not provide a reasonable quantitative prediction of the WSS distribution. There is little motivation for using model C rather than model D with respect to WSS results. Although the runtime dropped by 40%, the error in spatially averaged WSS in the sac increased from 11% to 19% in the low AR case and from 0.3% to 7.1% in the high AR case. Namely, inclusion of the downstream vasculature was more important than inclusion of the aortic arch for WSS results in both the low and high AR models. This is likely due to the close proximity of the downstream branches to the aneurysm sac.
If OSI is of interest, then it is particularly important to clarify the conditions necessary for a model to be suitable. For example, in the high AR case, all models except A1 correctly predict the low OSI throughout the dome and elevated OSI at the neck. However, only model D reproduces the general spatial distribution seen in model E. In the low AR case, models A1–A4 are all poor, predicting elevated OSI in different regions than the reference model. Although models B–D correctly predict elevated OSI in the neck region, the extent of tissue with elevated OSI is diminished in model D relative to model E.
The influence of idealizations for the native upstream vasculature on intra-aneurysmal hemodynamics was previously considered by Castro et al. [44] for flow in patient specific models of cerebral aneurysms. They evaluated the effect of replacing the native vasculature directly upstream of the aneurysm with a straight cylinder such as was considered in model A2 of this work. Their results showed that gross simplifications in the upstream geometry led to changes in the WSS field. They did not consider the impact of downstream vasculature.
This study suffered some limitations. The range of geometric variations considered was necessarily finite. Furthermore, the inflow and outflow velocity data were obtained from Doppler wave form imaging, which is planar and not volumetric. Recently we have acquired pointwise velocity measurements using phase contrast magnetic resonance angiographs in the parent vessels (unpublished data). We intend to use these data for future studies. In this work we chose high and low AR cases with representative values for neck, height, and AR. A study with a larger sample size is the subject of ongoing work. In comparing hemodynamic results across models, we considered commonly used parameters (WSS and OSI) as well as streamlines and velocity fields. Identification of the most important parameters for a given vascular pathology remains an area of active research. The quantitative comparison of the pointwise results between models was confined to an assessment of the WSS along curves formed by the intersection of a selected plane and the aneurysm lumen. A representative plane was chosen that intersected the proximal, distal and apex sac regions. Table 4 provides an assessment of the ability of models A–D to reasonably reproduce the hemodynamic results of reference model E. However, it should be kept it mind that the suitability of a particular model depends on the hemodynamic parameter of interest and magnitude of acceptable error.
We included a number of idealizations to render the computational studies tractable. The vessel walls were modeled as rigid. The motion of the arterial wall is generally accepted as causing only secondary hemodynamic effects compared with geometric and unsteady flow effects [11,45]. Another idealization was to treat the blood as Newtonian using the high shear rate viscosity for blood. The viscoelastic and shear thinning properties of blood are largely due to the aggregation and formation of 3D microstructure of red blood cells. However, these structures are not expected to be stable at the shear rates found in the arteries and aneurysm sacs studied here [46].
Finally, while the focus of this work was a rabbit model for cerebral aneurysms, the approach taken here can be used for hemodynamic studies of other species and pathologies. The circle of Willis, where most cerebral aneurysms are found, has a complex geometry with numerous branches and curved regions. We anticipate that inclusion of neighboring vessels will also be important for studies of local hemodynamics in saccular aneurysms in this region. Furthermore, we expect our findings regarding influence of the extent of the vascular domain to apply to experimental studies of hemodynamics in physical models of elastase induced rabbit aneurysms.
5 Conclusion
The results of this work suggest the extent of model geometry, which should be used in hemodynamic studies of elastase induced aneurysms in rabbits, depends strongly on the aneurysm aspect ratio, hemodynamic parameters of interest and magnitude of acceptable error. The results for high AR model are much less sensitive to the surrounding vasculature, suggesting even the simplest model with extensions is capable of reproducing WSS and OSI distributions. However, flow in low AR aneurysms is more sensitive to the extent of the model. If WSS is of primary concern for these aneurysms, the inclusion of downstream vessels is more important than the aortic arch. Careful attention to these outcomes can substantially decrease the computational requirements and increase reliability of the results for future CFD studies.
Acknowledgment
The authors would like to acknowledge their appreciation for the support in this work from the National Institute of Health (Contract No. NS42646-02). They would also like to thank the reviewers for their valuable recommendations.
Nomenclature
- A
cross section area
- ni
components of the outward normal at surfaces of computational domain (in rectangular coordinates)
- p
mechanical pressure
- Qi
volume flow rate at surfaces of computational domain
- T
duration of one cardiac cycle
- T′ij
components of the modified stress tensor in rectangular coordinates
- vi
components of the velocity vector in rectangular coordinates
- |v̠|
magnitude of velocity vector
- α
Womersley number
- ρ
blood density
- μ
high shear blood viscosity
- Γi
cross sectional surfaces of computational domain
- τ̠w
wall shear stress vector
- ε
spatial average of the WSS error relative to model E
Contributor Information
Zijing Zeng, Department of Mechanical Engineering and Materials Science, University of Pittsburgh, 3700 O’Hara Street, Pittsburgh, PA 15261, ziz3@pitt.edu.
David F. Kallmes, Department of Radiology, Mayo Clinic College of Medicine, 200 First Street Southwest, Rochester, MN 55905, kallmes.david@mayo.edu
Michael J. Durka, Department of Mechanical Engineering and Materials Science, University of Pittsburgh, 3700 O’Hara Street, Pittsburgh, PA 15261
Yonghong Ding, Department of Radiology, Mayo Clinic College of Medicine, 200 First Street Southwest, Rochester, MN 55905.
Debra Lewis, Department of Radiology, Mayo Clinic College of Medicine, 200 First Street Southwest, Rochester, MN 55905.
Ramanathan Kadirvel, Department of Radiology, Mayo Clinic College of Medicine, 200 First Street Southwest, Rochester, MN 55905.
Anne M. Robertson, Mem. ASME, Department of Mechanical Engineering and Materials Science and Center for Vascular Remodeling and Regeneration (CVRR), University of Pittsburgh, Pittsburgh, PA 15261, rbertson@pitt.edu
References
- 1.van Gijn J, Rinkel GJ. Subarachnoid Heamorrhage: Diagnosis, Cause and Management. Brain. 2001;124:249–278. doi: 10.1093/brain/124.2.249. [DOI] [PubMed] [Google Scholar]
- 2.Kayembe KN, Sasahara M, Hazama F. Cerebral Aneurysms and Variations in the Circle of Willis. Stroke. 1984;15(5):846–850. doi: 10.1161/01.str.15.5.846. [DOI] [PubMed] [Google Scholar]
- 3.Steiger HJ. Pathophysiology of Development and Rupture of Cerebral Aneurysms. Acta Neurochir. Suppl. (Wien) 1990;48:1–57. [PubMed] [Google Scholar]
- 4.Jou LD, Wong G, Dispensa B, Lawton MT, Higashida RT, Young WL, Saloner D. Correlation Between Lumenal Geometry Changes and Hemodynamics in Fusiform Intracranial Aneurysms. AJNR Am. J. Neuroradiol. 2005;26(9):2357–2363. [PMC free article] [PubMed] [Google Scholar]
- 5.Meng H, Wang Z, Hoi Y, Gao L, Metaxa E, Swartz DD, Kolega J. Complex Hemodynamics at the Apex of an Arterial Bifurcation Induces Vascular Remodeling Resembling Cerebral Aneurysm Initiation. Stroke. 2007;38(6):1924–1931. doi: 10.1161/STROKEAHA.106.481234. [DOI] [PMC free article] [PubMed] [Google Scholar]
- 6.Keynton RS, Evancho MM, Sims RL, Rodway NV, Gobin A, Rittgers SE. Intimal Hyperplasia and Wall Shear in Arterial Bypass Graft Distal Anastomoses: An In Vivo Model Study. ASME J. Biomech. Eng. 2001;123(5):464–473. doi: 10.1115/1.1389461. [DOI] [PubMed] [Google Scholar]
- 7.Malek AM, Alper SL, Izumo S. Hemodynamic Shear Stress and Its Role in Atherosclerosis. JAMA, J. Am. Med. Assoc. 1999;282(21):2035–2042. doi: 10.1001/jama.282.21.2035. [DOI] [PubMed] [Google Scholar]
- 8.Cebral JR, Castro MA, Burgess JE, Pergolizzi RS, Sheridan MJ, Putman CM. Characterization of Cerebral Aneurysms for Assessing Risk of Rupture by Using Patient-Specific Computational Hemodynamics Models. AJNR Am. J. Neuroradiol. 2005;26(10):2550–2559. [PMC free article] [PubMed] [Google Scholar]
- 9.Hassan T, Timofeev EV, Saito T, Shimizu H, Ezura M, Matsumoto Y, Takayama K, Tominaga T, Takahashi A. A Proposed Parent Vessel Geometry-Based Categorization of Saccular Intracranial Aneurysms: Computational Flow Dynamics Analysis of the Risk Factors for Lesion Rupture. J. Neurosurg. 2005;103(4):662–680. doi: 10.3171/jns.2005.103.4.0662. [DOI] [PubMed] [Google Scholar]
- 10.Shojima M, Oshima M, Takagi K, Torii R, Hayakawa M, Katada K, Morita A, Kirino T. Magnitude and Role of Wall Shear Stress on Cerebral Aneurysm: Computational Fluid Dynamic Study of 20 Middle Cerebral Artery Aneurysms. Stroke. 2004;35(11):2500–2505. doi: 10.1161/01.STR.0000144648.89172.0f. [DOI] [PubMed] [Google Scholar]
- 11.Steinman DA, Milner JS, Norley CJ, Lownie SP, Holdsworth DW. Image-Based Computational Simulation of Flow Dynamics in a Giant Intracranial Aneurysm. AJNR Am. J. Neuroradiol. 2003;24(4):559–566. [PMC free article] [PubMed] [Google Scholar]
- 12.Zakaria H, Robertson AM, Kerber C. A Parametric Model for Studies of Flow in Arterial Bifurcations. Ann. Biomed. Eng. 2008;36(9):1515–1530. doi: 10.1007/s10439-008-9531-y. [DOI] [PubMed] [Google Scholar]
- 13.Fukuda S, Hashimoto N, Naritomi H, Nagata I, Nozaki K, Kondo S, Kurino M, Kikuchi H. Prevention of Rat Cerebral Aneurysm Formation by Inhibition of Nitric Oxide Synthase. Circulation. 2000;101(21):2532–2538. doi: 10.1161/01.cir.101.21.2532. [DOI] [PubMed] [Google Scholar]
- 14.Kondo S, Hashimoto N, Kikuchi H, Hazama F, Nagata I, Kataoka H, Macdonald RL. Cerebral Aneurysms Arising at Nonbranching Sites: An Experimental Study. Stroke. 1997;28(2):398–404. doi: 10.1161/01.str.28.2.398. [DOI] [PubMed] [Google Scholar]
- 15.Roach MR. A Model Study of Why Some Intracranial Aneurysms Thrombose but Others Rupture. Stroke. 1978;9(6):583–587. doi: 10.1161/01.str.9.6.583. [DOI] [PubMed] [Google Scholar]
- 16.Short JG, Fujiwara NH, Marx WF, Helm GA, Cloft HJ, Kallmes DF. Elastase-Induced Saccular Aneurysms in Rabbits: Comparison of Geometric Features With Those of Human Aneurysms. AJNR Am. J. Neuroradiol. 2001;22(10):1833–1837. [PMC free article] [PubMed] [Google Scholar]
- 17.Zakaria H, Kallmes DF, Kadirvel R, Ding YH, Dai D, Lewis DA, Robertson AM. Similar Hemodynamic Features in Elastase-Induced Rabbit Saccular Aneurysms Compared to Those of Human Aneurysms; Proceedings of the World Congress of Biomechanics; Munich, Germany. 2006. p. S366. [Google Scholar]
- 18.Altes TA, Cloft HJ, Short JG, DeGast A, Do HM, Helm GA, Kallmes DF. 1999 ARRS Executive Council Award. Creation of Saccular Aneurysms in the Rabbit: A Model Suitable for Testing Endovascular Devices. American Roentgen Ray Society. AJR, Am. J. Roentgenol. 2000;174(2):349–354. doi: 10.2214/ajr.174.2.1740349. [DOI] [PubMed] [Google Scholar]
- 19.Ding YH, Dai D, Lewis DA, Cloft HJ, Kallmes DF. Angiographic and Histologic Analysis of Experimental Aneurysms Embolized With Platinum Coils, Matrix, and Hydrocoil. AJNR Am. J. Neuroradiol. 2005;26(7):1757–1763. [PMC free article] [PubMed] [Google Scholar]
- 20.Sadasivan C, Cesar L, Seong J, Rakian A, Hao Q, Tio FO, Wakhloo AK, Lieber BB. An Original Flow Diversion Device for the Treatment of Intracranial Aneurysms: Evaluation in the Rabbit Elastase-Induced Model. Stroke. 2009;40(3):952–958. doi: 10.1161/STROKEAHA.108.533760. [DOI] [PMC free article] [PubMed] [Google Scholar]
- 21.Seong J, Wakhloo AK, Lieber BB. In Vitro Evaluation of Flow Divertors in an Elastase-Induced Saccular Aneurysm Model in Rabbit. ASME J. Biomech. Eng. 2007;129(6):863–872. doi: 10.1115/1.2800787. [DOI] [PubMed] [Google Scholar]
- 22.Mangrum WI, Farassati F, Kadirvel R, Kolbert CP, Raghavakaimal S, Dai D, Ding YH, Grill D, Khurana VG, Kallmes DF. mRNA Expression in Rabbit Experimental Aneurysms: A Study Using Gene Chip Microarrays. AJNR Am. J. Neuroradiol. 2007;28(5):864–869. [PMC free article] [PubMed] [Google Scholar]
- 23.Kadirvel R, Ding YH, Dai D, Lewis DA, Raghavakaimal S, Cloft HJ, Kallmes DF. Gene Expression Profiling of Experimental Saccular Aneurysms Using Deoxyribonucleic Acid Microarrays. AJNR Am. J. Neuroradiol. 2008;29(8):1566–1569. doi: 10.3174/ajnr.A1125. [DOI] [PMC free article] [PubMed] [Google Scholar]
- 24.Mohan S, Mohan N, Valente AJ, Sprague EA. Regulation of Low Shear Flow-Induced HAEC VCAM-1 Expression and Monocyte Adhesion. Am. J. Physiol. 1999;276(5 Pt 1):C1100–C1107. doi: 10.1152/ajpcell.1999.276.5.C1100. [DOI] [PubMed] [Google Scholar]
- 25.Kadirvel R, Ding Y-H, Dai D, Zakaria H, Robertson AM, Danielson MA, Lewis DA, Cloft HJ, Kallmes DF. The Influence of Hemodynamic Forces on Biomarkers in the Walls of Elastase-Induced Aneurysms in Rabbits. Neuroradiology. 2007;49(12):1041–1053. doi: 10.1007/s00234-007-0295-0. [DOI] [PubMed] [Google Scholar]
- 26.Ujiie H, Tamano Y, Sasaki K, Hori T. Is the Aspect Ratio a Reliable Index for Predicting the Rupture of a Saccular Aneurysm? Neurosurgery. 2001;48(3):495–503. doi: 10.1097/00006123-200103000-00007. [DOI] [PubMed] [Google Scholar]
- 27.Sadatomo T, Yuki K, Migita K, Taniguchi E, Kodama Y, Kurisu K. Morphological Differences Between Ruptured and Unruptured Cases in Middle Cerebral Artery Aneurysms. Neurosurgery. 2008;62(3):602–609. doi: 10.1227/01.NEU.0000311347.35583.0C. [DOI] [PubMed] [Google Scholar]
- 28.Weir B, Amidei C, Kongable G, Findlay JM, Kassell NF, Kelly J, Dai L, Karrison TG. The Aspect Ratio (Dome/Neck) of Ruptured and Unruptured Aneurysms. J. Neurosurg. 2003;99(3):447–451. doi: 10.3171/jns.2003.99.3.0447. [DOI] [PubMed] [Google Scholar]
- 29.Ujiie H, Tachibana H, Hiramatsu O, Hazel AL, Matsumoto T, Ogasawara Y, Nakajima H, Hori T, Takakura K, Kajiya F. Effects of Size and Shape (Aspect Ratio) on the Hemodynamics of Saccular Aneurysms: A Possible Index for Surgical Treatment of Intracranial Aneurysms. Neurosurgery. 1999;45(1):119–130. doi: 10.1097/00006123-199907000-00028. [DOI] [PubMed] [Google Scholar]
- 30.Ding YH, Dai D, Lewis DA, Danielson MA, Kadirvel R, Cloft HJ, Kallmes DF. Long-Term Patency of Elastase-Induced Aneurysm Model in Rabbits. AJNR Am. J. Neuroradiol. 2006;27(1):139–141. [PMC free article] [PubMed] [Google Scholar]
- 31.Kallmes DF, Fujiwara NH, Yuen D, Dai D, Li ST. A Collagen-Based Coil for Embolization of Saccular Aneurysms in a New Zealand White Rabbit Model. AJNR Am. J. Neuroradiol. 2003;24(4):591–596. [PMC free article] [PubMed] [Google Scholar]
- 32.Zamir M. The Physics of Pulsatile Flow. New York: Springer; 2000. [Google Scholar]
- 33.Shahcheraghi N, Dwyer HA, Cheer AY, Barakat AI, Rutaganira T. Unsteady and Three-Dimensional Simulation of Blood Flow in the Human Aortic Arch. ASME J. Biomech. Eng. 2002;124(4):378–387. doi: 10.1115/1.1487357. [DOI] [PubMed] [Google Scholar]
- 34.Nerem RM, Rumberger JA, Jr, Gross DR, Hamlin RL, Geiger GL. Hot-Film Anemometer Velocity Measurements of Arterial Blood Flow Horses. Circ. Res. 1974;34(2):193–203. doi: 10.1161/01.res.34.2.193. [DOI] [PubMed] [Google Scholar]
- 35.Heywood JG, Rannacher R, Turek S. Artificial Boundaries and Flux and Pressure Conditions for the Incompressible Navier-Stokes Equations. Int. J. Numer. Methods Fluids. 1996;22(5):325–352. [Google Scholar]
- 36.Gresho PM. Some Current CFD Issues Relevant to the Incompressible Navier-Stokes Equations. Comput. Methods Appl. Mech. Eng. 1991;87(2–3):201–252. [Google Scholar]
- 37.Leone JM, Gresho PM. Finite Element Simulations of Steady, Two-Dimensional, Viscous Incompressible Flow Over a Step. J. Comput. Phys. 1981;41(1):167–191. [Google Scholar]
- 38.Zamir M. Shear Forces and Blood Vessel Radii in the Cardiovascular System. J. Gen. Physiol. 1977;69(4):449–461. doi: 10.1085/jgp.69.4.449. [DOI] [PMC free article] [PubMed] [Google Scholar]
- 39.Galdi G. Mathematical Problems in Classical and Non-Newtonian Fluid Mechanics. In: Galdi GP, Rannacher R, Robertson AM, Turek S, editors. Hemodynamical Flows: Modeling, Analysis and Simulation, Oberwolfach Seminars. Boston, MA: Birkhäuser; 2008. [Google Scholar]
- 40.Kučera P, Skalák Z. Local Solutions to the Navier–Stokes Equations With Mixed Boundary Conditions. Acta Appl. Math. 1998;54(3):275–288. [Google Scholar]
- 41.Womersley JR. Method for the Calculation of Velocity, Rate Of Flow and Viscous Drag in Arteries When the Pressure Gradient is Known. J. Physiol. 1955;127(3):553–563. doi: 10.1113/jphysiol.1955.sp005276. [DOI] [PMC free article] [PubMed] [Google Scholar]
- 42.He X, Ku DN. Pulsatile Flow in the Human Left Coronary Artery Bifurcation: Average Conditions. ASME J. Biomech. Eng. 1996;118(1):74–82. doi: 10.1115/1.2795948. [DOI] [PubMed] [Google Scholar]
- 43.Meng H, Swartz DD, Wang Z, Hoi Y, Kolega J, Metaxa EM, Szymanski MP, Yamamoto J, Sauvageau E, Levy EI. A Model System for Mapping Vascular Responses to Complex Hemodynamics at Arterial Bifurcations In Vivo. Neurosurgery. 2006;59(5):1094–1100. doi: 10.1227/01.NEU.0000245599.92322.53. [DOI] [PMC free article] [PubMed] [Google Scholar]
- 44.Castro MA, Putman CM, Cebral JR. Computational Fluid Dynamics Modeling of Intracranial Aneurysms: Effects of Parent Artery Segmentation on Intra-Aneurysmal Hemodynamics. AJNR Am. J. Neuroradiol. 2006;27:1703–1709. [PMC free article] [PubMed] [Google Scholar]
- 45.Steinman DA. Image-Based Computational Fluid Dynamics Modeling in Realistic Arterial Geometries. Ann. Biomed. Eng. 2002;30(4):483–497. doi: 10.1114/1.1467679. [DOI] [PubMed] [Google Scholar]
- 46.Robertson AM, Sequeira A, Kameneva MV. Hemorheology. In: Galdi GP, Rannacher R, Robertson AM, Turek S, editors. Hemodynamical Flows: Modeling, Analysis and Simulation. Boston, MA: Birkhäuser; 2008. [Google Scholar]


