

Abstract
We have previously shown that a conjugate (MA-ce6) between maleylated serum albumin and the photosensitizer chlorin(e6) (ce6) is targeted in vitro to macrophages via class A scavenger receptors. We now report on the ability of this conjugate to localize in macrophage-rich atherosclerotic plaques in vivo. Both the conjugate and the free photosensitizer ce6 are studied after injection into New Zealand White rabbits that are rendered atherosclerotic by a combination of aortic endothelial injury and cholesterol feeding into normal rabbits. Rabbits are sacrificed at 6 and 24 h after injection and intravascular fluorescence spectroscopy is carried out by fiber-based fluorimetry in intact blood-filled arteries. Surface spectrofluorimetry of numbered excised aortic segments together with injured and normal iliac arteries is carried out, and quantified ce6 content by subsequent extraction and quantitative fluorescence determination of the arterial segments and also of nontarget organs. There is good agreement between the various techniques for quantifying ce6 localization, and high contrast between arteries from atherosclerotic and normal rabbits is obtained. Fluorescence correlates with the highest burden of plaque in the aorta and the injured iliac artery. The highest accumulation in plaques is obtained using MA-ce6 at 24 h. Free ce6 gives better accumulation at 6 h compared to 24 h. The liver, spleen, lung, and gall bladder have the highest uptake in nontarget organs. Macrophage-targeted photosensitizer conjugates may have applications in both detecting and treating inflamed vulnerable plaque.
Keywords: atherosclerosis, intravascular fluorimetry, photodynamic therapy, fluorescence, biodistribution, macrophage, scavenger receptor, chlorin(e6), vulnerable plaque
1 Introduction
Vulnerable atherosclerotic plaques in the coronary arteries are a leading cause of death and disease due to their propensity to rupture and cause thrombosis and myocardial infarction.1 These rupture-prone plaques are characterized by large necrotic lipid cores, thin fibrous caps, and dense macrophage infiltration.2 Because a large proportion of these plaques are nonstenotic (less than 60% narrowing of the lumen), they are frequently nonsymptomatic. In recent years, a plethora of methods have been devised in an attempt to detect them before a catastrophic rupture occurs.3 These detection methods include both invasive modalities that require cardiac catheterization and noninvasive imaging methods. Examples of the former invasive techniques include intravascular ultrasound,4 optical coherence tomography,5 intravascular thermography,6 and near-infrared spectroscopy.7 Examples of noninvasive techniques include multislice x-ray computed tomography,8 magnetic resonance imaging,9 electron-beam imaging of calcium deposits,10 and 2-[18F] fluoro-2-deoxy-D-glucose mediated positron emission tomography.11
These detection methods rely on localization of various abnormalities associated with lesions in the vessel wall such as inflammation, fibrous cap thickness, lipid content, calcifications, and characteristic luminal appearance of the lesions. Activated macrophages are thought to be the chief culprit cells in causing plaque vulnerability by expressing proinflammatory cytokines,12 secreting matrix metalloproteinases that further degrade the thin collagen cap13 and also producing the highly prothrombotic tissue factor that is released on plaque rupture.14 For these reasons, localizing and quantifying activated macrophages may be the best detection target in assessing vulnerability in coronary arterial lesions.
Photodynamic therapy (PDT) uses nontoxic photosensitizers (PS) that are photoactived on the absorption of light.15,16 Exposure of the PS to the appropriate wavelength of light raises the PS molecule to an excited state that, depending on the intensity and wavelength of light used, can either lead to 1. the generation of cytotoxic reactive oxygen species, or 2. the emission of fluorescent light. PDT is currently approved for the treatment of esophageal and lung cancer and age-related macular degeneration.17 Its application to atherosclerotic disease is currently under investigation.18 There have been several reports that PS developed for treatment of other diseases such as cancer can localize in atherosclerotic lesions.18–22 The reason for this selective localization is poorly understood, but may be related to their chemical structure being lipophilic and the plaques having high amounts of lipid accumulation. The fact that most PS that have been investigated for PDT are also fluorescent when excited with visible light, together with their ability to selectively accumulate in diseased tissue, has led to the administration of various PS being used for fluorescent diagnosis or detection of disease.23–26
We have previously shown that covalent conjugates (MA-ce6) between the PS chlorin(e6) (ce6) and maleylated albumin (MA)27 are taken up by macrophages with high specificity, and that subsequent photoactivation results in macrophage-specific phototoxicity.28 MA-ce6 molecules are recognized by macrophage class A scavenger receptors (SR-As) that are high-capacity membrane glycoproteins that are confined mainly to tissue macrophages and related cell types.29 The SR-As play an important role in the pathophysiology of atherosclerosis30 by mediating the uptake of modified low-density lipoprotein uptake by human monocyte-derived macrophages,31 therefore encouraging their transformation into lipid-laden foam cells.32
In this report, we investigated the use of MA-ce6 in an animal model of macrophage-rich atherosclerotic plaque in the rabbit aorta. This model, involving endothelial injury to the abdominal aorta followed by four months of an atherogenic diet, has been shown to lead to the development of inflamed atherosclerotic plaques with many characteristics of human vulnerable plaques including high levels of macrophage infiltration.33,34 While unconjugated molecules closely related to ce6 have been reported to localize in atherosclerotic plaques,19–22 it was not known if MA-ce6 would localize in the same manner as free ce6 under the same conditions. We also decided to investigate the relative fluorescence accumulation at two different time points. Based on the fact that the pharmacokinetics of free ce6 are likely to be faster than that of the MA-ce6, we decided to compare accumulation 6 and 24 h postinjection.
2 Materials and Methods
2.1 Preparation of Conjugate
The scavenger-receptor-targeted conjugate between maleylated albumin and ce6 was prepared as previously described.27 Briefly, the N-hydroxy succinimide ester of ce6 (Frontier Scientific Incorporated, Logan, Utah) was added to bovine serum albumin (Sigma, Saint Louis, Missouri) dissolved in NaHCO3 buffer, followed by addition of solid maleic anhydride. The conjugate was purified by repeated precipitation from aqueous solution by addition of acetone followed by dialysis, and characterized by polyacrylamide gel electrophoresis and absorption, and fluorescence spectrophotometry.
2.2 Experimental Atherosclerotic Lesions
Animal experiments were approved by the Massachusetts General Hospital Subcommittee on Research Animal Care (IACUC) and were in accordance with National Institutes of Health (NIH) guidelines. Male New Zealand white rabbits weighing 2.5 to 3.0 kg (Charles River Breeding Laboratories, Boston, Massachusetts) were maintained on a 2% cholesterol, 6% peanut oil diet (ICN, Costa Mesa, California) for 4 months. After 1 week of the hyperlipidemic diet, the abdominal aorta was denuded of endothelium by a modified Baumgartener technique.11 Briefly, each animal was anesthetized with a mixture of ketamine and xylazine (100 mg/mL, 10:1 vol/vol; 1.5 to 2.5-mL sc), and the right femoral artery was isolated. A 4F Fogarty embolectomy catheter (12-040-4F, Edwards Laboratories, Santa Ana, California) was introduced through an arteriotomy and advanced to the level of the diaphragm. The catheter was inflated to a pressure of 3 psi above the balloon inflation pressure, and withdrawn five times. The femoral artery was then ligated, and the wound closed. The animals were allowed to recover from anesthesia and then returned to their cages for the remainder of the allotted dietary treatment. Untreated male New Zealand white rabbits fed standard chow served as controls.
2.2.1 Photosensitizer Injection
15 weeks after aortic denudation injury, rabbits were fasted overnight. Animals were anesthetized by IP injection with a mixture of ketamine and xylazine (50 and 5 mg/kg), and MA-ce6 or free ce6 (2 mg/kg of ce6 equivalent in 10-mL 5% dextrose) was administered intravenously (ear vein) over a 2-min period. 6 or 24 h after PS administration, the animals were sacrificed with an overdose of sodium pentobarbital (200 mg/kg).
2.2.2 Fiber-based Spectrofluorimeter
The system used for intravascular fluorescence detection was constructed in-house. A nitrogen laser pumped dye-laser system (models VSL337ND and DLM220, Laser Sciences Incorporated, Franklin, Massachusetts) operating at 400 nm was coupled into a 400-μm internal diameter fiber with a flat polished end. Reflected light at and fluorescence from the tissue in the range 650 to 800 nm was collected by the fiber and spectrally dispersed using an imaging spectrograph (SpectraPro, 150, Roper Scientific, Princeton, New Jersey). A 650-nm longpass filter was used to remove tissue autofluorescence and exciting light. A gated, intensified charge-coupled device (CCD) array (PI-Max, Roper Scientific, Princeton, New Jersey) was used as the detector. The spectrograph was equipped with a 25-μm-wide input slit and a 150-gr/mm grating blazed at 450 nm. The spectra obtained from ten laser pulses were averaged for each measurement. A background spectrum (fiber in air) was obtained and subtracted from averaged fluorescence spectra.
2.2.3 Intravascular Fluorescence Measurement in Blood-filled Arteries
After sacrifice, the thorax and abdomen were surgically opened. Intravascular access was obtained by a 2-mm arterotomy approximately 1 cm above the aortic bifurcation. The fiber optic probe of the fluorimeter was inserted through the arterotomy and advanced up the aorta until the aortic arch was reached. Measurements in triplicate were taken every 1 cm and the fiber was pulled back toward the aortic incision. The artery was gently compressed with a finger to ensure good contact between the fiber tip and the arterial wall. When the incision was reached, the probe was turned around and measurements were made of the lower aorta together with the uninjured and injured iliac arteries.
2.2.4 Surface Fluorescence Measurement
The abdominothoracic aorta and iliac arteries were removed en bloc from the level of the aortic arch to 1 cm distal to the iliac bifurcation. After removal of adherent adventitial tissue and rinsing in saline, the aorta was subdivided using scissors, and ten segments of approximately equal length (about 1.5 cm) numbered from 1 at the aortic arch to 10 just above the bifurcation, together with the injured iliac artery and the uninjured iliac arteries, were produced. Each segment was carefully opened longitudinally with scissors to produce a rectangle that was moistened with PBS and laid adventitial side down on a black metal plate to expose the intimal surface. The intimal surface of each vascular segment was examined by spectrofluorimetry using a fiber-bundle-based double monochromator spectrofluorimeter (Skin Scan, Spex Industries, Edison, New Jersey) placed in contact with the tissue. Emission spectra (excitation 400 nm, emission 580 to 720 nm) were collected every 3 mm in a grid form across the entire area of the exposed intimal surface (approximately 9 to 24 measurements per segment, depending on its original diameter). Fluorescence per segment was calculated as the mean of these measurements and was expressed as arbitrary units (AU).
2.2.5 Photosensitizer Extraction from Arterial Segments
Immediately following the surface fluorescence measurements, each segment was added to a preweighed vial, weighed again, and 3 mL of a solution containing 1-M NaOH and 0.3% sodium dodecyl sulfate (SDS) was added. These samples were homogenized (homogenizer model PT 10/35; Brinkman Instruments, Westbury, New York) for 30 s and kept in the dark at room temperature for 1 week. At the completion of this time, the tissue had dissolved to give a homogenous solution. This was measured in a spectrofluorimeter (Fluoromax 3, Spex Industries). The peak height of the fluorescence emission (usually between 658 and 664 nm) was measured (excitation at 400 nm, emission scanned from 580 to 720 nm). The quantity of MA-ce6 in the tissue sample was determined by multiplying the fluorescence emission by a constant determined from calibration curves prepared from known amounts of either MA-ce6 or free ce6 homogenized with similar weights of nonfluorescent arterial tissue. The tissue concentration of MA-ce6 was expressed as moles of equivalent per gram of tissue.
2.3 Biodistribution in Nontarget Organs
Three tissue samples weighing 50 to 100 mg were removed from skin, muscle, liver, kidney, spleen, bladder, lung, gall bladder, heart, and lymph node. These were homogenized in the same manner as the arterial segments described before. Samples of bile and blood were taken with a 0.5-mL syringe and plasma prepared from the blood. Subsequently, fluorescence was measured with a spectrofluorimeter (as described before). Calibration curves were prepared for each organ type from known amounts of MA-ce6 or free ce6 homogenized with the individual tissue from noninjected rabbits.
2.4 Statistical Methods
Values are reported as the mean ± standard error of the mean (SEM). Differences between two means were assessed for significance by the two-tailed students-t test, assuming equal or unequal variances of the standard deviations as appropriate. A value of p<0.05 was considered significant.
3 Results
3.1 Preparation and Fluorescence of MA-ce6 Conjugate
A schematic representation of the molecular structure of the conjugate is given in Fig. 1. There were an average of two ce6 molecules per BSA molecule, and the remaining lysine epsilon amino groups were approximately 80% maleylated as determined by analysis of the absorption spectrum. The fluorescence emission of the conjugate was centered at 665 nm. The fluorescence emission of free ce6 was centered at 660 nm (data not shown).
Fig. 1.

Chemical structure of MA-ce6 together with absorption and emission spectrum.
3.2 Rabbit Model of Atherosclerotic Plaque
After the balloon injury and 12 to 16 weeks of atherogenic diet, the rabbits exhibited extensive atherosclerosis in the excised aorta and iliac arteries. We numbered the 12 segments that we analyzed as depicted in Fig. 2. The segments most affected by the balloon injury were numbers 6, 7, and 8, and they had the worst levels of atherosclerotic plaque. Segments at the borders of the injured area (numbers 4, 5, and 9) had somewhat less severe plaque. In addition, we found that the uninjured segments of the aorta at the aortic arch (numbers 1 and 2) also developed severe atherosclerosis. Segments 3 and 10 had the least pronounced atherosclerosis in the aorta. The introduction of the deflated balloon catheter through the right femoral and iliac arteries also led to injury to the endothelium of the right iliac artery and consequent development of severe atherosclerosis not found in the uninjured left iliac artery. There were no completely normal arterial segments in the atherosclerotic rabbits. By contrast, histology of the normal rabbits showed unremarkable arteries with no evidence of plaque or intimal thickening (not shown).
Fig. 2.
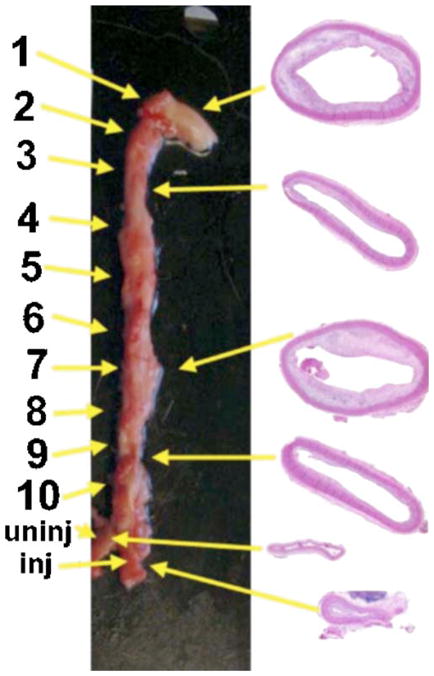
Photograph of excised en bloc atherosclerotic aorta and iliac arteries showing numbering of segments. 1. ascending aorta; 2. aortic arch; 3., 4., and 5., thoracic aorta; 6. aorta at diaphragm; 7., 8., and 9. abdominal aorta; 10. aortic bifurcation; inj: right iliac artery through which balloon was introduced; and uninj: normal left iliac artery. H and E sections of the typical segments obtained from the (a) aortic arch, (b) mid-thoracic noninjured site, (c) injured mid-abdominal, (d) aorta above bifurcation, (e) uninjured iliac artery, and (f) injured iliac artery.
3.3 Intravascular Fluorescence in Blood-Filled Arteries
The approved animal protocol specified a terminal procedure to analyze the distribution of ce6 in the rabbits. Before administering a fatal dose of pentobarbital, we anesthetized two rabbits with ketamine/xylazine to determine whether it was possible to capture intravascular fluorescence in the aortas of living rabbits in the presence of flowing arterial blood. The fiber was inserted through the noninjured femoral and iliac artery and advanced into the aorta. However, probably due to the construction of the fiber optic probe that had a flat polished end, signals were nonsignificant until the fiber reached the aortic arch where the tip came into contact with the arterial wall as the artery curved around (see Fig. 2; data not shown). Then we sacrificed the animals and opened the body cavity with a longitudinal incision through the thoracic and abdominal walls to expose the aorta. This enabled gentle pressure with a gloved fingertip to be applied to compress the artery against the fiber tip and allow optical contact with the arterial wall. Figure 3 illustrates examples of intravascular fluorescence emission spectra obtained from the mid-abdominal aorta of atherosclerotic and normal rabbits 24 h after injection of MA-ce6. The intravascular measurements were taken in triplicate and at ten locations at 1-cm intervals throughout the length of the aorta, plus one set in the uninjured and one set in the injured iliac arteries. There were five conditions (MA-ce6 at 6 h and 24 h; free ce6 at 6 and 24 h and no injection) and two sets of rabbits for each condition (normal and atherosclerotic). The values are presented in Fig. 4(a) for six atherosclerotic rabbits and in Fig. 4(b) for six normal rabbits.
Fig. 3.

Representative intravascular fluorescence emission spectra from balloon-injured segment (mid-abdominal) of atherosclerotic rabbit aorta and corresponding section from normal rabbit. Both animals were injected with MA-ce6 24 h before sacrifice.
Fig. 4.

Mean intravascular fluorescence signal (in arbitrary units) for arterial segments gathered by fiber pullback in (a) atherosclerotic rabbits and (b) normal rabbits. Values are means of triplicate determinations at each segment from six rabbits, and bars are SEM.
The intensities of the intravascular fluorescence measurements in atherosclerotic animals decrease in the order MA-ce6 24 h ≫ ce6 6 h (p<0.001)> MA-ce6 6 h (p<0.05)> ce6 24 h (p<0.05)> nothing (p<0.001). Since the values obtained from rabbits injected with nothing can be assumed to be background autofluorescence from the artery wall, this number (approximately 100 arbitrary units) could be subtracted from the values, thus further increasing the advantage shown by MA-ce6 at 24 h. The highest values are in segments 1, 2, 6, 7, 8, 9, and the injured iliac artery. Segments 6 through 9 and the injured iliac artery develop the worst atherosclerosis due to the endothelial injury, while segments 1 and 2 near the aortic arch are the natural site for development of lesions in rabbits subjected to atherogenic diets. There is a very large selectivity for atherosclerotic rabbits compared to normal rabbits (p<0.0001) [Fig. 4(b)], where the values for both free ce6 and MA-ce6 at both time points do not differ significantly from values obtained from normal rabbits injected with nothing. This implies that none of these fluorophores accumulate in normal arteries. The autofluorescence (no injection) values from atherosclerotic rabbits were higher than those from normal rabbits (but not significantly).
3.4 Fluorescence Localization ex-Vivo by Surface Spectrofluorimetry
Figure 5(a) shows the values obtained from emission spectrofluorimetry of the excised aortic segments opened up to expose the luminal surfaces after the intravascular experiments were completed. The order of intensities of the signals is MA-ce6 24 h> MA-ce6 6 h (p<0.0005)> ce6 6 h (p<0.0001) ≅ ce6 24 h≅ nothing. The signals from free ce6 at both 6 and 24 h did not significantly differ from background levels obtained in noninjected rabbits. The atherosclerotic signals were higher from segments 1, 4 through 8, and the injured iliac artery. The difference between fluorescence from MA-ce6 at 6 and 24 h was much smaller in segments when the maximum fluorescence was low (segments 2, 3, 9, 10, and uninjured iliac) than in the segments mentioned before where it was high. In the case of conjugate at 6 and 24 h the values obtained from segments excised from atherosclerotic rabbits were much higher (p<0.0001) than the corresponding segments taken from normal rabbits [Fig. 5(b)].
Fig. 5.

Mean intimal surface fluorescence signal (in arbitrary units) for arterial segments removed and opened from (a) atherosclerotic rabbits and (b) normal rabbits. Values are means of 6 to 24 determinations at each segment from six rabbits, and bars are SEM.
3.5 Extraction and Quantification of ce6 in Aortic Segments
Figures 6(a) and 6(b) show the values obtained by extraction of the ce6 from the arterial segments and quantification of the ce6 concentration in mol/g tissue by fluorescence spectrophotometry of the dissolved tissue. The concentration of MA-ce6 in atherosclerotic arteries is significantly higher at 24 h compared to 6 h (p<0.0001). The values for MA-ce6 at 24 h are significantly larger in atherosclerotic rabbits compared to those from normal rabbits (p<0.0001). The values of free ce6 at both 6 and 24 h in atherosclerotic rabbits are not different from background (no injection).
Fig. 6.
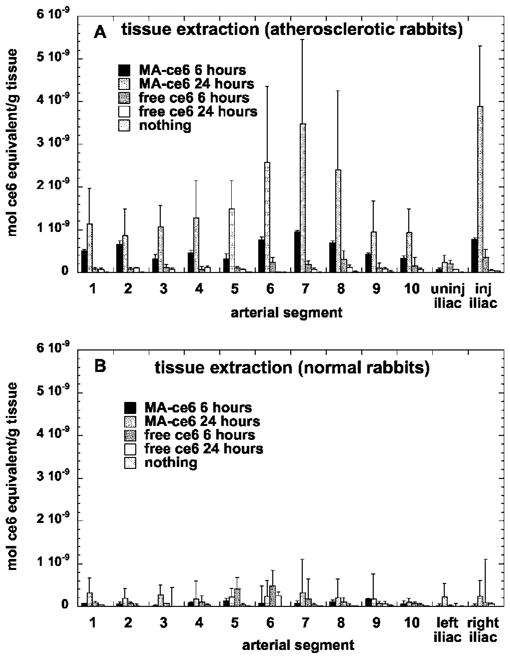
Mean values of ce6 content (in mol ce6 equivalent per gram tissue) from arterial segments that were removed and opened from (a) atherosclerotic rabbits and (b) normal rabbits, and subsequently dissolved and quantified by fluorimetry. Values are means of 1 to 3 determinations at each segment from six rabbits, and bars are SEM.
3.6 Biodistribution in Nontarget Organs
Figure 7 depicts the values of ce6 concentration in the tissue of nontarget organs obtained by extraction. We only measured the values for atherosclerotic rabbits injected with MA-ce6 at 6 and 24 h. Skin and muscle had low levels, followed by heart, fat, plasma, and bile with intermediate levels, and liver, spleen, bladder, lung, and gall bladder had the highest levels. Most of the organs had lower levels at 24 h compared to 6 h, except the liver and bile, which increased at 24 h.
Fig. 7.
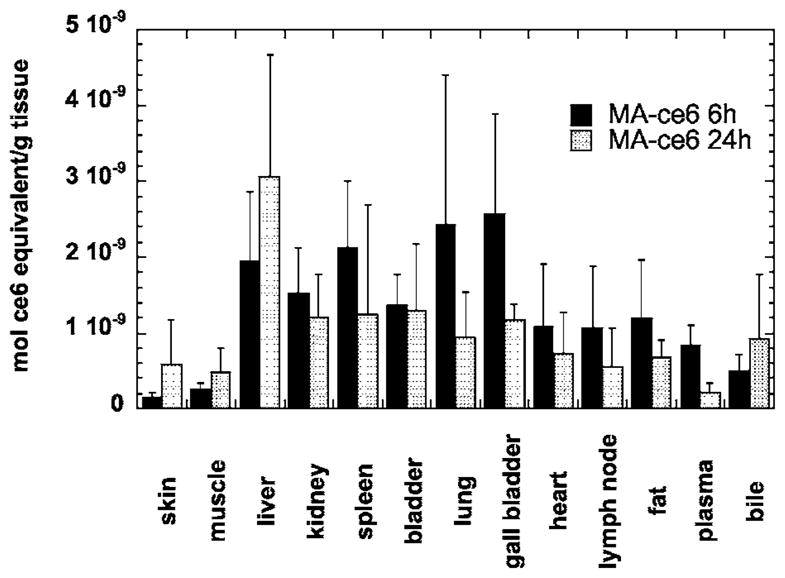
Mean values of ce6 (in mol equivalent per gram tissue) in nontarget organs from atherosclerotic rabbits injected with MA-ce6 and sacrifced either 6 or 24 h later. Values are means of 1 to 3 samples from each organ from six rabbits, and bars are SEM.
4 Discussion
There have been many reports of cell-type specific targeting using a conjugate between a reporter or therapeutic molecule, joined to a macromolecular ligand, recognized by a receptor, expressed or overexpressed by a certain cell type involved in disease. To validate this claim, an essential control is the administration of the unconjugated molecule on its own. This is even more necessary in the case of targeted delivery of a PS to atherosclerotic plaques, as there have been several reports of free PS alone localizing in various atherosclerotic lesions in diverse animal models of atherosclerosis.19–22
The findings in the present study are highly supportive of the hypothesis that scavenger-receptor targeting of ce6 can indeed provide an advantage over the accumulation of free ce6 in plaques that appears to occur by an unknown mechanism. When MA-ce6 is used with a 24-h time interval, there is significantly more ce6 in plaques than free ce6 at either time point, without a corresponding increase in accumulation in normal rabbit arteries. This applies to all segments of the diseased aorta but particularly to the segments that have more severe disease either by being located near the aortic arch (segments 1 and 2) or by suffering endothelial denudation (segments 6, 7, 8, and injured iliac). It was interesting to observe that the MA-ce6 conjugate at 24 h had higher values in the plaques than the same conjugate at the same dose at 6 h. The explanation for this observation is presumably that the conjugate is actively taken up by macrophages in the plaques by the time-dependent process of endocytosis, and therefore the cells can continue to accumulate fluorescence as long as there is conjugate still in circulation. This time difference in fluorescence accumulation is not observed in arterial segments from normal rabbits, as these nondiseased arteries are devoid of macrophages. The data from the nontarget organs agree with the hypothesis of active accumulation. The liver has the highest concentration of tissue macrophages, and this was the only organ that had much higher amounts at 24 h compared to 6 h. In addition, the amount in bile was higher at 24 h, in agreement with the function of the liver to excrete lipophilic molecules in bile.
As expected, the free ce6 did show a somewhat selective localization in plaques both at 6 and 24 h (especially by intravascular fluorescence). This was more pronounced at the 6-h time point. This can be explained by the fact that as ce6 is a small molecule, the pharmacokinetics may be expected to be faster than the macromolecular MA-ce6 conjugate. When free ce6 is used as a PS for cancer treatment, illumination is usually carried out relatively soon after injection into the bloodstream.35 The present study has not shed any light on the mechanism of plaque localization by free ce6, but plausible hypotheses include accumulation in lipid-rich areas of plaques, penetration through leaky endothelial barriers, and even uptake by the macrophages present in the lesions.
Some differences were observed between the various modalities used to quantify the ce6 accumulation in the atherosclerotic plaques. The MA-ce6 at 24 h was the highest by a considerable margin using all the different techniques. However, the MA-ce6 at 6 h gave significantly higher values in the surface fluorescence measurements than in the intravascular measurements, while the situation was reversed for free ce6 at both time points. The explanation for this observation is not obvious. It is possible that the detection of the fluorescence through the blood that filled the arteries was more efficient for the free ce6 that has a higher fluorescence quantum yield than the conjugate, where the fluorescence quantum yield of the dye is reduced by the covalent conjugation. The free ce6 may have been more loosely attached to the surface of the arteries, so it could have been detected in the intact aortas but was lost when the arterial segments were washed in saline before surface detection. This possibility would also explain the absence of significant amounts of free ce6 in the arterial segment extraction data at both 6 and 24 h [Fig. 6(a)].
The optical arrangement of the surface fluorescence measurements involves a 3-mm-diam window that sits in contact with the tissue, and means that the light enters the tissue at right angles. This configuration is in contrast with the intravascular fiber optic probe, where the light is launched parallel to the intimal surface and therefore will not penetrate as far into the tissue. A comparative estimate of the penetration depths would be in the order of 100 to 200 μm for the surface fluorescence but only 10 to 60 μm for the intravascular probe. It is possible that the macrophages that accumulate MA-ce6 are located deeper in the intimal lesions than the accumulation of free ce6 that may be shallower due to endothelial leakiness. This would then explain the difference between the relative magnitudes of the MA-ce6 at 6 h and those of free ce6, as determined by intravascular and surface fluorescence measurements.
The highest relative signals for MA-ce6 at 24 h compared to 6 h were obtained using the tissue extraction procedure. The explanation for this observation is likely to be the continued active accumulation of MA-ce6 by receptor-mediated endocytosis in the plaque macrophages. The nature of the fluorescence measurements at the artery wall (both intravascular and surface) means that the measured signal may become saturated at certain levels of plaque accumulation, possibly because the ce6 is in a less fluorescent aggregated state when present at high levels, but on dissolution in a disaggregating solvent (NaOH/SDS), the fluorescence becomes linear with ce6 concentration. One question that has not been addressed by the present study is how the conjugate is transported to the macrophages in the plaques. It is possible that the conjugate passes through the endothelium lining the lumen of the artery, or alternatively, it could be delivered to the plaques by the neovasculature (vasa vasorum) that is typical of atherosclerotic plaques.
The intravascular fluorescence detection system requires optimization to function satisfactorily in flowing blood. This might involve redesign of the fiber tip to produce a side-firing optical configuration, and to ensure that the optical path length through blood is minimized by allowing the tip to maintain gentle contact with the artery wall. There have been considerable technical improvements in intravascular fiber catheter design to enable such techniques as optical coherence tomography36 and near-infrared spectroscopy7 to proceed to clinical trials. Although the rabbits did not suffer any toxicity from injections of the scavenger-receptor targeted conjugate, it should be noted that such preparations might not be pharmacologically neutral. Binding of ligands to macrophage scavenger receptors may induce signaling cascades, leading to macrophage activation and possibly to inflammation,37,38 but recent data has shown that this SRA-mediated signaling is unlikely.39,40
In summary, this study demonstrates the superior localization of a scavenger-receptor-targeted PS conjugate in macrophage-rich atherosclerotic plaques 24 h after injection into rabbits. A rationally designed fiber-optic-based fluorescence detection system with the correct fiber-tip geometry may answer the question of whether intravascular detection of macrophage-rich plaques is feasible. Future work will correlate the accumulation of MA-ce6 in plaques to immunohistochemical localization of macrophages, and investigate the ability of the MA-ce6 conjugate to mediate therapeutically beneficial PDT of the atherosclerotic lesions after intravascular delivery of red light in living rabbits.
Acknowledgments
This study was supported in part by grants from the Center for Integration of Medicine and Innovative Technology DAMD 17-02-2-0006 (Hamblin and Tawakol) and the NIH (CA/AI838801 to Hamblin and RR16046 to Tawakol). Stern was supported by NIH PO1CA84203 (Tayyaba Hasan). The authors wish to thank John Demirs for help with histopathology, and Henry Gewirtz and Tayyaba Hasan for their support.
Contributor Information
Ahmed Tawakol, Massachusetts General Hospital, Cardiac Unit, Department of Medicine, Boston, Massachusetts and Harvard Medical School, Department of Medicine, Boston, Massachusetts.
Ana P. Castano, Massachusetts General Hospital, Wellman Center for Photomedicine, Boston, Massachusetts and Harvard Medical School, Department of Dermatology, Boston, Massachusetts
Florencia Anatelli, Massachusetts General Hospital, Wellman Center for Photomedicine, Boston, Massachusetts and Harvard Medical School, Department of Dermatology, Boston, Massachusetts.
Gregory Bashian, Harvard Medical School, Department of Medicine, Boston, Massachusetts and Massachusetts General Hospital, Department of Radiology and Nuclear Medicine, Boston, Massachusetts.
Jeremy Stern, Massachusetts General Hospital, Wellman Center for Photomedicine, Boston, Massachusetts.
Touqir Zahra, Massachusetts General Hospital, Wellman Center for Photomedicine, Boston, Massachusetts and Harvard Medical School, Department of Dermatology, Boston, Massachusetts.
Faten Gad, Massachusetts General Hospital, Wellman Center for Photomedicine, Boston, Massachusetts and Harvard Medical School, Department of Dermatology, Boston, Massachusetts.
Stephanie Chirico, Massachusetts General Hospital, Wellman Center for Photomedicine, Boston, Massachusetts.
Atosa Ahmadi, Massachusetts General Hospital, Wellman Center for Photomedicine, Boston, Massachusetts.
Alan J. Fischman, Harvard Medical School, Department of Medicine, Boston, Massachusetts and Massachusetts General Hospital, Department of Radiology and Nuclear Medicine, Boston, Massachusetts
James E. Muller, Massachusetts General Hospital, Department of Medicine, Cardiac Unit, Boston, Massachusetts and Harvard Medical School, Department of Medicine, Boston, Massachusetts
Michael R. Hamblin, Massachusetts General Hospital, Wellman Center for Photomedicine, Boston, Massachusetts and Harvard Medical School, Department of Dermatology, Boston, Massachusetts and Harvard MIT Division of Health Sciences and Technology, Cambridge, Massachusetts
References
- 1.Burke AP, Farb A, Malcom GT, Liang YH, Smialek J, Virmani R. Coronary risk factors and plaque morphology in men with coronary disease who died suddenly. N Engl J Med. 1997;336:1276–1282. doi: 10.1056/NEJM199705013361802. [DOI] [PubMed] [Google Scholar]
- 2.Plutzky J. Atherosclerotic plaque rupture: emerging insights and opportunities. Am J Cardiol. 1999;84:15J–20J. doi: 10.1016/s0002-9149(99)00352-5. [DOI] [PubMed] [Google Scholar]
- 3.Naghavi M, Madjid M, Khan MR, Mohammadi RM, Willerson JT, Casscells SW. New developments in the detection of vulnerable plaque. Curr Atheroscler Rep. 2001;3:125–135. doi: 10.1007/s11883-001-0048-1. [DOI] [PubMed] [Google Scholar]
- 4.de Korte CL, Cespedes EI, van der Steen AF, Pasterkamp G, Bom N. Intravascular ultrasound elastography: assessment and imaging of elastic properties of diseased arteries and vulnerable plaque. Eur J Ultrasound. 1998;7:219–224. doi: 10.1016/s0929-8266(98)00043-3. [DOI] [PubMed] [Google Scholar]
- 5.Fujimoto JG, Boppart SA, Tearney GJ, Bouma BE, Pitris C, Brezinski ME. High resolution in vivo intra-arterial imaging with optical coherence tomography. Heart. 1999;82:128–133. doi: 10.1136/hrt.82.2.128. [DOI] [PMC free article] [PubMed] [Google Scholar]
- 6.Verheye S, Diamantopoulos L, Serruys PW, Van Langen-hove G. Imaging of atherosclerosis. Intravascular imaging of the vulnerable atherosclerotic plaque: spotlight on temperature measurement. J Cardiovasc Risk. 2002;9:247–254. doi: 10.1177/174182670200900504. [DOI] [PubMed] [Google Scholar]
- 7.Moreno PR, Lodder RA, Purushothaman KR, Charash WE, O’Connor WN, Muller JE. Detection of lipid pool, thin fibrous cap, and inflammatory cells in human aortic atherosclerotic plaques by near-infrared spectroscopy. Circulation. 2002;105:923–927. doi: 10.1161/hc0802.104291. [DOI] [PubMed] [Google Scholar]
- 8.Kopp AF, Schroeder S, Baumbach A, Kuettner A, Georg C, Ohnesorge B, Heuschmid M, Kuzo R, Claussen CD. Non-invasive characterisation of coronary lesion morphology and composition by multislice CT: first results in comparison with intracoronary ultrasound. Eur Radiol. 2001;11:1607–1611. doi: 10.1007/s003300100850. [DOI] [PubMed] [Google Scholar]
- 9.Fayad ZA. The assessment of the vulnerable atherosclerotic plaque using MR imaging: a brief review. Int J Card Imaging. 2001;17:165–177. doi: 10.1023/a:1010611530845. [DOI] [PubMed] [Google Scholar]
- 10.Hecht HS. New developments in atherosclerosis imaging: electron beam tomography. Curr Atheroscler Rep. 2001;3:417–424. doi: 10.1007/s11883-001-0081-0. [DOI] [PubMed] [Google Scholar]
- 11.Tawakol A, Migrino RQ, Hoffmann U, Abbara S, Houser S, Gewirtz H, Muller JE, Brady TJ, Fischman AJ. Noninvasive in vivo measurement of vascular inflammation with F-18 fluorodeoxyglucose positron emission tomography. J Nucl Cardiol. 2005;12:294–301. doi: 10.1016/j.nuclcard.2005.03.002. [DOI] [PubMed] [Google Scholar]
- 12.Laman JD, Schoneveld AH, Moll FL, van Meurs M, Pasterkamp G. Significance of peptidoglycan, a proinflammatory bacterial antigen in atherosclerotic arteries and its association with vulnerable plaques. Am J Cardiol. 2002;90:119–123. doi: 10.1016/s0002-9149(02)02432-3. [DOI] [PubMed] [Google Scholar]
- 13.Shah PK. Role of inflammation and metalloproteinases in plaque disruption and thrombosis. Vasc Med. 1998;3:199–206. doi: 10.1177/1358836X9800300304. [DOI] [PubMed] [Google Scholar]
- 14.Corti R, Badimon JJ. Biologic aspects of vulnerable plaque. Curr Opin Cardiol. 2002;17:616–625. doi: 10.1097/00001573-200211000-00007. [DOI] [PubMed] [Google Scholar]
- 15.Castano AP, Demidova TN, Hamblin MR. Mechanisms in photodynamic therapy: part one—photosensitizers, photochemistry and cellular localization. Photodiagn Photodyn Ther. 2004;1:279–293. doi: 10.1016/S1572-1000(05)00007-4. [DOI] [PMC free article] [PubMed] [Google Scholar]
- 16.Castano AP, Demidova TN, Hamblin MR. Mechanisms in photodynamic therapy: part two-cellular signalling, cell metabolism and modes of cell death. Photodiagn Photodyn Ther. 2004;2:1–23. doi: 10.1016/S1572-1000(05)00030-X. [DOI] [PMC free article] [PubMed] [Google Scholar]
- 17.Dougherty TJ. An update on photodynamic therapy applications. J Clin Laser Med Surg. 2002;20:3–7. doi: 10.1089/104454702753474931. [DOI] [PubMed] [Google Scholar]
- 18.Rockson SG, Lorenz DP, Cheong WF, Woodburn KW. Photoangioplasty: An emerging clinical cardiovascular role for photodynamic therapy. Circulation. 2000;102:591–596. doi: 10.1161/01.cir.102.5.591. [DOI] [PubMed] [Google Scholar]
- 19.Allison BA, Crespo MT, Jain AK, Richter AM, Hsiang YN, Levy JG. Delivery of benzoporphyrin derivative, a photosensitizer, into atherosclerotic plaque of Watanabe heritable hyperlipidemic rabbits and balloon-injured New Zealand rabbits. Photochem Photobiol. 1997;65:877–883. doi: 10.1111/j.1751-1097.1997.tb01938.x. [DOI] [PubMed] [Google Scholar]
- 20.Eldar M, Yerushalmi Y, Kessler E, Scheinowitz M, Goldbourt U, Ben Hur E, Rosenthal I, Battler A. Preferential uptake of a water-soluble phthalocyanine by atherosclerotic plaques in rabbits. Atherosclerosis. 1990;84:135–139. doi: 10.1016/0021-9150(90)90083-u. [DOI] [PubMed] [Google Scholar]
- 21.Hsiang YN, Crespo MT, Richter AM, Jain AK, Fragoso M, Levy JG. In vitro and in vivo uptake of benzoporphyrin derivative into human and miniswine atherosclerotic plaque. Photochem Photobiol. 1993;57:670–674. doi: 10.1111/j.1751-1097.1993.tb02935.x. [DOI] [PubMed] [Google Scholar]
- 22.Neave V, Giannotta S, Hyman S, Schneider J. Hematoporphyrin uptake in atherosclerotic plaques: therapeutic potentials. Neurosurgery. 1988;23:307–312. doi: 10.1227/00006123-198809000-00004. [DOI] [PubMed] [Google Scholar]
- 23.Ladner DP, Steiner RA, Allemann J, Haller U, Walt H. Photodynamic diagnosis of breast tumours after oral application of aminolevulinic acid. Br J Cancer. 2001;84:33–37. doi: 10.1054/bjoc.2000.1532. [DOI] [PMC free article] [PubMed] [Google Scholar]
- 24.Lange N, Vaucher L, Marti A, Etter AL, Gerber P, van Den Bergh H, Jichlinski P, Kucera P. Routine experimental system for defining conditions used in photodynamic therapy and fluorescence photodetection of (non-) neoplastic epithelia. J Biomed Opt. 2001;6:151–159. doi: 10.1117/1.1352751. [DOI] [PubMed] [Google Scholar]
- 25.Pomer S, Grashev G, Sinn H, Kalble T, Staehler G. Laser-induced fluorescence diagnosis and photodynamic therapy of human renal cell carcinoma. Urol Int. 1995;55:197–201. doi: 10.1159/000282785. [DOI] [PubMed] [Google Scholar]
- 26.Sheyhedin I, Okunaka T, Kato H, Yamamoto Y, Sakaniwa N, Konaka C, Aizawa K. Localization of experimental submucosal esophageal tumor in rabbits by using mono-L-aspartyl chlorin e6 and long-wavelength photodynamic excitation. Lasers Surg Med. 2000;26:83–89. doi: 10.1002/(sici)1096-9101(2000)26:1<83::aid-lsm12>3.0.co;2-1. [DOI] [PubMed] [Google Scholar]
- 27.Hamblin MR, Miller JL, Ortel B. Scavenger-receptor targeted photodynamic therapy. Photochem Photobiol. 2000;72:533–540. doi: 10.1562/0031-8655(2000)072<0533:srtpt>2.0.co;2. [DOI] [PubMed] [Google Scholar]
- 28.Demidova TN, Hamblin MR. Macrophage-targeted photodynamic therapy. Int J Immunopathol Pharmacol. 2004;17:117–126. doi: 10.1177/039463200401700203. [DOI] [PMC free article] [PubMed] [Google Scholar]
- 29.Geng Y, Kodama T, Hansson GK. Differential expression of scavenger receptor isoforms during monocyte-macrophage differentiation and foam cell formation. Arterioscler Thromb. 1994;14:798–806. doi: 10.1161/01.atv.14.5.798. [DOI] [PubMed] [Google Scholar]
- 30.Freeman MW. Scavenger receptors in atherosclerosis. Curr Opin Hematol. 1997;4:41–47. doi: 10.1097/00062752-199704010-00007. [DOI] [PubMed] [Google Scholar]
- 31.Dhaliwal BS, Steinbrecher UP. Scavenger receptors and oxidized low density lipoproteins. Clin Chim Acta. 1999;286:191–205. doi: 10.1016/s0009-8981(99)00101-1. [DOI] [PubMed] [Google Scholar]
- 32.de Villiers WJ, Smart EJ. Macrophage scavenger receptors and foam cell formation. J Leukoc Biol. 1999;66:740–746. doi: 10.1002/jlb.66.5.740. [DOI] [PubMed] [Google Scholar]
- 33.Aikawa M, Rabkin E, Okada Y, Voglic SJ, Clinton SK, Brinckerhoff CE, Sukhova GK, Libby P. Lipid lowering by diet reduces matrix metalloproteinase activity and increases collagen content of rabbit atheroma: a potential mechanism of lesion stabilization. Circulation. 1998;97:2433–2444. doi: 10.1161/01.cir.97.24.2433. [DOI] [PubMed] [Google Scholar]
- 34.Rekhter MD. How to evaluate plaque vulnerability in animal models of atherosclerosis? Cardiovasc Res. 2002;54:36–41. doi: 10.1016/s0008-6363(01)00537-5. [DOI] [PubMed] [Google Scholar]
- 35.Kostenich GA, Zhuravkin IN, Zhavrid EA. Experimental grounds for using chlorin e6 in the photodynamic therapy of malignant tumors. J Photochem Photobiol, B. 1994;22:211–217. doi: 10.1016/1011-1344(93)06974-8. [DOI] [PubMed] [Google Scholar]
- 36.Jang IK, Tearney GJ, MacNeill B, Takano M, Moselewski F, Iftima N, Shishkov M, Houser S, Aretz HT, Halpern EF, Bouma BE. In vivo characterization of coronary atherosclerotic plaque by use of optical coherence tomography. Circulation. 2005;111:1551–1555. doi: 10.1161/01.CIR.0000159354.43778.69. [DOI] [PMC free article] [PubMed] [Google Scholar]
- 37.Hsu HY, Chiu SL, Wen MH, Chen KY, Hua KF. Ligands of macrophage scavenger receptor induce cytokine expression via differential modulation of protein kinase signaling pathways. J Biol Chem. 2001;276:28719–28730. doi: 10.1074/jbc.M011117200. [DOI] [PubMed] [Google Scholar]
- 38.Misra UK, Shackelford RE, Florine-Casteel K, Thai SF, Alford PB, Pizzo SV, Adams DO. Maleylated-BSA induces hydrolysis of PIP2, fluxes of Ca2+, NF-kappaB binding, and transcription of the TNF-alpha gene in murine macrophages. J Leukoc Biol. 1996;60:784–792. doi: 10.1002/jlb.60.6.784. [DOI] [PubMed] [Google Scholar]
- 39.Cotena A, Gordon S, Platt N. The class A macrophage scavenger receptor attenuates CXC chemokine production and the early infiltration of neutrophils in sterile peritonitis. J Immunol. 2004;173:6427–6432. doi: 10.4049/jimmunol.173.10.6427. [DOI] [PubMed] [Google Scholar]
- 40.Kim WS, Ordija CM, Freeman MW. Activation of signaling pathways by putative scavenger receptor class A (SR-A) ligands requires CD14 but not SR-A. Biochem Biophys Res Commun. 2003;310:542–549. doi: 10.1016/j.bbrc.2003.09.049. [DOI] [PubMed] [Google Scholar]