

Abstract
This paper describes the design and characterization of a novel ferritin chimera. The iron storage protein ferritin forms a paramagnetic ferrihydrite core. This bio-mineral, when placed in a magnetic field, can decrease the transverse NMR relaxation times (T2 and T2*) of nearby mobile water protons. Ferritin nucleic acid constructs have recently been studied as “probeless” magnetic resonance imaging (MRI) reporters. Following reporter expression, ferritin sequesters endogenous iron and imparts hypointensity to T2- and T2*-weighted images in an amount proportional to the ferritin iron load. Wild-type ferritin consists of various ratios of heavy H and light L subunits, and their ratio affects ferritin's stability and iron storage capacity. We report a novel chimeric ferritin with a fixed subunit stoichiometry obtained by fusion of the L and the H subunits (L*H and H*L) using a flexible linker. We characterize these supramolecular ferritins expressed in human cells, including their iron loading characteristics, hydrodynamic size, subcellular localization, and effect on solvent water T2 relaxation rate. Interestingly, we found that the L*H chimera exhibits a significantly enhanced iron loading ability and T2 relaxation compared to wild-type ferritin. We suggest that the L*H chimera may be useful as a sensitive MRI reporter molecule.
Keywords: Ferritin, Metalloprotein, Molecular imaging, Iron metabolism, NMR relaxation rate
Introduction
Ferritin is an iron-storage protein essential to cellular iron metabolism [1]. Its principal function is to store a bio-available reserve of intracellular iron in a nontoxic form via oxidation of Fe2+ to Fe3+ [2]. Up to 4,500 ferric ions can be packed inside the ferritin shell in the form of paramagnetic ferrihydrite crystal [3]. The shell is assembled from 24 subunits with an outside diameter of ∼ 12 nm and a cavity diameter of ∼9 nm [2].
Holoferritin has a net paramagnetic magnetic moment, and when immersed in a magnetic field it increases the transverse NMR relaxation rates (R2 = 1/T2 and R2* = 1/T2*) of surrounding mobile water [4]. Consequently, this effect can yield a detectable magnetic resonance imaging (MRI) contrast enhancement (hypointensity) in T2- and T2*-weighted images in holoferritin-rich regions. Recently, ferritin metalloproteins have been proposed as a prototype for constructing reporters to image cellular and molecular activity in vivo using MRI [5–8]. Following ferritin transgene expression in situ, the ferritin shells sequester physiologically available iron, and biomineralization of the ferritin core renders the complex paramagnetic, producing a contrasting effect in MRI [9]. Interestingly, ferritin's transverse relaxivity increases linearly with magnetic field strength up to at least 11.7 T without saturation [10, 11]; thus, higher magnetic fields yield images of greater contrast.
Mammalian ferritins are composed of heavy (heart) H and light (liver) L ferritin subunits [12]; these act synergistically, where the L subunits enhance the stability of the ferrihydrite cores, and the H subunits provide the catalytic center for the ferroxidase activity [13]. The tissue distribution of the L:H stoichiometry varies among different organs, developmental stages and metabolic states [14]. For example, the L:H ratio in heart and brain is about 0.3:1. Liver hepatocytes are L-rich and have a 2:1 L:H ratio [3]. Regulatory factors that influence differential L and H expression are inducers of antioxidant response and iron concentration [15]. Commonly, only the H subunit is used for MRI applications since ferritins with H contents that are higher than 40% load iron most efficiently [12]. It is thought that H-rich shells can store more iron and initially confer oxidative resistance to the cells [16]; however, due to the damaging effect of oxidative byproducts at the H ferroxidase site, ferritins with fewer L subunits are less stable and can be a secondary source of cellular toxicity [12]. It has been shown that overexpression of H subunits suppresses cell growth [17], and H-rich ferritins in brain tissue have been implicated in neurodegenerative disease [18, 19].
In an effort to improve the sensitivity of ferritin-based gene reporters, increase shell stability and minimize potential oxidative cytotoxicity, we have designed chimeric ferritin molecules that are composed of fused H and L subunits expressed as a single polypeptide. These ferritin chimeras have a fixed stoichiometry of the subunits (e.g., 1:1 ratio) when expressed in cells. Between the subunits we introduced a flexible linker polypeptide that permits the subunits to fold with respect to each other and form functional ferritin shells. The linker sequence contains the FLAG epitope that ensures the unique identification and enables purification of the chimeric protein. The epitope is flanked by glycine-rich peptides to confer subunit flexibility with no side-chain packing constraints. We compared the properties of chimeric molecules to individually expressed H or L homopolymers, as well as to heteropolymers of H and L expressed concurrently. In human cell lines we investigated the iron-loading capacities of these different ferritins, their NMR relaxation rates, and the resulting MRI contrast. In addition, we isolated the engineered ferritins and characterized their biophysical properties using transmission electron microscopy (TEM) and dynamic light scattering (DLS). Finally, we analyzed the subcellular localization of the engineered ferritins and the homo- and heteropolymeric ferritins using immunostaining and confocal microscopy. We found that the L*H chimera exhibits significantly enhanced iron-loading ability and T2 relaxation time compared to wild-type ferritin.
Materials and methods
Antibodies and proteins
For the ferritin subunits, an L-specific monoclonal 12M antibody (Alpha Diagnostics, San Antonio, TX, USA, FERT12-M) and an anti-human H-specific monoclonal rH02 antibody (kindly provided by Paolo Arosio, University of Brescia, Italy) were used. Iron-responsive protein 2 (IRP2) was detected using monoclonal mouse anti-human antibody (Santa Cruz Biotechnologies, Santa Cruz, CA, USA, 7H6). For epitope tag detection and recombinant ferritin purification, an anti-FLAG mouse monoclonal antibody M2 (Sigma-Aldrich, St. Louis, MO, USA, #F1804) and anti-FLAG affinity reagent M2-Agarose (Sigma, #A2220) were used. As a secondary antibody, a goat anti-mouse, Fab antibody conjugated to AlexaFlour 594 (Invitrogen, Carlsbad, CA, USA, #A11020) was used. For the western blots we used goat anti-mouse secondary antibody conjugated to HRP (Pierce #1858413). Purified ferritin controls were horse spleen ferritin (Sigma, #F4503) and human H ferritin (Lee Biosolutions, St. Louis, MO, USA, #270-70).
cDNAs and viral vectors
Ferritin cDNAs were produced using standard techniques and oligonucleotide-mediated PCR mutagenesis. The oligonucleotides used for construction are listed in the “Electronic supplementary material.” Molecular clones of human H and L were kindly provided by Paolo Arosio, University of Brescia, Italy.
To express transgenes, we constructed replication-deficient, type 5 adenovirus (AdV5, deleted for E1/E3) expression vectors based on the BD Adeno-X™ Expression System 1 (BD Biosciences Clontech, Carlsbad, CA, USA). Briefly, the cDNAs were inserted into appropriate restriction sites in pShuttle-2, and then subcloned into pAd-X plasmid to generate the recombinant adenovirus. We recovered, isolated and propagated viral stocks using human embryonic kidney cells (HEK-293, ATCC, Manassas, VA, USA, #CRL-1573). Working stocks of virus were produced using double CsCl density gradient purification. The final purified vector preparations were dialyzed using TNMG buffer (10 mM Tris, 150 mM NaCl, 1 mM MgCl2, 5% glycerol). The recombinant AdV5 viruses were titered on HEK293 cells using immunodetection for single infectious units.
Recombinant protein expression and purification
Human osteosarcoma cells U2OS (ATCC, #HTB-96) were grown and maintained in complete medium (90% DMEM, 10% FBS) and transduced with AdV using a multiplicity of infection (MOI) of 30. After 48 h, the recombinant L*H and H*L proteins were purified with a single-step FLAG affinity purification method using the Anti-FLAG M2 affinity gel (Sigma, #A2220). The sample purity was confirmed by western blot and Coomassie blue stain of SDS-polyacrylamide gel electrophoresis (PAGE) gelsl.
PAGE
Cells expressing the different ferritins and control reporter (lacZ) were harvested at 48 h post-transduction and lysed in a detergent solution containing protease inhibitor cocktail and EDTA (Pierce, Rockford, IL, USA). Equivalent amounts of clarified samples were resolved on 4–20% polyacrylamide gradient gels using either native PAGE or reducing SDS-PAGE conditions. We used chemiluminescence to expose the immunoreactive bands to photosensitive film (Kodak #1651454).
Confocal microscopy
U2OS cells were grown on glass plates and transduced as described above. At 48 h post-transduction, the cells were washed and fixed using 3% paraformaldehyde. The cells were then probed using antigen-specific antisera followed by secondary reagents as described above. After immunostaining, nuclei were stained with Hoechst 3342 (Calbiochem, La Jolla, CA, USA). The cells were imaged using an Olympus Fluoview-Fv1000 confocal laser-scanning microscope. The red and blue channels were used to compute the Manders colocalization coefficients [20] using ImageJ software (http://rsbweb.nih.gov).
TEM
TEM samples were prepared by applying purified ferritin solutions (0.1 mg/ml in TBS buffer containing 1 mM calcium chloride) to carbon-coated mica, lifting the carbon from the mica, and then floating it on a drop of 1% phosphotungstic acid stain. A copper grid was used to lift the sample out of the stain. Excess stain was removed with filter paper, and the sample was air-dried before imaging. The grids were viewed using a Hitachi H-7100 transmission electron microscope (Hitachi High Technologies America, Pleasanton, CA, USA) operating at 75 kV. Digital images were obtained using an AMT Advantage 10 CCD Camera (Advanced Microscopy Techniques, Danvers, MA, USA). Using ImageJ software, the ferritin shell diameters were measured by averaging individual shell height and width, and these results were averaged together for n = 30 ferritins. Ferritin shell diameters were referenced to a calibration standard consisting of a negatively stained catalase crystal that was imaged alongside the grids.
DLS
To measure protein size distributions, purified ferritin and ferritin standards were assayed with DLS at an approximate concentration of 0.1 mg/ml of ferritin in TBS buffer. The samples were measured using a Malvern ZetaSizer Nano Z-S instrument (Malvern Instruments, Malvern, UK). Sample measurements were performed in triplicate using a low-volume quartz cuvette and a 633 nm He–Ne laser.
Cellular iron content and viability
Cellular iron uptake was measured in HEK-293 cells transduced with each transgene-encoding AdV vector at MOI = 3. Cells were incubated for 48 h post-transduction in low-serum media (98% DMEM, 2% FBS) supplemented with 2 mg/ml holotransferrin (Sigma, #T0665). The cells were then washed several times in PBS and assayed for iron content by treating with guanidinium/ferene-S reagent (6 M guanidinium–HCl, 5 mM ferene-S [3-(2-pyridyl)-5, 6-di(2-furyl)-1,2,4-triazine-5′,5″-disulfonic acid], 250 mM ascorbic acid) at room temperature for 2 h. The iron content of the lysate was measured by spectrophotometer absorbance at 600 nm and calculated using a standard curve of calibrated iron standards. The results were normalized to cell number. To assay the cytotoxicity of the ferritin constructs and the effect on cell proliferation, we performed the MTT [3-(4,5-dimethylthiazol-2-yl)-2, 5-diphenyltetrazolium bromide] assay at 48 h after transduction according to the vendor's specifications (ATCC #30-1010K).
NMR
To assay the effect of ferritin transgene expression on the transverse relaxation rate (R2), U2OS cells were transduced with AdV, as described above, at MOI = 10, and grown in serum-free DMEM for a total of 72 h. At 48 h post-transduction, 1 mM ferric citrate (Sigma, #F3388) was added to the cells in DMEM for the remaining 24 h. The cells were then washed twice with PBS and fixed in 4% paraformaldehyde. The fixed cells were transferred to NMR tubes and pelleted for 4 min at 1,040 rpm. Supernatants were aspirated and the cell pellets were used for NMR relaxation rate measurements. All samples were prepared in triplicate. We measured R2 of the cell pellets at 500 MHz using a Bruker NMR spectrometer (Bruker BioSpin, Billerica, MA, USA) with a conventional Carr–Purcell–Meiboom–Gill sequence, four averages, a repetition time of 10 s, and 14 echoes ranging from 10 to 250 ms. All data were fit to a monoexponential decay curve using the Bruker software.
MRI
Cell pellets used for the NMR measurements were also imaged at 11.7 T using a Bruker microimaging system. We acquired T2*-weighted images using a multi-gradient-echo sequence with a repetition time of 2 s, an inter-echo time of 5 ms, and a total of 12 echoes, a 15 × 15 mm field of view, 128 × 128 image points, and four (1-mm thick) slices through the cell pellets.
Results
We constructed two ferritin chimeras by connecting the C terminus of one ferritin subunit to the N terminus of the other using a linker consisting of a FLAG epitope flanked by a short flexible region. A schematic of the two subunit configurations is shown in Fig. 1. The construct with H-linker-L orientation is designated H*L, and the opposite orientation (L-linker-H) is denoted L*H. Additionally, as benchmark positive controls, we produced individual H and L subunit transgenes that were modified to have a strong Kozak initiation sequence for improved translational efficiency, comparable with L*H and H*L chimeras. The transgene design contained a transcript devoid of an iron-responsive region. The recombinant ferritins and benchmark controls were expressed using AdV5-based gene delivery vectors in human osteosarcoma (U2OS) cells.
Fig. 1.
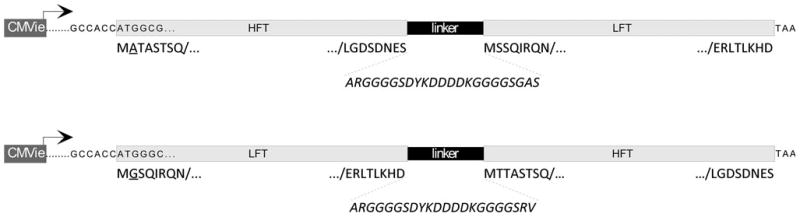
Schematic of chimeric ferritin constructs. The diagrams show the configurations of the H*L (top) and L*H (bottom) gene sequences, including the promoter (CMV), the Kozak sequence, the first two codons of cDNA for reference to the reading frame, the subunit-joining sequences (linker), and the transcriptional stop (TAA). For simplicity, the first and last eight amino acid residues encoding each FT subunit are shown underneath the gene diagrams, where single-residue differences are underlined. The sequence of the peptide linker/epitope is displayed at the bottom and is connected to the subunits by dotted lines (italics)
To demonstrate the relative molecular size of the fused subunits, we used denaturing SDS-PAGE immunoblotting, as shown in Fig. 2a. The L*H and H*L subunits have an apparent molecular weight of about 40 kDa, as expected, which is approximately double the weight of the L subunit used as a control. We next confirmed the proper polymer assembly of the L*H and H*L chimeric ferritins by comparing their migration rate to ferritin L and H homopolymers in native gels (Fig. 2b, c). The comparable band sizes show that all of the ferritins were expressed at similar levels. The native western blot also shows supramolecular ferritin species, i.e., multimeric or aggregate forms of the assembled chimeric shells. The slower migrating, multimeric species of the L*H and H*L appear most similar to those of L (Fig. 2b). In contrast, the native H shells resolve predominantly as a single native species (Fig. 2c).
Fig. 2.
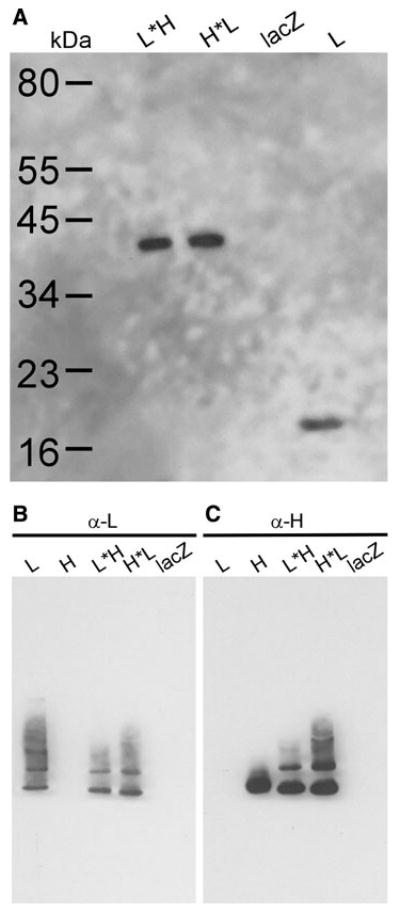
Relative apparent sizes of native and denatured ferritins. The ferritin and control (lacZ) proteins were expressed in U2-OS cells. a Denaturing SDS-PAGE western blot stained for L subunit. The length of the L*H and H*L polypeptide chain is approximately twice the size of L. b Native western blot stained for L. In their native conformation, the chimeric ferritins migrate in the same fashion as wild-type L. c Native western blot stained for the H subunit. The chimeric ferritins show the same molecular size as H but have more supramolecular species forming multimeric bands above the main band
We purified the chimeric ferritins expressed in U2OS cells and imaged the metal–amino acid complexes using TEM. As shown in Fig. 3, both L*H (Fig. 3c) and H*L (Fig. 3d) proteins assembled into spherical shells [21], similar to the control ferritins (Fig. 3a, b). Figure 4a shows the results of the TEM-based size estimates represented by the mean diameter of 30 randomly selected ferritin shells. The mean diameters were significantly different with p < 0.05 using one-way ANOVA. Tukey's method for pair-wise difference showed that the L*H chimera was significantly larger than the control H and H*L with a confidence interval of 0.95.
Fig. 3.
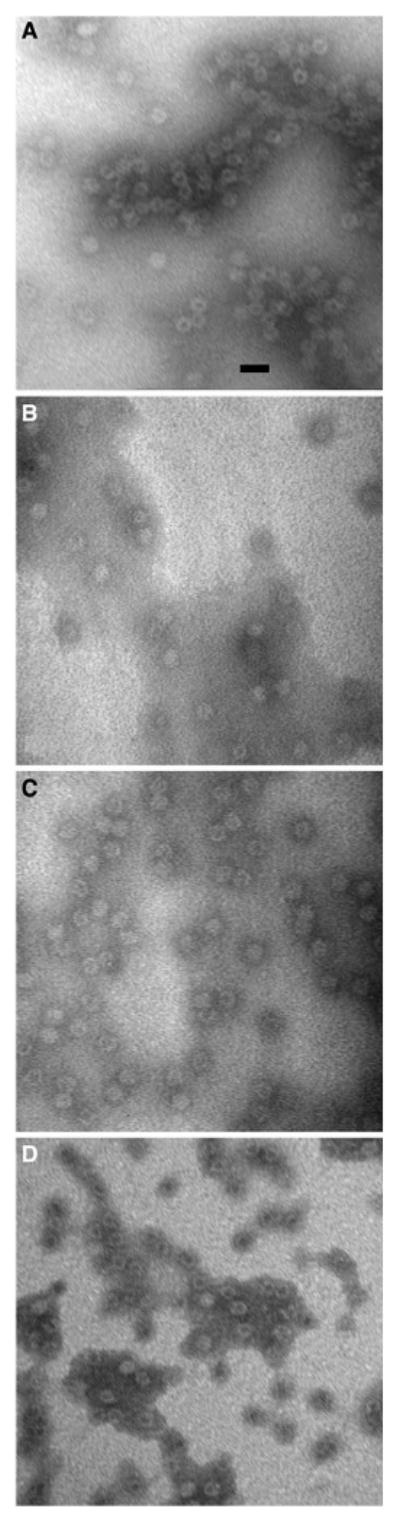
Morphology of chimeric ferritin shells visualized by TEM. In these micrographs, a is H ferritin, b is horse spleen ferritin, c is L*H, and d is H*L. The chimeric ferritin shells are similar in phenotype to the control. Micrographs of negatively stained samples were taken at ×300,000. The scale bar length is 20 μm
Fig. 4.
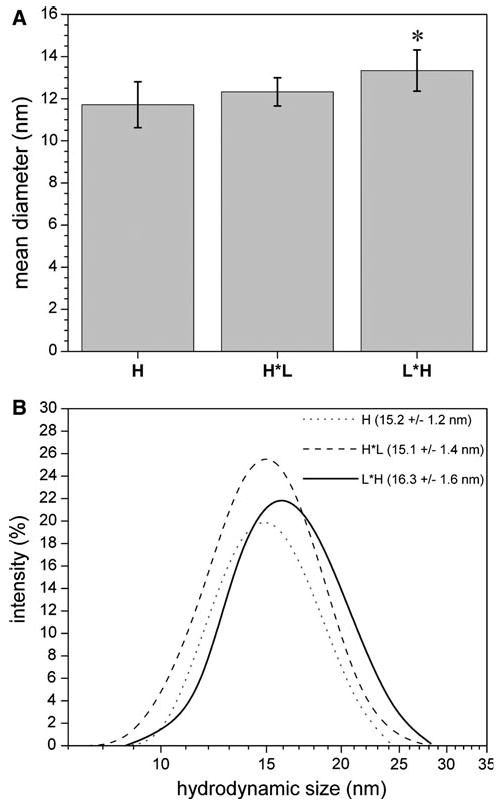
Molecular size of chimeric ferritins and controls. a Apparent molecular size estimated from the TEM images (average of n = 30 shells). Overall, L*H is slightly larger than the other ferritins. b Hydrodynamic size measured via DLS, where the range of the measured diameter is plotted as a function of light scatter intensity. The shift to the right of the L*H distribution curve displays the trend for larger L*H mean size
Additionally, we used DLS to measure the hydrodynamic sizes of the purified ferritin samples, as shown in Fig. 4b. Overall, the DLS results are consistent with the engineered ferritins forming intact shells. There is a perceived upward size shift of the L*H curve on Fig. 4b; however, statistical analysis of the DLS data did not reveal significant size differences among the ferritins measured.
Since ferritin compartmentalization can affect the MRI contrast [22] and possibly cytotoxicity, we next investigated the subcellular localization of the different ferritins in U2OS cells using confocal microscopy. As shown in Fig. 5a, the chimeric proteins display a similar distribution to that of L, which is mostly cytoplasmic with low nuclear presence. In contrast, H displays a high degree of nuclear localization, in addition to presence in the cytoplasm (Fig. 5a, white arrows). All controls, as well as cells expressing the chimeras stained separately for the L and H subunits, are included in the “Electronic supplementary material” (Fig. S1). In order to quantify the observed difference in subcellular distribution, we computed Manders colocalization coefficients [20] for all ferritins. As expected, the H homopolymer had the highest nuclear localization, significantly higher than L and the engineered chimeras (Fig. 5b). Overall, the Manders colocalization coefficients did not show any statistically significant difference between H*L and L or L*H (Fig. 5b).
Fig. 5.
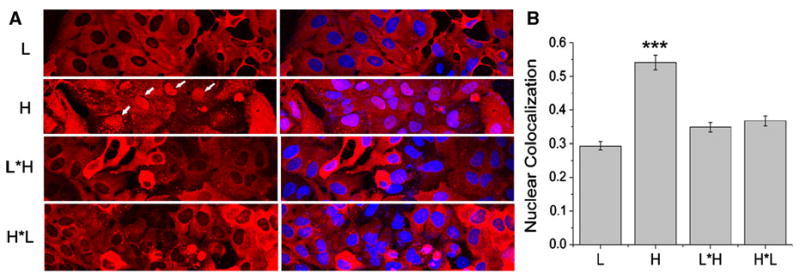
Confocal microscopy of subcellular distributions of recombinant ferritins. a Distributions of the L subunit, H subunit, L*H and H*L. The nuclear localization of H ferritin is marked with white arrows. All other ferritins are cytoplasmic. U2OS cells were transduced with the indicated transgenes for 48 h, fixed, permeabilized, probed with the specific antisera, and then stained with a secondary antibody Alexa Flour 594-Fab (red). Nuclei were counterstained using Hoechst 3342 (blue). b Manders colocalization coefficient computed from the red and blue channels of the confocal images. The H ferritin has significantly higher nuclear localization compared to all other ferritins (p < 0.01, paired t test)
Figure 6a displays the in vitro cellular iron loading. We used one-way ANOVA followed by a Tukey's test to look into the group variations. We found a modest increase in iron loading in cells expressing H and both the separate H and L subunits. Interestingly, the L*H construct loads significantly more iron (p < 0.01) compared to cells co-expressing the H and L subunits. All constructs featured the same Kozak initiation sequence and had the same expression level as seen on the western blots. We used the same multiplicity of infection for all groups. In the case of co-transduction of H and L, there should be the same level of gene transcripts of the H and L subunits; however, we had no control over the final ratio at the stage of shell assembly.
Fig. 6.
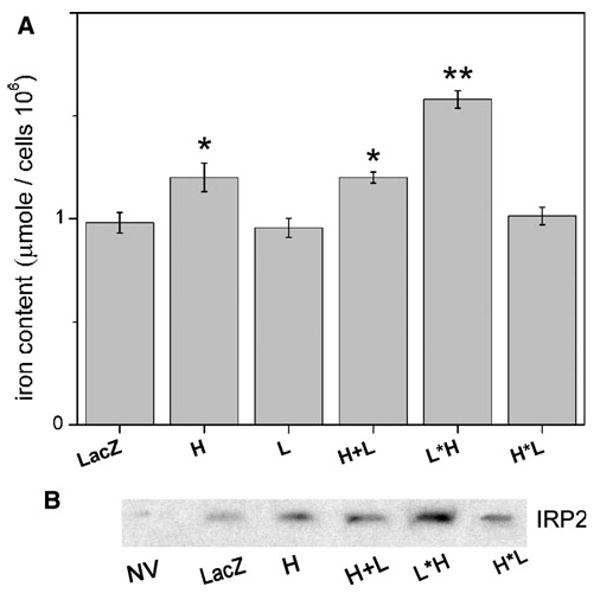
a Iron content of recombinant ferritin expressing cells. Cells (HEK293) were transduced with the transgenes LacZ, H, L, L*H and H*L. Following transduction, the cultures were incubated in low-serum media supplemented with 2 mg/ml purified holotransferrin. At 48 h post-infection, cells were disrupted in guanidinium/ferene-S reagent and assayed by spectrophotometry at 600 nm. Iron content was calculated from a standard curve with an effective sample size of 106 cells/sample. Results are the average of triplicate experiments (n = 3). b Western blot for IRP2 levels in the ferritin-expressing cells. The amount of IRP2 is inversely proportional to the labile iron pool level
Also intriguing is the finding that the iron loading of the H*L construct appears to be no different than those of the control or single subunit expressing cells. Since colorimetric measurement of cellular iron could also include the labile iron pool (LIP) in addition to the ferritin shell content, we also looked into the amount of IRP2 expressed in cells. Iron-dependent proteasomal degradation of IRP2 makes this protein a very good estimator of the cytosolic pool of iron [23, 24]. Figure 6b shows the relative levels of IRP2 in control cells and all ferritin constructs. The L*H-expressing cells have the highest levels of IRP2, which suggests that the measured iron content (Fig. 6a) is not part of the LIP. As expected, the nontransduced cells and cells expressing control vector LacZ have very low levels of IRP2 (Fig. 6b). Overall, these data suggest that the L*H has the greatest tendency to store iron among the ferritin constructs studied.
The NMR transverse relaxation rate (R2) of U2OS cell pellets expressing the different ferritin constructs are shown on Fig. 7a. Overall, we found that L*H induces a significantly higher R2 relaxation rate in the cell pellets compared to the other constructs (p < 0.01). In addition, the relaxation rates of H and H*L are higher than that of the control (p < 0.05). We also measured the longitudinal relaxation rates (R1) of the same samples and saw no statistically significant differences (data not shown). We note that the iron-loading data (Fig. 6a) does not exactly follow the trend seen in the pellet R2 measurement. Figure 6a displays the bulk iron content of the cell, whereas NMR assays the indirect effect of the iron on the water relaxation rate, which may depend on where the iron is situated within the cell and its effective paramagnetic moment at that site (e.g., aggregated within ferritin cores vs. associated with other proteins or in LIP).
Fig. 7.
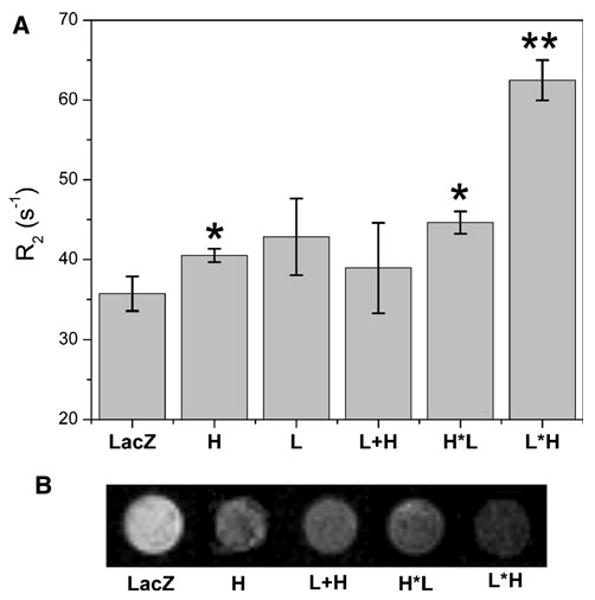
NMR relaxation rates and MRI of transgene-expressing cell pellets. U2OS cells were transduced with the different ferritin constructs and controls, including LacZ, H, L, L*H and H*L. a Measurements of R2 of cell pellets at 500 MHz; results are the average of triplicate pellets per transgene, bars are the standard error for n = 3. The L*H chimera has a significantly higher relaxation rate than those of all other ferritins and the control (p < 0.05). b Representative MRI images of the cell pellets. The L*H shows the most pronounced signal intensity change. Pellets were imaged at 500 MHz (TR/TE = 2,000/11 ms)
The results of T2-weighted MRI of the above ferritin-transduced cell pellets are shown in Fig. 7b; as expected, the LacZ-negative control is the brightest and the L*H pellet is the darkest (i.e., maximum reporter contrast). It is worth noting that the NMR data (Fig. 7a) display the means of triplicate samples, while the MRI data show a single plane across one representative sample (we note that due to the inherent variation of the cell pellets, the pellet intensities observed in the single T2-weighted MRI slice shown do not exactly match the trend seen in the bulk, averaged NMR data for certain samples). Overall, there is an agreement among the iron-loading, NMR and MRI data in that the L*H appears to be the most efficacious reporter.
To ensure that the expression of the ferritin chimeras is not overtly cytotoxic to cells, we performed MTT proliferation assays [25] on 293T cells expressing the different ferritins. Overall, we found no statistically significant difference in the proliferation levels among control LacZ-expressing cells and those expressing the L*H and H*L constructs at 48 h post-transduction (Fig. S2).
Discussion
In this paper we describe the design and characterization of two fusion ferritin chimeras. To characterize these constructs, we utilized an AdV-5 expression system to transduce a human cell line with H, L, and the same subunits fused as two single polypeptide chains (L*H and H*L). The stoichiometric ratio of the H and L subunits was fixed at 1:1. We confirmed that the engineered polypeptide folded properly and assembled into spherical protein shells. Using native western blotting, we confirmed the molecular weight of the engineered ferritins; we also observed the spherical shell phenotype using electron micrographs. We further analyzed the L*H and H*L shell sizes using TEM image analysis and DLS. The TEM data showed that the L*H had a larger protein cage than the wild-type ferritin. The DLS hydrodynamic size distribution of L*H was slightly shifted towards larger diameter, but this effect was not statistically significant. We showed that the L*H was able to load more iron than the other constructs studied under identical tissue culture conditions. In addition, we measured the NMR relaxation rates of cell pellets expressing the different ferritins and found that the R2 relaxation rate of the L*H was significantly higher than those of the wild-type ferritins or the H*L.
Motivation for this work partially stems from the need for “probeless” MRI reporters with high relaxivity and low toxicity. There are several factors governing the rationale behind our chimeric design. At the molecular level, there is a functional role of the ferritin subunits in iron loading; the H chain is known to have ferroxidase activity promoting iron storage, while the L chain stabilizes the shell and promotes crystal nucleation [26]. In wild-type ferritin the relative number of H subunits is slightly lower than the number of L subunits [26]. By fixing the ratio of the two subunits to 1:1, we postulate that this will increase the average number of ferroxidase centers per protein shell, thereby promoting more efficient iron loading and storage. Also, we speculate that there may be enhanced safety in vivo by keeping the subunit ratio constant to ensure that the reporters store iron in stable cages, as the L subunit confers ferritin shell stability [12, 18].
Interestingly, we observed several molecular species as represented by the number of bands on our native western blots (Fig. 2b, c). The bands above the main molecular weight band show different levels of oligomerization among the ferritins. We also verified that there was no protein degradation by running the same samples under denatured conditions (Fig. 2a). Both chimeras display large number of oligomers on the native gel. We speculate that changing the subunit composition of the shells may influence the intermolecular interactions, promoting ferritin aggregation. Several other studies have shown that ferritins have the capacity to form oligomers, and in vivo, ferritin is thought to form aggregates [27]. Notably, a study that fused an H directly to an L subunit established that this hybrid was more soluble in the cytoplasm but that it had the same iron content as standard ferritin, which agrees with our iron loading data for H*L; the study did not look at the relaxation properties of the hybrid or its expression in mammalian cells [28]. The same study compared the intracellular solubility of synthesized hybrid mutants and showed the importance of the N terminus of the H subunit [28]. These results indicate that the N terminus sequence and thus the subunit order of our chimeras may affect macromolecular interactions. Since both chimeras demonstrated oligomerization on the native gels, there could be additional factors such as shell size and subcellular distribution that underline the enhanced relaxation rate of L*H. The functional significance of ferritin aggregates is not completely elucidated, although it may represent a cellular pathway for more efficient cytoprotection [29]. Moreover, recent studies of ferritin aggregation show the importance of these intermolecular interactions on the NMR relaxation rate of surrounding solvent water, and provide evidence that controlled aggregation of ferritin can significantly increase R2 [30]. We speculate that these same correlated magnetic effects due to ferritin aggregation may contribute in part to the R2 enhancement observed in the L*H transduced cell pellets.
The subcellular localization of ferritin has been intensely studied over the last few years [31]. It has been observed that H-enriched ferritin traffics preferentially to the nucleus, while L-rich ferritin is found predominantly in the cytoplasm [32]. The translocation mechanism of H ferritin has not been linked to nuclear localization signals; however, its putative function in the nucleus is thought to be DNA protection [31]. Our confocal study of the subcellular localizations (Fig. 5a) of the different ferritins showed that the engineered chimeras remained primarily in the cytoplasm, similar to L homopolymers, while H ferritin was found in both the nucleus and the cytoplasm. We note that the subcellular localization of a paramagnetic MRI reporter may also play a role in its imaging efficacy, where cytoplasmic localization is preferred in order to gain access to a larger pool of labile iron and mobile water [22].
Ferritin's relaxivity is known to exhibit striking linearity with increasing magnetic field strength due to the magnetic structure of the core [10]. In present models, the structure of the protein shell is not considered to influence the linear behavior, and we speculate that linear relaxivity would also be preserved in the chimeras; this is thus a potential topic for future study.
Conclusions
In this work we have designed and characterized two chimeric ferritins, L*H and H*L, which fold into functional protein shells. The L*H chimera loads more iron than its homopolymeric counterparts and wild-type ferritin. This ferritin chimera combines a higher iron loading capability with, potentially, a safer and more stable shell structure. We expressed the protein in human cells and characterized its phenotype, hydrodynamic size, subcellular distribution, and NMR relaxation rate properties. The L*H ferritin expression results in enhanced contrast in MRI images compared to wild-type ferritin, and this novel construct represents a new reporter for cellular MRI studies.
Supplementary Material
Acknowledgments
We acknowledge valuable technical assistance from Hongyan Xu and Joseph Suhan. We thank Kevin Hitchens for editorial assistance. We acknowledge support from the National Institutes of Health via grants R01-EB005740, P01-HD047675 and P41-EB001977 and a National Science Foundation Graduate Research Fellowship to B.I. (2007053507).
Abbreviations
- AdV5
Adenovirus type 5
- L*H, H*L
Chimeric fusion ferritins
- DLS
Dynamic light scatter
- H
Heavy-chain ferritin
- IRP2
Iron-responsive protein 2
- L
Light-chain ferritin
- MRI
Magnetic resonance imaging
- PAGE
Polyacrylamide gel electrophoresis
- R2
Transverse relaxation rate
Footnotes
Electronic supplementary material: The online version of this article (doi:10.1007/s00775-010-0657-7) contains supplementary material, which is available to authorized users.
References
- 1.Theil EC. Annu Rev Biochem. 1987;56:289–315. doi: 10.1146/annurev.bi.56.070187.001445. [DOI] [PubMed] [Google Scholar]
- 2.Theil E, Matzapetakis M, Liu X. J Biol Inorg Chem. 2006;11:803–810. doi: 10.1007/s00775-006-0125-6. [DOI] [PubMed] [Google Scholar]
- 3.Chasteen ND, Harrison PM. J Struct Biol. 1999;126:182–194. doi: 10.1006/jsbi.1999.4118. [DOI] [PubMed] [Google Scholar]
- 4.Vymazal J, Zak O, Bulte JW, Aisen P, Brooks RA. Magn Reson Med. 1996;36:61–65. doi: 10.1002/mrm.1910360111. [DOI] [PubMed] [Google Scholar]
- 5.Cohen B, Dafni H, Meir G, Harmelin A, Neeman M. Neoplasia. 2005;7:109–117. doi: 10.1593/neo.04436. [DOI] [PMC free article] [PubMed] [Google Scholar]
- 6.Genove G, DeMarco U, Xu HY, Goins WF, Ahrens ET. Nat Med. 2005;11:450–454. doi: 10.1038/nm1208. [DOI] [PubMed] [Google Scholar]
- 7.Cohen B, Ziv K, Plaks V, Israely T, Kalchenko V, Harmelin A, Benjamin LE, Neeman M. Nat Med. 2007;13:498–503. doi: 10.1038/nm1497. [DOI] [PubMed] [Google Scholar]
- 8.Deans AE, Wadghiri YZ, Bernas LM, Yu X, Rutt BK, Turnbull DH. Magn Reson Med. 2006;56:51–59. doi: 10.1002/mrm.20914. [DOI] [PMC free article] [PubMed] [Google Scholar]
- 9.Mills PH, Ahrens ET. Magn Reson Med. 2007;57:442–447. doi: 10.1002/mrm.21145. [DOI] [PubMed] [Google Scholar]
- 10.Vymazal J, Brooks RA, Zak O, McRill C, Shen C, Di Chiro G. Magn Reson Med. 1992;27:368–374. doi: 10.1002/mrm.1910270218. [DOI] [PubMed] [Google Scholar]
- 11.Gilad AA, Winnard PT, Jr, van Zijl PC, Bulte JW. NMR Biomed. 2007;20:275–290. doi: 10.1002/nbm.1134. [DOI] [PubMed] [Google Scholar]
- 12.Santambrogio P, Levi S, Cozzi A, Rovida E, Albertini A, Arosio P. J Biol Chem. 1993;268:12744–12748. [PubMed] [Google Scholar]
- 13.Levi S, Yewdall SJ, Harrison PM, Santambrogio P, Cozzi A, Rovida E, Albertini A, Arosio P. Biochem J. 1992;288:591–596. doi: 10.1042/bj2880591. [DOI] [PMC free article] [PubMed] [Google Scholar]
- 14.Wilkinson Jt, Di X, Schonig K, Buss JL, Kock ND, Cline JM, Saunders TL, Bujard H, Torti SV, Torti FM. Biochem J. 2006;395:501–507. doi: 10.1042/BJ20060063. [DOI] [PMC free article] [PubMed] [Google Scholar]
- 15.Theil E. Biometals. 2007;20:513–521. doi: 10.1007/s10534-006-9063-6. [DOI] [PubMed] [Google Scholar]
- 16.Cozzi A, Corsi B, Levi S, Santambrogio P, Albertini A, Arosio P. J Biol Chem. 2000;275:25122–25129. doi: 10.1074/jbc.M003797200. [DOI] [PubMed] [Google Scholar]
- 17.Guo JH, Juan SH, Aust SD. Biochem Biophys Res Commun. 1998;242:39–45. doi: 10.1006/bbrc.1997.7910. [DOI] [PubMed] [Google Scholar]
- 18.Connor JR, Snyder BS, Arosio P, Loeffler DA, LeWitt P. J Neurochem. 1995;65:717–724. doi: 10.1046/j.1471-4159.1995.65020717.x. [DOI] [PubMed] [Google Scholar]
- 19.Kaur D, Rajagopalan S, Chinta S, Kumar J, Di Monte D, Cherny RA, Andersen JK. Brain Res. 2007;1140:188–194. doi: 10.1016/j.brainres.2006.03.006. [DOI] [PubMed] [Google Scholar]
- 20.Manders EMM, Verbeek FJ, Aten JA. J Microsc. 1993;169:375–382. doi: 10.1111/j.1365-2818.1993.tb03313.x. [DOI] [PubMed] [Google Scholar]
- 21.Williams MA, Harrison PM. Biochem J. 1968;110:265–280. doi: 10.1042/bj1100265. [DOI] [PMC free article] [PubMed] [Google Scholar]
- 22.Donahue KM, Weisskoff RM, Burstein D. J Magn Reson Imaging. 1997;7:102–110. doi: 10.1002/jmri.1880070114. [DOI] [PubMed] [Google Scholar]
- 23.Guo B, Phillips JD, Yu Y, Leibold EA. J Biol Chem. 1995;270:21645–21651. doi: 10.1074/jbc.270.37.21645. [DOI] [PubMed] [Google Scholar]
- 24.Rouault TA. Nat Chem Biol. 2006;2:406–414. doi: 10.1038/nchembio807. [DOI] [PubMed] [Google Scholar]
- 25.Mosmann T. J Immunol Methods. 1983;65:55–63. doi: 10.1016/0022-1759(83)90303-4. [DOI] [PubMed] [Google Scholar]
- 26.Levi S, Santambrogio P, Cozzi A, Rovida E, Corsi B, Tamborini E, Spada S, Albertini A, Arosio P. J Mol Biol. 1994;238:649–654. doi: 10.1006/jmbi.1994.1325. [DOI] [PubMed] [Google Scholar]
- 27.Voss P, Horakova L, Jakstadt M, Kiekebusch D, Grune T. Free Radic Res. 2006;40:673–683. doi: 10.1080/10715760500419357. [DOI] [PubMed] [Google Scholar]
- 28.Lee J, Kim SW, Kim YH, Ahn JY. Biochem Biophys Res Commun. 2002;298:225–229. doi: 10.1016/s0006-291x(02)02429-4. [DOI] [PubMed] [Google Scholar]
- 29.Quintana C, Bellefqih S, Laval JY, Guerquin-Kern JL, Wu TD, Avila J, Ferrer I, Arranz R, Patino C. J Struct Biol. 2006;153:42–54. doi: 10.1016/j.jsb.2005.11.001. [DOI] [PubMed] [Google Scholar]
- 30.Boyd D, Vecoli C, Belcher DM, Jain SK, Drysdale JW. J Biol Chem. 1985;260:11755–11761. [PubMed] [Google Scholar]
- 31.Surguladze N, Patton S, Cozzi A, Fried MG, Connor JR. Biochem J. 2005;388:731–740. doi: 10.1042/BJ20041853. [DOI] [PMC free article] [PubMed] [Google Scholar]
- 32.Cai CX, Linsenmayer TF. J Cell Sci. 2001;114:2327–2334. doi: 10.1242/jcs.114.12.2327. [DOI] [PubMed] [Google Scholar]
Associated Data
This section collects any data citations, data availability statements, or supplementary materials included in this article.