

Abstract
BACKGROUND AND PURPOSE
Renal fibroblasts play a pivotal role in the development of tubulointerstitial fibrosis, a condition highly predictive of progression towards end-stage renal disease. The present study investigated the anti-mitogenic and anti-inflammatory effects of an inhibitor of inosine monophosphate dehydrogenase, mycophenolic acid (MPA) and the mechanisms underlying its action in normal rat kidney fibroblasts (49F cells).
EXPERIMENTAL APPROACH
Proliferation of 49F cells was studied by tetrazole 3-(4, 5-dimethylthiazol-2-yl-)-2,5-diphenyltetrazolium bromide (MTT) test, bromodeoxyuridine incorporation and flow cytometry. The cyclins, tumour suppressor genes and phospho-mitogen-activated protein kinases (MAPKs) were semiquantified by immunoblotting. Apoptosis was measured by quantifying the fragmented DNA and the activity of caspase 3. The monocyte chemokine CCL2 was measured by ELISA. The mRNA expression of CCL2 was measured by real-time PCR.
KEY RESULTS
Mycophenolic acid dose-dependently inhibited steady-state proliferation of 49F cells by up-regulation of p21, p27 and p53, in association with a decrease in cyclins D2 and E. Treatment with MPA also triggered apoptosis of 49F cells by activating the caspase 3 cascade. Furthermore, MPA attenuated tumour necrosis factor-α-induced CCL2 expression through down-regulation of p38 MAPK, but not that of ERK1/2 or JNK.
CONCLUSIONS AND IMPLICATIONS
The anti-mitogenic and anti-inflammatory effects of MPA were mediated by up-regulation of cell cycle inhibitors and pro-apoptotic signals, and by suppression of p38 MAPK pathway respectively. This dual effect of MPA may form the rationale for animal or clinical trials for the treatment of fibrotic renal diseases.
Keywords: mycophenolic acid, monocyte chemoattractant protein-1, apoptosis, mitogen-activated protein kinase
Introduction
Fibrotic renal disease is characterized by accumulation of extracellular matrix (ECM) proteins within the glomerulus and the interstitium, leading ultimately to glomerulosclerosis and tubulointerstitial fibrosis (Qian et al., 2008; Ma and Fogo, 2007; Qi et al., 2006; Zoja et al., 2006). Glomerulosclerosis is a process by which normal glomerular structure is replaced by accumulated deposits of ECM. It represents a common pathway for the loss of functioning glomeruli associated with most forms of chronic kidney disease (Gagliardini and Benigni, 2007). By contrast, the mechanisms leading to the development of tubulointerstitial fibrosis include transdifferentiation of tubular cells to myofibroblasts, infiltration of monocytes and overproduction of ECM proteins by intrinsic parenchymal cells. Among those, renal fibroblasts play a pivotal role in the development of tubulointerstitial fibrosis, and the extent of this fibrosis is highly predictive of progression towards end-stage renal disease (Okada and Kalluri, 2005). Thus, strategies targeting the proliferation of and/or the cytokine production by these cells might have therapeutic value in the treatment of fibrotic renal disease.
Mycophenolic acid (MPA), the active component of mycophenolate mofetil (MMF), is an inhibitor of inosine monophosphate dehydrogenase (IMPDH) that blocks de novo purine biosynthesis, inhibits T and B-lymphocyte proliferation, and induces apoptosis of activated T-lymphocytes (Boldt et al., 2006). To date, MMF is widely used in solid organ transplantation, in several autoimmune diseases, and steroid-resistant primary glomerulopathies (Sepe et al., 2008). In experimental models, MMF has shown its ability to inhibit proliferation of renal fibroblasts (Badid et al., 2000), and prevent the progressive renal failure in rat remnant kidney (Romero et al., 1999). MMF treatment also prevents the development of glomerular injury (Utimura et al., 2003), and ameliorates early renal injury via inhibition of the over-expression of the intercellular adhesion molecule (ICAM)-1 and the chemokine CCL2 (MCP-1; nomenclature follows Alexander et al., 2009) in renal tissue in diabetic rats (Wu et al., 2006). Despite all these in vitro and in vivo effects, the molecular mechanisms whereby MPA act to inhibit mitogenesis and/or inflammation remain largely unexplored. Previous studies have reported that MPA is capable of inhibiting CCL2 (Farivar et al., 2005; Guo et al., 2005; Wu et al., 2006), a key chemotactic cytokine involved in the migration of circulating monocytes, but the signalling pathways is not fully elucidated. The present study investigated the signal transduction mechanisms underlying the anti-mitogenic and anti-inflammatory effects of MPA in a rat renal fibroblast cell line (49F cells). Our data showed that up-regulation of cell cycle inhibitors (p21, p27 and p53) and caspase 3 activity, and suppression of p38 mitogen-activated protein kinase (MAPK) pathway, respectively, mediated the dual effect of this drug.
Methods
Rat renal fibroblast cultures
The cell line of 49F fibroblasts was obtained from the American Tissue Culture Collection (ATCC, Manassas, VA, USA) and propagated in DMEM supplemented with 1% non-essential amino acid (Gibco, Grand Island, NY, USA), 2 mM L-glutamine (Life Technologies), 100 U·mL−1 penicillin/100 µg·mL−1 streptomycin (Life Technologies) and 10% heat-inactivated FBS.
PI stain and flow cytometry
To study the cell cycle arrest induced by MPA, we analysed the proportion of cells in G0/G1 by flow cytometry. The fibroblasts were cultured as described previously (Lin et al., 2002). After 8, 16, 24 and 48 h incubation with DMSO 0.05%, MPA 0.1, 1.0 and 10.0 µM, the cells adherent to the bottom of the dishes were collected. Briefly, cells were washed twice with phosphate buffered saline (PBS), harvested by trypsinization, centrifuged and suspended with 1 mL of cold PBS and then fixed in methanol for 30 min on ice. Following two washes with PBS, fixed cells were incubated in RNase (1 mg·mL−1) at 37°C for 30 min, followed by staining of the DNA with propidium iodide 1 µg·µL−1 (PI, Sigma-Aldrich Co. MO, USA) at 4°C for 30 min in the dark; each sample was analysed with a Coulter EPICS 753 flow cytometer and the proportion (%) of cells within the G0/G1 phases of the cell cycle were determined by formulated DNA protocol (ModFit software).
Cell proliferation assay
Cell proliferation was evaluated with tetrazole 3-(4, 5-dimethylthiazol-2-yl-)-2,5-diphenyltetrazolium bromide (MTT) cell proliferation assay, performed by the manufacturer's instructions (ATCC). Briefly, the renal fibroblasts were distributed into 96-well plates (0.25 cm2 per well; Falcon, Winiger, Switzerland) at a density of 1.0 × 10³ cells per well. Subsequently, cells were propagated in culture medium (0.2 mL per well) containing 10% FCS, with or without MPA (0.1, 1.0, 10.0 µM) and guanosine (10, 50, 100 µM). We counted the numbers of viable cells at 24, 48 and 72 h after the MPA treatment. Cells were incubated in the presence of 0.5 mg·mL−1 of MTT reagent for 4–8 h, after which the cells were lysed by the addition of one volume of solubilization solution (40% dimethylformamide, 10% SDS, pH 4.0). Absorbance in wells was read with a microplate reader with a 550 nm cut-off filter. We used a standard curve to convert the absorbance to cell numbers by directly counting viable cells and its corresponding absorbance. All the values of absorbance were then converted to cell numbers
Quantitative real-time PCR
Quantitative real-time PCR was carried out in the Applied Biosystems 7900 Real Time PCR System using TaqMan gene expression assays for the CCL2, ICAM-1 and vascular cell adhesion molecule (VCAM)-1 according to the manufacturer's instructions (assay ID Rn00580555_m1, Rn00564227_m1 and Rn00681045_m1 respectively). GAPDH (assay ID Hs99999905_m1) was used as endogenous control in TaqMan human endogenous control plate (Applied Biosystems USA). Cycle to threshold was recorded for statistical analysis. Sample dilutions comprised of 100 ng template cDNA. All samples were tested in a total volume of 20 µL in triplicate.
The mRNA levels of CCL2, ICAM-1 and VCAM-1 were normalized with the mRNA level of GAPDH, and expressed as 2−ΔΔCT, where ΔΔCT = (ΔCTx−ΔCTGAPDH and X = CCL2, ICAM-1 and VCAM-1).
Enzyme linked immunosorbent assay (ELISA)
The rat renal fibroblasts were cultured in 10-cm diameter dishes with culture medium containing 10% FBS to reach near confluence. The supernatants were removed, and the cells were washed twice with basal medium (without FBS). And then the cells were incubated in fresh DMEM with 10% FBS. The cell supernatants were collected 24 h after stimulation with tumour necrosis factor-α (TNF-α; 5 ng·mL−1). The concentrations of CCL2 in the supernatants were measured by enzyme-linked immunoassay (Endogen Rat CCL2 (MCP-1) ELISA Kit, Endogen, Woburn, MA, USA). Cell counts in each dish was calculated to calibrate the amounts of CCL2 in the supernatants. In brief, 50 µL of reconstituted standards and test samples were added to each well. The plate was covered with an adhesive plate cover, and was incubated for 1 h at room temperature about 20–25°C Then we washed the plate three times with wash buffer. 50 µL of biotinylated antibody reagent was added to each well for 1 h incubation at room temperature. At the end of the incubation period, the plate was washed three times again with wash buffer. 100 µL of prepared Streptavidin-HRP solution was added to each well for 30 min at room temperature. At the end of the incubation, the plate was washed three times again with wash buffer. Thereafter, 100 µL of premixed 3, 3′, 5, 5′-tetramethylbenzidine substrate solution was added into each well. After 30 min for development of enzymatic colour reaction in the dark at room temperature, the substrate reaction yielded a blue solution that turns yellow when stop solution, 100 µL to each well, was added. We measured the absorbance on an ELISA reader set at 450 and 550 nm within 30 min of stopping the reaction. Assay at two wavelengths allowed correction for optical imperfections in the microtiter plate.
Bromodeoxyuridine (BrdU) test
Cell proliferation was determined by BrdU incorporation analysis. 49F cells were plated in 96-well plates (100 cells per well, counted with a haemocytometer). Twelve hours after spreading, BrdU (HTS01, Calbiochem EMD Chemicals, Inc., CA, USA) was added to the medium for 2 h. The medium was removed, and the BrdU incorporated in the new synthesized DNA was quantified by a fluorimeter, measuring excitation at 320 nm and emission at 460 nm.
Assay for caspase 3 activity
To measure caspase 3 activity, cell samples for each of the treatment groups were homogenized in 1.5 mL of PBS, assayed with the CPP32/caspase-3 colorimetric protease assay kit (Chemicon International, Inc.), and read at 405 nm in a microtiter plate reader.
DNA fragmentation ELISA
Apoptosis was measured by the detection of DNA fragments (Roche Applied Science). Triplicate 5-ml cultures at 1 × 10³ cells·mL−1 were incubated in medium with 10 µM BrdU for 18 h. The cells were washed and resuspended in fresh medium. Triplicate 200 µL cultures medium were incubated with or without drug as indicated. The cells were then pelleted by centrifugation and 100 µL of the culture medium was removed for ELISA of the DNA fragments; to assess cell death by necrosis. The cells were then lysed and DNA fragments in the lysate were measured by ELISA; to measure cell death by apoptosis. Absorbance in wells was read with a microplate reader with a 450 nm.
Western blotting
To determine the expression of various cyclins, p21, p27, p53 and MAPKs, the cells were incubated in different concentrations of MPA (0.1, 1.0, 10.0 µM) and stimulated with TNF-α (5 ng·mL−1). After incubation for 5 min and 24 h, the cells were harvested and cyclin D1, D2, D3, E, p21, p27, p53 and MAPK were quantified by Western blotting assay. Cells were solubilized in lysis buffer. Equal amounts of protein (40 µg) were separated on a 10% polyacrylamide gel and transferred to Immobilon P. Blots were probed with different antibodies, followed by a horseradish peroxidase-coupled anti-rabbit secondary antibody. Immunoreactive proteins were visualized with enhanced chemiluminescence (Pierce, Rockford, IL, USA).
Statistics
All of the experiments were in triplicate, at least. Statistical analysis was performed with the Mann–Whitney U-test using the Stat View software package (Abacus Concepts, Inc., Berkeley, CA, USA). Statistical significance was accepted for P < 0.05. The statistical methods were recommended by the statistics specialist of the Graduate Institute of Clinical Medicine, National Taiwan University College of Medicine.
Materials
Dulbecco's modified Eagle's media (DMEM), penicillin/streptomycin, fetal calf serum (FCS) and other tissue culture reagents were purchased from Gibco BRL (Rockville, MD, USA). Culture flasks and plates were purchased from Costa Corning (Cambridge, MA, USA). MPA, guanosine, PD98059, SP600125 and SB203580 were purchased from Sigma-Aldrich Co. (MO, USA). Recombinant rat TNF-α was obtained from R & D Systems (Minneapolis, MN, USA). Mouse anti-rat polyclonal antibodies against cyclin D1, D2, D3, E, p21, p27 and p53 were purchased from Santa Cruz (CA, USA). Rabbit anti-rat CCL2 (MCP-1) was purchased from PeproTech EC LTD (London, UK). Rabbit anti-ERK1/2 and anti-p38 MAPK, and rabbit anti-phosphorylated ERK1/2 and anti-phosphorylated p38 MAPK were obtained from New England BioLab (Beverly, MA, USA). Mouse anti-phosphorylated JNK and rabbit anti-JNK were purchased from Santa Cruz Biotechnologies (Santa Cruz, CA, USA). Rabbit anti-GAPDH was obtained from Sigma. All chemicals used for total RNA isolation, reverse transcription-polymerase chain reaction, Northern blot analysis, whole cell lysate extraction and Western blot analysis were of molecular grade and were obtained from Sigma or Roche Molecular Biochemicals (Mannheim, Germany) unless otherwise specified.
Results
The 49F cells were spread on 96 well plates with 1000 cells per well. The number of viable cells was evaluated by the MTT assay, 24, 48 and 72 h after spreading. In the control group, cell numbers increased by about 1000 cells per day. Neither treatment with DMSO (0.05%; the vehicle for MPA) nor MPA (0.1 µM) changed the growth rate of 49F cells, after treatment for 24 h. At 1.0 µM, MPA significantly attenuated the growth rate of viable 49F cells and at 10.0 µM, MPA further inhibited the growth of 49F cells (Figure 1A). It is noteworthy that some anti-mitogenic effect of MPA on renal fibroblasts could be observed at the clinically achievable concentration of 1.0 µM.
Figure 1.
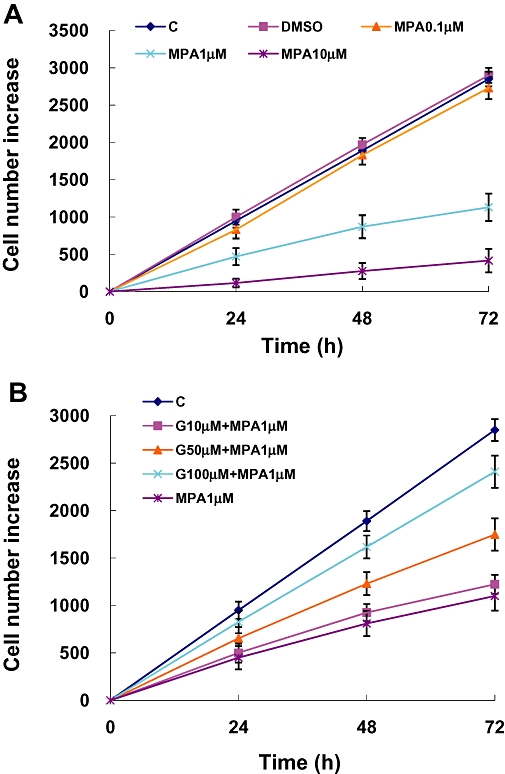
Increase in numbers of viable cells under the different experimental conditions was determined by the MTT assay 24, 48 and 72 h after treatments. The absorbance values have been converted to the corresponding viable cell numbers by interpolation using a standard curve. (A) The concentration-dependent effect of MPA treatment. (B) Effects of guanosine in reversing the inhibition of cell proliferation by MPA. C, control; D, DMSO 0.05% only; G, guanosine MPA, mycophenolic acid; MTT, tetrazole 3-(4, 5-dimethylthiazol-2-yl-)-2,5-diphenyltetrazolium bromide.
Because MPA acts by inhibition of IMPDH and the resultant depletion of intracellular guanosine, in the next experiments, we tested the effects of guanosine repletion on the anti-proliferative effect of MPA. As shown on Figure 1B, guanosine concentration-dependently reversed the growth-inhibitory effect of MPA at 1.0 µM, with the highest concentration of guanosine (100 µM) almost completely reversing the anti-mitogenic effect of MPA.
To evaluate the effect of MPA on apoptosis and cell cycle proteins, 49F cells were treated with MPA (0.1, 1.0 or 10.0 µM) for 12 h. Then, BrdU uptake was measured to estimate the DNA synthesis rate. Our results showed that the vehicle for MPA (DMSO; 0.05%) did not alter affect the DNA synthesis. On the other hand, MPA concentration-dependently inhibited the rate of DNA synthesis. In addition, guanosine 100 µM did not enhance the basal DNA synthesis rate, but reversed the inhibitory effect of MPA at 1.0 µM (Figure 2A). When the cell cycle was analysed by flow cytometry, we found that the proportion of cells at G0/G1 phase increased under MPA treatment. The MPA-induced cell cycle arrest was dose- and time-dependent. The G0/G1 proportion of 49F cells increased from the basal 60% to over 80% 24 h after treatment with MPA at 1.0 µM (Figure 2B). We further analysed the expression of G1 phase cyclins, i.e. cyclin D1, D2, D3 and cyclin E, by immunoblotting 24 h after treatment (Figure 3A). The amounts of cyclin D2 and cyclin E were significantly attenuated under MPA treatment. The effects of MPA on cyclin D2 and cyclin E were dose-dependent and could be reversed partially by supplying guanosine (Figure 3A). The effect of MPA on the expression of the cell cycle inhibitors p53, p21 and p27 were also explored and we found that MPA induced the expression of all three proteins (Figure 3B). The induction of p53 and p27 by MPA could be reversed partially by guanosine dose-dependently (Figure 3B).
Figure 2.
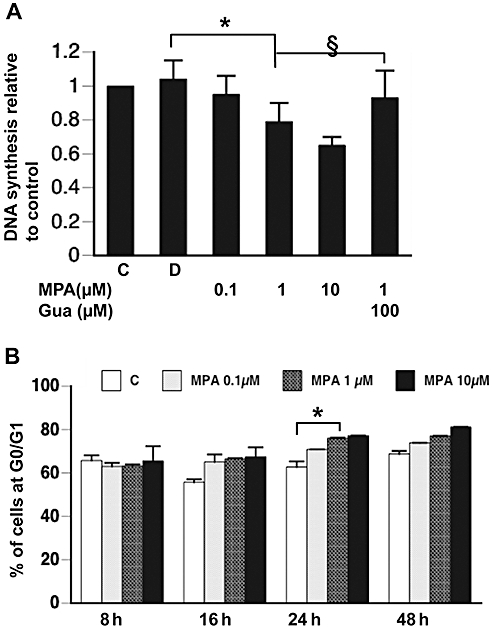
(A) DNA synthesis in renal fibroblasts determined by BrdU incorporation over 2 h, assayed after the different treatments for 12 h. *P < 0.001; §P < 0.01. (B) Percentage of cells in G0/G1 phase determined by flow cytometry 8, 16, 24, 48 h after the different treatments. *P < 0.01. BrdU, bromodeoxyuridine; C, control; D, DMSO 0.05% only; Gua, guanosine.
Figure 3.
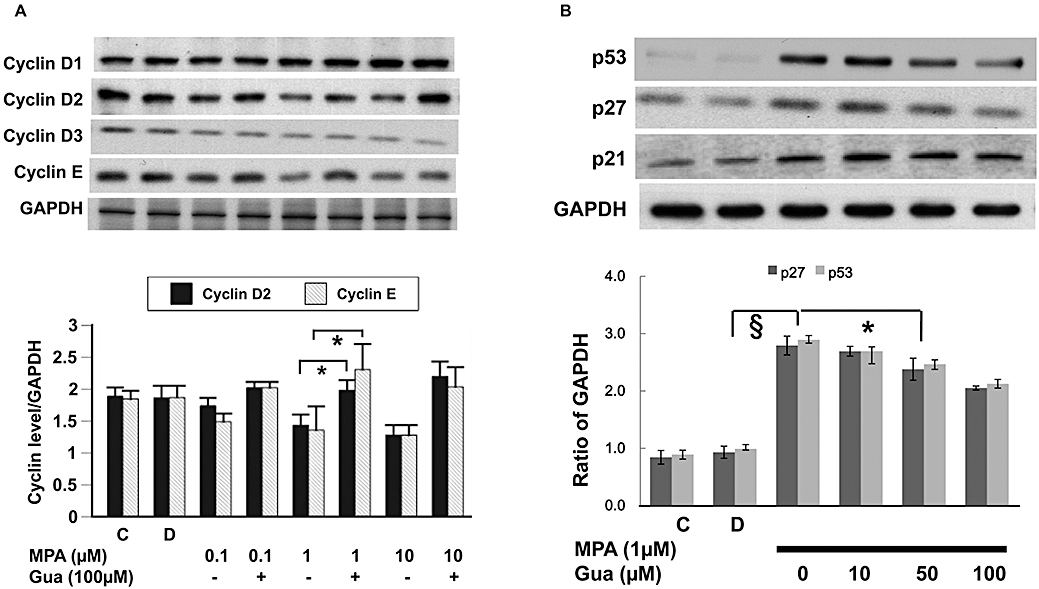
(A) Expression of G1 cyclins determined by immunoblotting (upper panel) and quantified by densitometry (lower panel). *P < 0.01. (B) Expression of tumour suppressor genes determined by immunoblotting (upper panel), and p27 and p53 quantified by densitometry (lower panel). §P < 0.001; *P < 0.01. C, control; D, DMSO 0.05% only; Gua, guanosine.
In order to quantify the cellular apoptosis after treatment with MPA, we incubated the cells in BrdU-containing medium for 24 h, before treatment with MPA (0.1, 1.0 or 10.0 µM). The BrdU-containing DNA fragment in the culture supernatant and the cytoplasm was quantified by immunoassay 24 h after treatment. Vehicle (DMSO; 0.05%) did not increase the BrdU-containing DNA fragments in either the culture supernatant or cell lysate but these fragments were significantly increased by MPA (1.0 µM; Figure 4A) Guanosine concentration-dependently reversed the MPA induced increase of DNA fragment in either the culture medium or cell lysate (Figure 4A) We further analysed the activity of caspase 3 in 49F cells with the different treatments and found that MPA dose-dependently increased caspase 3 activity, and this effect was reversed by guanosine repletion (Figure 4B).
Figure 4.
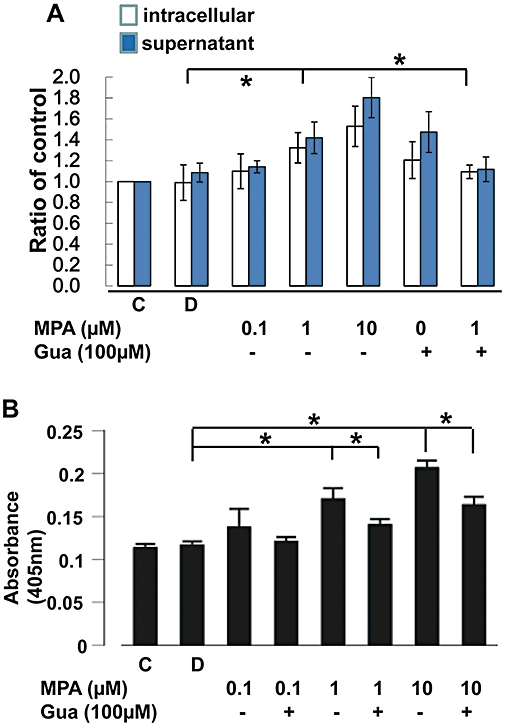
Fragmented DNA determined by detecting pre-incorporated BrdU 24 h after treatment. (A) The intracellular DNA fragments obtained from the attached cells and the DNA fragments in the supernatant were measured separately. *P < 0.01. (B) Caspase 3 activity assayed by absorbance at 405 nm (cleavage of the caspase 3-specific substrate). *P < 0.01. BrdU, bromodeoxyuridine; C, control; D, DMSO 0.05% only; Gua, guanosine.
Subsequently, we studied the effect of MPA on the expression of chemotactic molecules produced by renal fibroblasts. We found that TNF-α concentration-dependently stimulated the expression of mRNA for CCL2 in 49F cells. In addition, TNF-α concentration-dependently stimulated the expression of the mRNAs of the cellular adhesion molecules, ICAM-1 and VCAM-1(data not shown). The secretion of CCL2 protein by 49F cells was induced by TNF-α (Figure 5A). The protein expression of ICAM-1 and VCAM-1 in 49F cells was also markedly enhanced by TNF-α (data not shown). Pretreatment with MPA concentration-dependently attenuated TNF-α-stimulated CCL2 secretion as well as expression of CCL2 mRNA (Figure 5A and B). By contrast, MPA did not alter TNF-α-stimulated ICAM-1 and VCAM-1 mRNA expression (Figure 5C and D).
Figure 5.
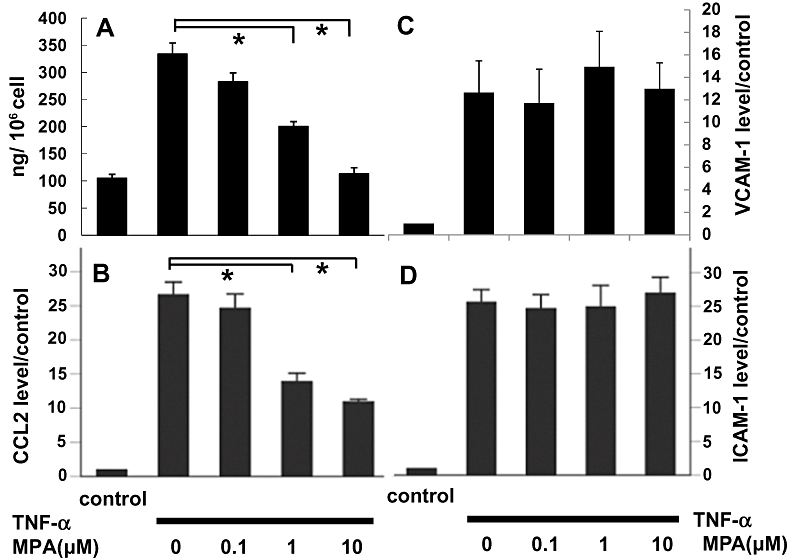
(A) CCL2 (MCP-1) secretion in the supernatant determined by ELISA, 24 h after TNF-α (5 ng·mL−1) stimulation. (B, C and D) Expression of the mRNA for CCL2, VCAM-1 and ICAM-1 of 49F cells determined by real-time PCR, 8 h after treatment by TNF-α (5 ng·mL−1) and presented as fold-increase over the control. *P < 0.001. ICAM, intercellular adhesion molecule; TNF-α, tumor necrosis factor-α; VCAM-1, vascular cell adhesion molecule-1.
The MAPK signalling pathways mediate the synthesis of some inflammatory cytokines. We examined the phosphorylation of p38 MAPK, ERK1/2 and JNK after stimulation with TNF-α (5 ng·mL−1). Our data showed that MPA dose-dependently attenuated TNF-α-induced p38 MAPK, but not JNK phosphorylation (Figure 6A). Inhibiting p38 MAPK phosphorylation by S203580 dose-dependently attenuated TNF-α-stimulated CCL2 mRNA expression as well as CCL2 secretion (Figure 6B). Inhibition of JNK phosphorylation did not exert the same inhibitory effect on CCL2 (Figure 6C). Therefore, through inhibiting p38 MAPK phosphorylation, MPA may attenuate TNF-α-stimulated CCL2 mRNA expression and thereafter, CCL2 secretion.
Figure 6.
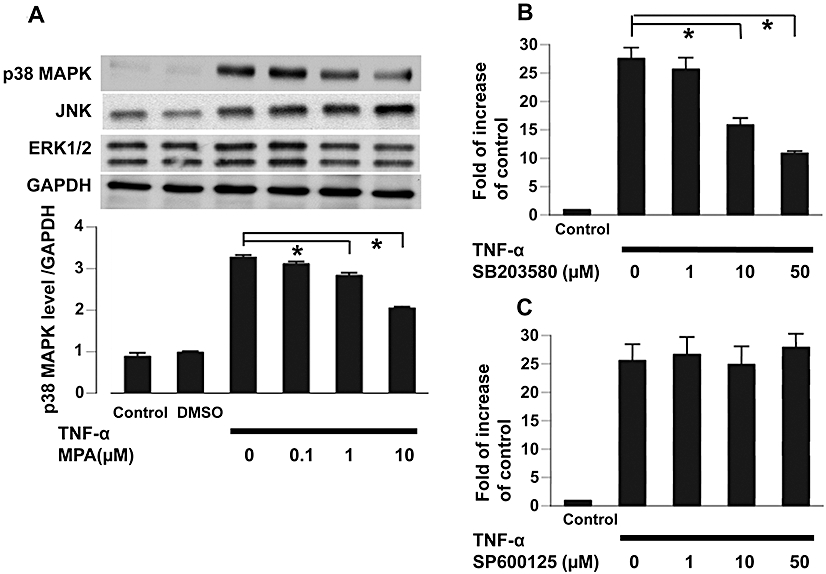
(A) Activation of MAPK, p38 MAPK, JNK and ERK1/2, determined by immunoblotting with phospho-MAPK-specific antibodies (upper panel) and quantified by densitometry for p38 MAPK (lower panel) 5 min after TNF-α (5 ng·mL−1) treatment. *P < 0.01. (B). The effect of SB203580, an inhibitor of p38 MAPK phosphorylation, on TNF-α (5 ng·mL−1)-stimulated CCL2 mRNA expression. *P < 0.01. (C). The effect of JNK inhibitor, SP600125, on TNF-α (5 ng·mL−1)-stimulated CCL2 mRNA expression. The mRNA levels were determined by real-time PCR and were expressed as fold-increase, relative to control. MAPK, mitogen-activated protein kinase; TNF-α, tumor necrosis factor-α.
Discussion
In this study, we demonstrate for the first time that MPA is capable of inhibiting the proliferation of normal rat kidney fibroblasts and the production of CCL2 by these cells after TNF-α stimulation. Depletion of guanosine by MPA might lead to cell cycle arrest and apoptosis via induction of the cell cycle inhibitors, p27 and p53. Besides the anti-mitogenic action, MPA also attenuated TNF-α-induced CCL2, but not ICAM-1/VCAM-1 production through down regulation of the phosphorylation of p38 MAPK in renal fibroblasts.
Mycophenolic acid as the immunosuppressive drug MMF, has been widely used in solid organ transplantation and has shown its effect on chronic renal allograft rejection. MMF blocks the enzyme IMPDH which is responsible for de novo biosynthesis of guanosine. Particularly in lymphocytes, this block leads to a depletion of guanosine and consequently to inhibition of cell proliferation. There is also evidence that MPA has anti-mitogenic and anti-fibrotic properties in non-immune cells (Morath et al., 2006). Here we have demonstrated that MPA concentration-dependently inhibited the steady-state proliferation of renal fibroblasts. Of note, the clinically achievable MPA concentration of 1.0 µg·mL−1 was capable of attenuating the growth of rat renal fibroblasts by 50%. This effect of MPA was largely dependent on depletion of guanosine synthesis as shown by reversal of the growth inhibition with repletion of guanosine concentration-dependently.
The effect of MPA on cell cycle progression has been well-documented in human T and B lymphocytes (Lalibertéet al., 1998; Végso et al., 2007). MPA inhibits the phosphorylation of retinoblastoma protein (pRb) and stop cells from entering into S-phase (Lalibertéet al., 1998). The expression of cyclin D3 in T cells activated by interleukin-2 (IL-2) and leucoagglutinin is completely prevented by MPA treatment (Lalibertéet al., 1998). In addition, MPA prevents the IL-2-induced elimination of p27Kip 1, a CDK inhibitor, and resulted in the retention of high levels of p27Kip 1 bound to CDK2 (Chiara et al., 2005). In contrast to these effects observed in T cells, our data in renal fibroblasts showed that MPA dose-dependently inhibited the expression of cyclin D2 and cyclin E, whereas the expressions of cyclin D1 and D3 were not changed. Further, in accord with that observed in T lymphocytes, we found that treatment with MPA resulted in an increase in p27Kip1, which in turn lead to inhibition of the CDK activity and blockade of pRb phosphorylation (Toyoshima and Hunter, 1994; Sherr and Roberts, 1999), and thereby preventing cell cycle progression from G1 to S phase. This study also found that MPA was capable of inducing p53 and p21 expression in renal fibroblasts. Given the well-known growth-modulatory actions mediated by these two proteins (Cox, 1997; Gartel and Tyner, 2002), we surmise that induction of p53 and p21 by MPA may contribute, at least in part, to the anti-mitogenic effect of this drug.
While MPA/MMF has been reported to induce programmed cell death in a variety of blood cells (Takebe et al., 2006; Végso et al., 2007; Yamaguchi et al., 2008), there is little information regarding its pro-apoptotic effect in tissues, although MPA had been shown to induce apoptosis of primary rat islet cells by activating the caspase 3 activity (Kim et al., 2008). In this study, we found that MPA not only inhibited the proliferation of renal fibroblasts but also induced apoptosis of these cells. Our results implied that MPA might inhibit growth of 49F cells by two mechanisms. By depleting guanosine, MPA suppressed the rate of new DNA synthesis while, at the same time, activating capsase 3 and the pro-apoptotic cascade.
In experimental renal diseases, MPA was able to reduce macrophage accumulation within the kidney (Romero et al., 1999; Utimura et al., 2003) MMF inhibited the over-expression of CCL2 and ICAM-1 in streptozotocin-induced diabetic rats, both of which contribute to the infiltration and accumulation of macrophages in the kidney. (Wu et al., 2006) The present study showed that MPA attenuated TNF-α-induced CCL2, but not ICAM-1/VCAM-1 production through down-regulation of the phosphorylation of p38 MAPK in renal fibroblasts. The discrepant effect of MPA/MMF on ICAM-1 may be due to variability of cell types and under different stimulations. In experimental animals, there is up-regulation of several pro-inflammatory cytokines, and the expression of ICAM-1 and the secretion of CCL2 involves several different cell types. On the other hand, in our in vitro model, we specifically observed that, although TNF-α induced the expression of ICAM-1 and CCL2 in renal fibroblasts, MPA selectively inhibited CCL2 secretion, rather than ICAM-1 expression, in these cells.
In cultured mesangial cells, MPA effectively blocked p38 MAPK activation and exogenous guanosine partially reversed this inhibition (Ha et al., 2006). Inhibition of p38 MAPK activation by MPA leads to inhibition of proliferation and ECM synthesis in mesangial cells (Ha et al., 2006). However, inhibition of the activation of p38 MAPK by MPA on has not been reported in renal fibroblasts. By inhibiting p38 MAPK, MPA not only inhibits macrophage infiltration, but also may offer the benefit of inhibiting ECM synthesis in fibroblasts, as in mesangial cells.
In conclusion, our data suggest that the anti-mitogenic and anti-inflammatory effects of MPA were mediated by up-regulation of cell cycle inhibitors (p21, p27 and p53) and of caspase 3 activity, and down-regulation of the p38 MAPK pathway respectively. The dual effect of MPA on 49F fibroblast proliferation and CCL2 production may form the rationale for assessing MPA for the treatment of fibrotic renal diseases.
Acknowledgments
We wish to thank Ms. Chen-Chin Chang and Shu-Ying Chou for their valuable technical support. This work was supported by the grants from the National Science Council, NSC-93-2314-B-002-141 (to KD Wu), and the Mrs Hsiu-Chin Lee Kidney Research Fund and NTUH-MG141 (to KD Wu). We thank the staffs of the 2nd Core Lab, Department of Medical Research, National Taiwan University Hospital for technical supports.
Glossary
Abbreviations
- BrdU
bromodeoxyuridine
- ECM
extracellular matrix
- IMPDH
inhibitor of inosine monophosphate dehydrogenase
- MAPK
mitogen-activated protein kinase
- MCP-1
monocyte chemoattractant protein-1; CCL2
- MMF
mycophenolate mofetil
- MPA
mycophenolic acid
- MTT
tetrazole 3-(4, 5-dimethylthiazol-2-yl-)-2,5-diphenyltetrazolium bromide
- TNF-α
tumour necrosis factor-α
- VCAM-1
vascular cell adhesion molecule-1
Conflicts of interest
None to declare.
References
- Alexander SPH, Mathie A, Peters JA. Guide to Receptors and Channels (GRAC), 4th edn. Br J Pharmacol. 2009;158(Suppl. 1):S1–S254. doi: 10.1111/j.1476-5381.2009.00499.x. [DOI] [PMC free article] [PubMed] [Google Scholar]
- Badid C, Vincent M, McGregor B, Melin M, Hadj-Aissa A, Veysseyre C, et al. Mycophenolate mofetil reduces myofibroblast infiltration and collagen III deposition in rat remnant kidney. Kidney Int. 2000;58:51–61. doi: 10.1046/j.1523-1755.2000.00140.x. [DOI] [PubMed] [Google Scholar]
- Boldt A, Barten MJ, Sagner A, Mohr FW, Adams V, Dhein S, et al. The influence of immunosuppressive drugs on T- and B-cell apoptosis via p53-mediated pathway in vitro and in vivo. Transplantation. 2006;82:422–427. doi: 10.1097/01.tp.0000229036.75483.15. [DOI] [PubMed] [Google Scholar]
- Chiara M, Menegatti E, Di Simone D, Davit A, Bellis D, Sferch D, et al. Mycophenolate mofetil and roscovitine decrease cyclin expression and increase p27(kip1) expression in anti Thy1 mesangial proliferative nephritis. Clin Exp Immunol. 2005;139:225–235. doi: 10.1111/j.1365-2249.2004.02684.x. [DOI] [PMC free article] [PubMed] [Google Scholar]
- Cox LS. Multiple pathways control cell growth and transformation: overlapping and independent activities of p53 and p21Cip1/WAF1/Sdi1. J Pathol. 1997;183:134–140. doi: 10.1002/(SICI)1096-9896(199710)183:2<134::AID-PATH960>3.0.CO;2-D. [DOI] [PubMed] [Google Scholar]
- Farivar AS, MacKinnon-Patterson B, Barnes AD, Mulligan MS. The effect of anti-inflammatory properties of mycophenolate mofetil on the development of lung reperfusion injury. J Heart Lung Transplant. 2005;24:2235–2242. doi: 10.1016/j.healun.2005.06.005. [DOI] [PubMed] [Google Scholar]
- Gagliardini E, Benigni A. Therapeutic potential of TGF-beta inhibition in chronic renal failure. Expert Opin Biol Ther. 2007;7:293–304. doi: 10.1517/14712598.7.3.293. [DOI] [PubMed] [Google Scholar]
- Gartel AL, Tyner AL. The role of the cyclin-dependent kinase inhibitor p21 in apoptosis. Mol Cancer Ther. 2002;1:639–649. [PubMed] [Google Scholar]
- Guo H, Leung JC, Chan LY, Lui SL, Tsang AW, Lai KN. Modulation of intra-pulmonary TGF-beta expression by mycophenolate mofetil in lupus prone MRL/lpr mice. Lupus. 2005;14:583–592. doi: 10.1191/0961203305lu2170oa. [DOI] [PubMed] [Google Scholar]
- Ha H, Kim MS, Park J, Huh JY, Huh KH, Ahn HJ, et al. Mycophenolic acid inhibits mesangial cell activation through p38 MAPK inhibition. Life Sci. 2006;79:1561–1567. doi: 10.1016/j.lfs.2006.05.001. [DOI] [PubMed] [Google Scholar]
- Kim JY, Huh KH, Park YJ, Fang Y, Kang CM, Kim YS. Molecular mechanisms of cell death of mycophenolic acid-treated primary isolated rat islets: implication of mitogen-activated protein kinase activation. Transplant Proc. 2008;40:2575–2577. doi: 10.1016/j.transproceed.2008.07.123. [DOI] [PubMed] [Google Scholar]
- Laliberté J, Yee A, Xiong Y, Mitchell BS. Effects of guanine nucleotide depletion on cell cycle progression in human T lymphocytes. Blood. 1998;91:2896–2904. [PubMed] [Google Scholar]
- Lin SL, Chen YM, Chien CT, Chiang WC, Tsai CC, Tsai TJ. Pentoxifylline attenuated the renal disease progression in rats with remnant kidney. J Am Soc Nephrol. 2002;13:3024–3026. doi: 10.1097/01.asn.0000034909.10994.8a. [DOI] [PubMed] [Google Scholar]
- Ma LJ, Fogo AB. Modulation of glomerulosclerosis. Semin Immunopathol. 2007;29:385–395. doi: 10.1007/s00281-007-0087-y. [DOI] [PubMed] [Google Scholar]
- Morath C, Schwenger V, Beimler J, Mehrabi A, Schmidt J, Zeier M, et al. Antifibrotic actions of mycophenolic acid. Clin Transplant. 2006;20(Suppl. 1):25–29. doi: 10.1111/j.1399-0012.2006.00597.x. [DOI] [PubMed] [Google Scholar]
- Okada H, Kalluri R. Cellular and molecular pathways that lead to progression and regression of renal fibrogenesis. Curr Mol Med. 2005;5:467–474. doi: 10.2174/1566524054553478. [DOI] [PubMed] [Google Scholar]
- Qi W, Chen X, Poronnik P, Pollock CA. The renal cortical fibroblast in renal tubulointerstitial fibrosis. Int J Biochem Cell Biol. 2006;38:1–5. doi: 10.1016/j.biocel.2005.09.005. [DOI] [PubMed] [Google Scholar]
- Qian Y, Feldman E, Pennathur S, Kretzler M, Brosius FC., 3rd From fibrosis to sclerosis: mechanisms of glomerulosclerosis in diabetic nephropathy. Diabetes. 2008;57:1439–1445. doi: 10.2337/db08-0061. [DOI] [PMC free article] [PubMed] [Google Scholar]
- Romero F, Rodríguez-Iturbe B, Parra G, González L, Herrera-Acosta J, Tapia E. Mycophenolate mofetil prevents the progressive renal failure induced by 5/6 renal ablation in rats. Kidney Int. 1999;55:945–955. doi: 10.1046/j.1523-1755.1999.055003945.x. [DOI] [PubMed] [Google Scholar]
- Sepe V, Libetta C, Giuliano MG, Adamo G, Dal Canton A. Mycophenolate mofetil in primary glomerulopathies. Kidney Int. 2008;73:154–162. doi: 10.1038/sj.ki.5002653. [DOI] [PubMed] [Google Scholar]
- Sherr CJ, Roberts JM. CDK inhibitors: positive and negative regulators of G1-phase progression. Genes Dev. 1999;13:1501–1512. doi: 10.1101/gad.13.12.1501. [DOI] [PubMed] [Google Scholar]
- Takebe N, Cheng X, Fandy TE, Srivastava RK, Wu S, Shankar S, et al. IMP dehydrogenase inhibitor mycophenolate mofetil induces caspase-dependent apoptosis and cell cycle inhibition in multiple myeloma cells. Mol Cancer Ther. 2006;5:457–466. doi: 10.1158/1535-7163.MCT-05-0340. [DOI] [PubMed] [Google Scholar]
- Toyoshima H, Hunter T. p27, a novel inhibitor of G1 cyclin-Cdk protein kinase activity, is related to p21. Cell. 1994;78:64–74. doi: 10.1016/0092-8674(94)90573-8. [DOI] [PubMed] [Google Scholar]
- Utimura R, Fujihara CK, Mattar AL, Malheiros DM, Noronha IL, Zatz R. Mycophenolate mofetil prevents the development of glomerular injury in experimental diabetes. Kidney Int. 2003;63:209–216. doi: 10.1046/j.1523-1755.2003.00736.x. [DOI] [PubMed] [Google Scholar]
- Végso G, Sebestyén A, Paku S, Barna G, Hajdu M, Tóth M, et al. Antiproliferative and apoptotic effects of mycophenolic acid in human B-cell non-Hodgkin lymphomas. Leuk Res. 2007;31:1003–1008. doi: 10.1016/j.leukres.2006.12.019. [DOI] [PubMed] [Google Scholar]
- Wu YG, Lin H, Qi XM, Wu GZ, Qian H, Zhao M, et al. Prevention of early renal injury by mycophenolate mofetil and its mechanism in experimental diabetes. Int Immunopharmacol. 2006;6:445–453. doi: 10.1016/j.intimp.2005.09.006. [DOI] [PubMed] [Google Scholar]
- Yamaguchi T, Hashiguchi K, Katsuki S, Iwamoto W, Tsuruhara S, Terada S. Activation of the intrinsic and extrinsic pathways in high pressure-induced apoptosis of murine erythroleukemia cells. Cell Mol Biol Lett. 2008;13:49–57. doi: 10.2478/s11658-007-0034-x. [DOI] [PMC free article] [PubMed] [Google Scholar]
- Zoja C, Abbate M, Remuzzi G. Progression of chronic kidney disease: insights from animal models. Curr Opin Nephrol Hypertens. 2006;15:250–257. doi: 10.1097/01.mnh.0000222691.53970.83. [DOI] [PubMed] [Google Scholar]