

Abstract
Objective. Serum cytokines play an important role in the pathogenesis of myositis by initiating and perpetuating various cellular and humoral autoimmune processes. The aim of the present study was to describe a broad spectrum of T- and B-cell cytokines, growth factors and chemokines in patients with idiopathic inflammatory myopathies (IIMs) and healthy individuals.
Methods. A protein array system, denoted as multiplex cytokine assay was utilized to measure simultaneously the levels of 24 circulating cytokines, including B-cell activating factor (BAFF) and a proliferation inducing ligand (APRIL) of patients with IIMs and healthy individuals. Additionally, correlational clustering and discriminant function analysis (DFA), two multivariate, supervised analysis methods were employed to identify a subset of biomarkers in order to describe potential functional interrelationships among these pathological cytokines.
Results. Univariate analysis demonstrated that a complex set of immune and inflammatory modulating cytokines are significantly up-regulated in patients with IIMs relative to unaffected controls including IL-10, IL-13, IFN-α, epidermal growth factor (EGF), VEGF, fibroblast growth factor (FGF), CCL3 [macrophage inflammatory protein (MIP-1α)], CCL4 (MIP-1β) and CCL11 (eotaxin), whereas G-CSF was significantly reduced in IIM patients. Correlational clustering was able to discriminate between, and hence sub-classify patients with IIMs. DFA identified EGF, IFN-α, VEGF, CCL3 (MIP-1α) and IL-12p40, as analytes with the strongest discriminatory power among various myositis patients and controls.
Conclusions. Our findings suggest that these factors modulate myositis pathology and help to identify differences between subsets of the disease.
Keywords: Idiopathic inflammatory myopathies, Circulating cytokines, B-cell activating factor, A proliferation inducing ligand
Introduction
Idiopathic inflammatory myopathies (IIMs) encompass a heterogeneous group of systemic immune-mediated connective tissue disorders that include PM, DM, juvenile dermatomyositis (JDM), overlap myositis (OM), cancer-associated myositis (CAM) and IBM [1]. IIMs are relatively rare diseases. Estimates of prevalence range from 0.5 to 9.3 cases/million [1–3].
While these conditions may share certain similarities, they have distinct clinical, histopathological, immunological and pathogenic features [1–3]. Although the skeletal muscle pathology in IIMs generally consists of focal inhomogeneous chronic inflammation with albeit variable endomysial, perimysial or perivascular mononuclear infiltration, certain characteristic differences in these different subtypes reflect their distinct pathophysiological pathways [4–6]. A cascade of inflammatory mediators, primarily cytokines are key players of these immune responses. They modulate important distinct biological cellular functions that trigger downstream signalling pathways, and mediate immune cell proliferation and differentiation in IIMs. Differences between PM and DM in the level of peripheral blood lymphocytes and their intracellular cytokine content have been reported [7]. Studies on cytokine gene, RNA and protein expression in muscle tissue from patients with various forms of the disease indicate similar profiles, despite different phenotypes of the inflammatory cells present in muscle tissue from the different subsets of myositis. A wide range of cytokines have been described to be expressed in muscle tissue and elevated in blood from patients with IIMs, amongst others the pro-inflammatory cytokines IL-1α, IL-1β, TNF-α, as well as the inhibitory cytokine TGF-β [8–11].
Many of these pro-inflammatory cytokines induce metabolic effects on myocytes, which are likely to play a role in the characteristic muscle degeneration observed in these patients and indicate additional pathogenic pathways for inducing muscle dysfunction in patients with chronic inflammatory myopathies besides muscle fibre necrosis [12–14]. There is also a characteristically high expression of MHC class I, and to a somewhat lesser extent MHC Class II, on muscle fibres associated with myositis indicating that the muscle cells actively participate in the inflammatory process by mediating recognition and invasion by cytotoxic T cells [8–10].
Several cytokines, including IL-1, TNF-α and IFNs, which are known to be potent inducers of MHC Class I expression on muscle fibres [15] have been observed in muscle tissue of these patients, supporting the assumption that cytokines play a pivotal role in the pathogenesis.
A shared histopathological feature in this heterogeneous group of disorders is the presence of inflammatory infiltrates in muscle tissue, mostly consisting of T cells and macrophages [16, 17]. The infiltrating cells detected in affected muscles from patients with IIMs are potent producers of pro-inflammatory cytokines. However, inflammatory cell infiltrates are not always detectable; moreover, the presence or absence of inflammatory cell clusters does not always correlate with the clinical symptom of muscle weakness [1, 9, 10]. Thus, cytokines produced by cell types other than the inflammatory cells, such as IL-1α expressed in endothelial cells, could also play a role in disease mechanism and contribute to the clinical symptoms.
B-cell activating factor (BAFF) and a proliferation-inducing ligand (APRIL) are members of the TNF superfamily [18–22]. Despite the similar structure and shared receptor specificity, BAFF and APRIL have distinct functions. APRIL appears to play a role in T-independent type II antigen responses and T-cell survival, and can also induce proliferation/survival of non-lymphoid cells [23]. BAFF enhances the survival of immature B cells at the T1 and T2 stages of development as well as of mature B-cells in vitro [24]. Recently, BAFF has also been suggested to be involved in T-cell responses. BAFF co-stimulates human T-cell activation in vitro [25, 26]. BAFF, APRIL and their receptors have been shown to have key functions in both B- and T-cell homeostasis and could be instrumental in the pathogenesis of autoimmune diseases. Abnormal levels of both BAFF and APRIL have been observed in patients with autoimmune diseases, such as SLE, RA and SS [27–29]. It follows, therefore, that these molecules represent exciting new targets of therapeutic intervention in autoimmune diseases [30].
The aim of the present study was to identify a broad spectrum of cytokines, chemokines, growth and angiogenic factors, as well as BAFF and APRIL, in the peripheral blood of patients with IIMs, and utilize multivariate biostatistical analyses to describe putative regulatory networks among these factors. In doing so, we have demonstrated the presence of disease-perpetuating cytokines up-regulated in IIMs, sera, mediators with both diagnostic and mechanistic potential. We have also characterized likely interplay among these cytokines using multivariate analysis methods that model network-like behaviour among biological variables. Finally, we have followed up the cytokine profile of a patient with JDM before and after various treatment modalities by utilizing univariate and multivariate analyses and pinpointed key cytokines, clearly reflecting the disease improvement, therefore being excellent candidates for therapeutic efficacy indicators.
Materials and methods
Patients
Seventy-two Caucasian patients (55 females and 17 males) with IIM, who were diagnosed, treated and followed up at the Division of Clinical Immunology, 3rd Department of Internal Medicine, Medical and Health Science Center, University of Debrecen, and the 2nd Department of Pediatrics, Semmelweis University, Budapest, Hungary participated in this study. The mean age of the patients was 39.42 years (range: 5.99–81.88). The cohort included 21 patients with PM, 26 patients with DM, 9 patients with JDM, 9 patients with CAM and 7 patients with OM. In the OM group, the associated autoimmune diagnoses included RA (three patients), SSc (two patients), polychondritis (PC; one patient) and SS (one patient). All patients fulfilled the Bohan and Peter criteria for definite IIM [31] and the diagnosis of OM was defined by the presence of Bohan and Peter criteria for myositis, as well as the criteria for the corresponding CTD [32–36]. All patients in the study had active disease. To control for the influence of treatment, while low-dose corticosteroids were allowed, patients on immunosuppressive drugs, or biologics were excluded from the study. The cohort also included 25 age- and sex-matched healthy Caucasian controls, all of whom were healthy blood donors, without any sign of myositis, arthritis, ongoing inflammation or autoimmune conditions. Controls were medication free at least 3 months before this study. General laboratory and immuno-laboratory assessments included ESR/Westergren (ESR/We), CRP, white blood cell (WBC) count, haemoglobin (Hb) and a broad spectrum of imunoserological investigations, including IgG, IgA, IgM, complement (C)3, C4, IC, complement activity (CH50), cryoglobulin, ANA, RF, anti-dsDNA, anti-Sm, anti-Sm/RNP, ENA, anti-SS-A, anti-SS-B, anti-Scl-70, anti-Jo-1, aCL, anti-β2glycoprotein I (B2GPI)-IgG/IgA/IgM, ACA, ASM, anti-liver–kidney microsomal (LKM), parietal cell antibodies, AMA, ANCAs, anti-cyclic citrullinated peptide (CCP), AECAs, thyroglobulin antibodies (TGs), anti-thyroid peroxidase (TPO). In JDM, the provisional Paediatric Rheumatology International Trials Organization ACR/EULAR criteria for the evaluation of response to therapy were used to assess clinical response [37]. Health assessment questionnaire (HAQ), myositis disease activity assessment tool (MDAAT), manual muscle strength testing (MMT), along with muscle-associated enzymes [creatine kinase (CK), LDH] were assessed in IIM patients. In adults, functional outcome and quality of life was measured by the Health Assessment Questionnaire Disability Index (HAQDI) and Short Form 36-item questionnaire (SF-36) [38]. The protocol was in full compliance with Good Clinical Practices, the Declaration of Helsinki and the guidelines of the Medical and Health Science Centre of the University of Debrecen. The study has been approved by the institutional ethics committee (Regional and Institutional Ethics Committee, Medical and Health Science Centre, University of Debrecen). Written informed consent was obtained from all patients for publication of the study.
Serum samples
Blood samples were obtained from both patients and unaffected controls after informed consent and treated anonymously throughout the analysis. Blood was collected in endotoxin-free silicone-coated tubes without additive. The blood samples were allowed to clot at room temperature for 30 min before centrifugation (1800 RCF, 4°C, 10 min) and the serum was removed and stored at −80°C until analysed.
Multiplex cytokine assay
Serum levels of cytokines and chemokines, including IL-1β, IL-2, IL-4, IL-5, IL-6, IL-7, CXCL8 (IL-8), IL-10, IL-12 (p40), IL-13, IL-15, IL-17, IFN-α and IFN-γ, TNF-α, GM-CSF, IFN-induced-protein-10 (IP-10), CCL2 [monocyte chemoattractant protein-1 (MCP-1)/(MCAF)], CCL3 [macrophage inflammatory protein 1-α (MIP-1α)], CCL4 [macrophage inflammatory protein 1β (MIP-1β)], CCL11 (eotaxin) and IL-1 receptor α (IL-1Rα) were measured using a bead-based immunofluorescence assay (Luminex, Austin, TX, USA) using multiplex cytokine reagents supplied by Biosource International, Camarillo, CA, USA, as previously described [39, 40]. Briefly, a sandwich immunoassay-based protein array system (Biosource), which contains dyed microspheres conjugated with a monoclonal antibody specific for a target protein was used in this assay. Serum samples were thawed and run in duplicate. Antibody-coupled beads were incubated with the plasma sample (antigen) after which they were incubated with biotinylated detection antibody before finally being incubated with streptavidin–phycoerythrin. A broad sensitivity range of standards (Biosource), ranging between 1.95 and 32 000 pg/ml were used to help enable the quantitation of a dynamic wide range of cytokine concentrations and provide the greatest sensitivity. These captured bead complexes were then read by the Bio-Plex array reader (Bio-Rad Laboratories, Hercules, CA, USA), which uses Luminex fluorescent-bead-based technology (Luminex) with a flow-based dual laser detector with real-time digital signal processing to facilitate the analysis of up to 100 different families of colour-coded polystyrene beads and allow multiple measurements of the sample ensuing in the effective quantification of cytokines.
Validation of the multiplex assays was performed using single protein ELISAs (Biosource). Values obtained from multiplex assay analytes were highly correlative [(Spearman’s rank correlation coefficient, 0.97 (0.03)], when compared with individual ELISAs for particular cytokines. Although it has been demonstrated that the myocytic cellular and molecular cytokine expression levels of inflammatory myopathy patients are much higher than in healthy individuals [8, 10, 11], our understanding of the role of these cytokines is largely limited to analyses of individual cytokines. It therefore has made it imperative for us to study the intricacy of the dynamic cytokine network and its dependency upon the complex interplay of multiple signalling molecules or pathways. We therefore compared the serum levels of 24 cytokines/chemokines in a multiplex platform between myositis patients and unaffected control individuals and between various subsets of patients with IIMs. The cytokines assayed included modulators of several key aspects of disease pathology including regulation of inflammation, cellular and humoral immunity, leucocyte trafficking, cell growth and angiogenesis. To facilitate functional interpretation of results, cytokines were sorted into four functional groups in the graphical representations of these analyses.
ELISA for sBAFF and sAPRIL
Serum samples were thawed and immediately analysed by a commercial human sBAFF ELISA kit (Quantikine Human BAFF/BlyS/TNFSF13B Immunoassay; R&D Systems, Minneapolis, MN, USA) and a commercial human sAPRIL ELISA kit (Bender MedSystems GmbH, Vienna, Austria) according to the manufacturers’ instructions. Results are presented in picograms/millilitre for sBAFF and nanograms/millilitre for sAPRIL.
Statistical analysis
Cytokine concentrations were obtained through a five parameter logistic regression of a standard curve [41]. Cytokines in this assay are distributed log normally; therefore, all concentrations were transformed by Log2(X + 1) before further analysis. Statistical differences in measured values were assessed by a Mann–Whitney U-test. P < 0.05 was considered statistically significant. To evaluate how well an arbitrary monotonic function could describe the relationship between two variables, a non-parametric measure of correlation between variables defined by Spearman’s correlational coefficient (r) was assessed (ranging from negative correlation of −1.00 to a positive correlation of +1.00), and a t-test was used to establish whether the correlation coefficient is significant. We also used hierarchical clustering analysis to cluster the correlational profiles into meaningful structures, as per Eisen et al. [42]. The analysis clusters the variables (biomarkers) according to the similarity or dissimilarity of their profiles, placing the variables with similar relationship together as neighbouring rows, which was then depicted graphically in a dendrogram, in which the correlation determined the branch length of the dendogram.
Principal component analysis
Principal component analysis (PCA) is a common dimension reduction technique that creates linear combinations of variables that are uncorrelated. These uncorrelated ‘principal components’ (PCs) can be used in multivariate analysis [43]. PCA was performed as a way of identifying patterns within the variables, and expressing them in such a way as to highlight their similarities and differences. A PCA with Varimax rotation was used to uncorrelate the cytokines. It is important to note that some cytokine values in the resulting data set were below the limit of detection. In this case, a cold-deck imputation of the lowest quantifiable standard was used [44]. This estimate uses our knowledge that the cytokine values are at most the values that were imputed. If any cytokine required >20% imputation the cytokine was dropped from further analysis. The dataset was then randomly split into two datasets: a test and a training dataset. One hundred individuals, 50 myositis and 50 controls, comprised the training set, while 49 subjects, 29 myositis and 20 controls, comprised the test set. The training dataset will be used to construct our predictive model, whereas the test dataset provides independent validation of our model. An eigenvalue >1 was used to retain PCs. Once new variables had been created the resulting components were placed into a logistic regression to create a predictive model of myositis. An α < 0.05 was considered statistically significant. The SAS system v 9.1.3 (Statistical Analysis System, Cary, NC, USA) was used for statistical analysis.
Discriminant function analysis
Discriminant function analysis (DFA) is a multivariate class distinction algorithm that allows one to construct a mathematical model of discrimination built in a stepwise manner. This analysis was used here to identify the cytokines that best discriminated between patients with IIMs and controls, and was modelled as previously described [39, 45]. Specifically, at each step, all variables are reviewed to determine which will maximally discriminate between groups. These variables are then included in a discriminative function, denoted a root, which is an equation consisting of a linear combination of cytokine changes used for the prediction of group membership. Variables will continue to be included in the model as long as the respective F-values for those variables are larger than the standard threshold (established by the analytical package Statistica; StatSoft, Tulsa, OK, USA). The discriminant potential of the final equation from the forward stepwise DFA can then be observed in a simple multidimensional plot of the values of the roots obtained for each group. This multivariate approach identifies groups of analytes, the changes of which in levels can delineate profiles and create diagnostic patterns.
Results
Unique systemic immune profiles identified in IIMs
Measured biomarkers were catalogued in four functional subsets. This included a group denoted cellular cytokines that drive, albeit not exclusively, cytotoxic and anti-viral responses (e.g. IL-1β, IL-1Rα, IL-2, IL-7, IL-12, IL-15, IL-17, TNF-α, IFN-α, IFN-γ; Fig. 1A), ‘humoral cytokines’ (e.g. IL-4, IL-5, IL-6, IL-10, IL-13; Fig. 1B), ‘growth factors’ (e.g. GM-CSF) and ‘chemokines’ [e.g. CCL2 (MCP-1), CCL3 (MIP-1α), CCL4 (MIP-1β), CCL11 (eotaxin)], CXCL8 (IL-8) and CXCL10 (IFN-γ-inducible protein of 10 kDa; IP-10; CXCL10; Fig. 1C). DM patients demonstrated a unique profile with significant (P < 0.05) elevated levels of cellular, cytotoxic cytokines (IL-1β, IL-7, IL-12, IL-17, IFN-α), humoral (IL-6 and IL-10) and a profound chemotactic profile [CCL2 (MCP-1), CCL3 (MIP-1α), CCL4 (MIP-1β), CCL11 (Eotaxin)], CXCL8 (IL-8) and CXCL10 (IP-10; Fig. 1). PM patients demonstrated a less predominant immune profile (when compared with DM) with a bias towards cellular cytokines and chemokines with significant (P < 0.05) elevations of IL-17, GM-CSF, IFN-α, IL-1Rα, IL-7, CCL11, CCL3 and CCL4 (Fig. 1). When compared with DM and PM, patients with JDM demonstrated a Th1-predominant profile with significant (P < 0.05) elevations of IL-1β, IL-12, GM-CSF, IFN-α and IL-1Rα, and a chemotactic profile (CCL11, CCL3, CCL4 and CXCL10) (Fig. 1). It is important to note that Th17 mediators were not elevated in JDM, and that IL-15 was significantly decreased in JDM when compared with controls and other conditions. In CAM, both Th1 and Th17 were involved along with chemokines, but rather with a unique profile with significant (P < 0.05) elevations of IL-1β, IL-17, GM-CSF, IFN-α, IL-1Rα, CCL11, CCL3, CCL4 and CXCL10 (Fig. 1). Also of importance is that IL-10 was the only humoral cytokine that was significantly (P < 0.05) elevated in PM, JDM and CAM (Fig. 1B). As shown in Fig. 1, patients with overlap diseases had a mixed-diverse cytokine profile with significant elevation (P < 0.05) of Th1, Th2 and chemokines (IL-1β, IL-12, GM-CSF, IL-1Rα, IL-7, IL-6, IL-10, IL-13, CCL3, CCL4 and CXCL10). While these patterns represent the first ever, unique immunomodulatory multiplex profiles identified in IIMs, the complex dynamic nature of the immune profiles in IIMs warrants the necessity to perform multivariate analysis to identify discriminatory patterns in IIMs.
Fig. 1.

Distinct cellular cytotoxic, humoral and chemotactic patterns identified in IIMs. Levels of 24 serum biomarkers were measured simultaneously using a biometric multiplex assay from serum of subsets of patients with IIMs, and unaffected control individuals. (A) Cellular cytotoxic patterns identified elevations of IL-1β, IL-7, IL-12, IL-17, IFN-α in DM, IL-17, GM-CSF, IFN-α, IL-1Rα, IL-7 in PM, IL-1β, IL-12, GM-CSF, IFN-α and IL-1Rα in JDM, and IL-1β, IL-17, GM-CSF, IFN-α, IL-1Rα in CAM. (B) Humoral patterns identified elevations of IL-6 and IL-10 in DM, and IL-10 in PM, JDM and CAM. (C) Chemotactic patterns identified elevations of CCL2, CCL3, CCL4, CCL11, CXCL8 and CXCL10 in DM, CCL11, CCL3 and CCL4 in PM, CCL11, CCL3, CCL4 and CXCL10 in JDM, and CCL11, CCL3, CCL4 and CXCL10 in CAM. Patients with overlap diseases had a mixed-diverse cytokine profile with significant elevations of IL-1β, IL-12, GM-CSF, IL-1Rα, IL-7, IL-6, IL-10, IL-13, CCL3, CCL4 and CXCL10. Cytokines significantly elevated in groups relative to controls are denoted with an asterisk (*P < 0.05 and **P < 0.001).
Correlational and cluster analysis identifies cytokine profiles that closely associate with BAFF and APRIL
Given the potential role of BAFF/APRIL as immunomodulators in the pathogenesis of autoimmune diseases, we compared and correlated the systemic levels of BAFF/APRIL with that of systemic cytokines and chemokines in IIM. Correlation was assessed by Spearman’s correlation analysis, which allows for effective evaluation of the relationship between two variables (BAFF/APRIL and respective cytokines/chemokines). As depicted in Fig. 2A, in IIM, BAFF was highly correlated with IL-12 (r = 0.457, P < 0.0001), and moderately correlated with ESR (r = 0.307, P = 0.009), IL-1Rα (r = 0.294, P = 0.012), CXCL10 (r = 0.279, P = 0.017), IL-7 (r = 0.269, P = 0.022). On the other hand, in IIM, APRIL was correlated with IL-6 (r = 0.263, P = 0.026), CXCL10 (r = 0.243, P = 0.039) and RF (r = 0.237, P = 0.045; Fig. 2B). To assess the similarities or differences of cytokine changes among the groups studied, hierarchical clustering analysis was also applied to the dataset of IIM. This helped construct a series of nested clusters of data based on the proximity information and interplay between variables (including BAFF, APRIL and cytokines) associated with an observation. Clear separation of variables was apparent, in which BAFF, APRIL, CXCL10, CCL2, CCL3, CCL4 and IL-1Rα depicted a tight cluster, when compared with other variables (Fig. 2C).
Fig. 2.

Systemic cytokine profiles correlate with BAFF and APRIL in IIMs. To evaluate the linear relationship between BAFF, APRIL and cytokines, correlation of BAFF and APRIL with systemic cytokine profiles was assessed by correlation analysis. (A) Serum BAFF was highly correlated with IL-12, and moderately correlated with ESR, IL-1Rα, CXCL10 and IL-7. (B) Serum APRIL was highly correlated with IL-6, CXCL10 and RF. (C) To cluster the correlational profiles into meaningful structures, a hierarchical clustering was performed to obtain clear separation of variables, in which BAFF, APRIL, CXCL10, CCL2, CCL3, CCL4 and IL-1Rα depicted a tight cluster, when compared with other variables.
PCAs enable effective evaluation of immune profiles in patients with IIM and identify components of cytokine profiles as prognostic tools in a case of active JDM
Most multivariate methods of data analysis require that variables be independent or at least uncorrelated. Since cytokines function in an intricate network, they are highly dependent upon one another and do not meet this requirement. PCA reduces dimensionality by rejecting low variance, and is therefore helpful to measure separation between the samples in the estimated feature space. PCA effectively enables the identification of more informative uncorrelated novel features, increasing the ability to interpret and analyse the profiles. After imputation, 16 of 22 cytokines were eligible for further analysis. These include: IL-1β, IL-2, IL-6, IL-7, IL-8, IL-10, IL-12, IL-15, TNF-α, GM-CSF, CCL2, CCL3, CCL4, CXCL10 and IL-1Rα. These data were split into test and training datasets. PCA was performed on the training set and resulted in three PCs being retained that explained 89% of the variability in the dataset (Table 1). All three PCs were modelled in a logistic regression. Only PCs 2 and 3 were statistically significant (data not shown).
Table 1.
Eigenvalues from PCA
| Principal component | Eigenvalue | Proportion variance explained | Cumulative variance explained |
|---|---|---|---|
| 1 | 6.080 | 0.5867 | 0.5867 |
| 2 | 1.834 | 0.177 | 0.7637 |
| 3 | 1.286 | 0.1241 | 0.8878 |
| 4 | 0.726 | 0.07 | 0.9578 |
| 5 | 0.436 | 0.0421 | 0.9999 |
| 6 | 0.356 | 0.0344 | 1.0343 |
| 7 | 0.271 | 0.0261 | 1.0604 |
| 8 | 0.098 | 0.0095 | 1.0699 |
| 9 | 0.030 | 0.0029 | 1.0728 |
| 10 | 0.002 | 0.0002 | 1.0729 |
| 11 | −0.028 | −0.0027 | 1.0702 |
| 12 | −0.077 | −0.0075 | 1.0628 |
| 13 | −0.086 | −0.0083 | 1.0545 |
| 14 | −0.152 | −0.0147 | 1.0398 |
| 15 | −0.177 | −0.0171 | 1.0227 |
| 16 | −0.236 | 1 |
The PC factors with eigenvalues that can be retained based on the Kaiser criterion are shown in bold.
The cytokines causing the most variability were IL-10 and GM-CSF in PC2 and CXCL10 and CCL2 in PC3 (Table 2). A key advantage of the PCA analysis was that PCA reduces data complexity in a rational way without any prior knowledge of categories so as to determine whether any intrinsic clustering or outliers existed within the data set. The test data applied to this model had an area under the curve of 0.75, indicating the remarkable discriminatory power of the model (Fig. 3A).
Table 2.
Rotated PC pattern
| Cytokine | PC1 | PC2 | PC3 |
|---|---|---|---|
| IL-1β | 0.73 188 | 0.36 032 | 0.02 632 |
| IL-2 | 0.88 887 | 0.28 073 | 0.02 907 |
| IL-6 | 0.48 319 | 0.56 195 | 0.269 |
| IL-7 | 0.40 635 | 0.4299 | 0.02 552 |
| IL-8 | 0.1802 | 0.19 226 | 0.34 265 |
| IL-10 | 0.18 827 | 0.92 429 | −0.01 971 |
| IL-12 | 0.39 969 | 0.0187 | 0.11 124 |
| IL-15 | 0.85 637 | 0.26 156 | 0.15 085 |
| TNF-α | 0.59 444 | 0.10 031 | −0.17 035 |
| GM-CSF | 0.19 389 | 0.92 357 | −0.05 055 |
| CCL3 (MIP-1α) | 0.76 841 | 0.16 808 | 0.16 933 |
| CCL4 (MIP-1β) | 0.67 661 | 0.20 326 | 0.06 701 |
| IP-10 | −0.00 195 | −0.09 039 | 0.74 197 |
| CCL11 (eotaxin) | −0.02 096 | −0.05 098 | 0.52 972 |
| CCL2 (MCP-1) | 0.22 375 | 0.11 251 | 0.83 513 |
| IL-1Rα | 0.67 532 | 0.12 795 | 0.32536 |
The cytokines causing the most variability in PC1, PC2 and PC3 are shown in bold.
Fig. 3.

PCA identifies diagnostic and prognostic potential of the modelling cytokine profiles in idiopathic inflammatory myopathies. PCA increases the ability to identify uncorrelated features and interpret and analyse the profiles by reducing dimensionality. (A) PCA was performed on the training set and the test data applied to this model had an area under the curve of 0.75, indicating the remarkable discriminatory power of the model. (B) In order to assess the prognostic power of the model identified by the PCA, we investigated the role of PCA modulatory cytokines in the therapeutic response of a patient with active JDM. The data, which were rescaled so that the value of 0 characterizes the level of healthy controls to create a cytokine activity score, were plotted over time during treatment to assess patient response. Changes for PC3 correlated well with clinical response as early as 2 weeks of therapy, and therefore indicate the prognostic potential of the model in IIM.
In order to assess the prognostic power of the model identified by the PCA, we investigated the role of PC2 and PC3 modulatory cytokines in the therapeutic response of a patient with active JDM (based on diagnostic criteria). This patient was treated with i.v. methylprednisolone (250 mg for 3 days, 125 mg for 3 days, then tapered to 80 mg/day), ciclosporin (2 x 100 mg/day), MTX (12.5 mg/week) and i.v. immunoglobulin (1 g/kg for 3 days) and was prospectively followed from baseline through a total of six visits in 2 weeks. Multiplex serum cytokines were used to identify the potential of the predictive model identified by the PCA in a prospective manner (Fig. 3B). To obtain results that could be readily interpreted in a clinical context, a cytokine activity score (CAS) was created using data that were rescaled so that a value of 0 characterizes the value of the healthy controls. This value was plotted over time during treatment to assess patient response. In this form of a preliminary assessment, our results clearly demonstrate that changes in the CAS for PC3 correlated well with clinical response and that PC3 cytokine values obtained within as early as 2 weeks of therapy can reflect response (Fig. 3B). This pharmacoproteomic analysis utilizing a CAS provides a means of developing a clinical assay that monitors a patient’s response to therapy, and therefore indicates its potential as a vital tool in the management of IIM.
Discriminative cytokine profiles identify novel disease-specific patterns in IIMs
Complementary multivariate analytical methods provide a vivid picture of the biological significance of the immune profile network. A DFA is distinct from the above analyses in that it is a class distinction modelling method that identifies sets of variables that best discriminate predefined IIM groups. The utility of this analysis is that it identifies groups of analytes, the changes of which in levels can delineate profiles and create diagnostic patterns in IIM. Results of DFA can be visualized on a multidimensional plot, with class discrimination power represented by distance between IIMs. All disease states were readily distinguished from controls (Fig. 4). Interestingly, subsets of IIM clustered into significantly independent positions on a 3-dimensional (3D) plot, distinctly further away from controls. Moreover, representative of their relative disease activity, patients with JDM mapped closer to patients with DM, suggesting that this is directly proportional to intergroup cytokine variation and intragroup heterogeneity in cytokine profiles and disease pathology (Fig. 4). Additionally, OM was distributed all over without any specific distinctive location, indicative of the nature of the pathogenesis of its disease (data not shown). Of the variables analysed, IL-1β, IL-10, IL-12, GM-CSF, CCL4 and CXCL10 were identified by DFA as having the highest power for class discrimination between the groups. When compared with Fig. 1, which demonstrates the levels of each of these cytokines, it can be noted that these cytokines distinctly vary among the different disease subgroups, and as such indicates its discriminatory potential. This suggests that these biomarkers play a significant role in pathology within this cohort.
Fig. 4.
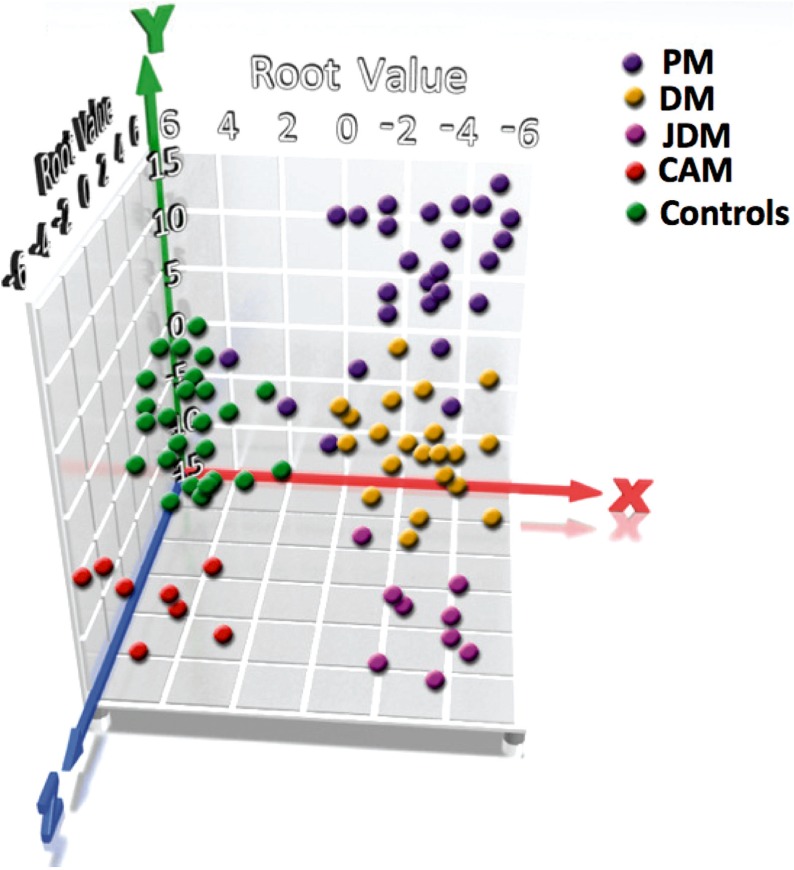
Novel disease-specific patterns in IIMs. DFA was used to identify subset of cytokines whose expression values can be linearly combined in an equation, denoted a root, whose overall value is distinct for a given characterized group. Results of DFA are visualized here on a multidimensional plot, with class discrimination power represented by distance among groups. The variables identified by the DFA will continue to be included in the model, as long as the respective F-values for those variables are larger than the standard threshold and is then plotted in three dimensions to visually represent the relative differences in cytokines among the distinct populations. Using this form of multivariate analysis, subsets of IIM clustered into unique positions on a 3D plot, distinctly further away from controls, suggesting the diagnostic potential of DFA in IIM.
Discussion
Specific targeted therapies involving modification of cytokines could improve the health of patients, while increasing our knowledge of the involvement of particular cytokines in myositis. Although few such targeted therapies have been put into practice treating myositis to date, the future of this type of therapy seems very promising. This study demonstrates the significant diagnostic potential for the classification of IIMs vs healthy controls using multivariate analysis of 24 serum biomarkers.
The poorly demonstrated relationship between infiltrating cells, clinical observations and target tissue cytokine expression implies that all IIM varieties may share a similar pathogenic pathway. Unfortunately, the effects of most cytokines on myositis require further study. However, it is known that the myocytic cellular and molecular cytokines of inflammatory myopathy patients are expressed at considerably higher levels than in healthy individuals.
When the novel TNF-superfamily members BAFF and APRIL were evaluated, we found that both ligands were significantly increased in patients with IIMs, yet in subgroup analysis we did not see differences in BAFF levels, only between APRIL in healthy individuals, vs DM and CAM. Interestingly, positive correlation was found between BAFF and IL-1Rα, IL-7, IL-12, CXCL10, as well as ESR values, also between APRIL and IL-6, CXCL10, as well as RF values. Moreover, a clear separation of variables was apparent, in which BAFF, APRIL, CCL2, CCL3, CCL4, IL-1Rα, IL-12, CXCL8 and CXCL10 depicted a tight cluster, when compared with other variables. These findings suggest that both BAFF and APRIL have a role in the perpetuation of the immune responses in IIMs; presumably, besides the previously well-known cellular and humoral immune regulatory functions, they participate in the orchestration of chemokine secretion and cell-trafficking as well. Based on our results we suggest that targeting these molecules could be a beneficial approach in the future therapeutic management of the disease.
We have identified that for all IIMs, IL-1Rα, IFN-α, GM-CSF, IL-10 and from the chemokines, CCL3 and CCL4, were the key biomarkers distinguishing them from healthy individuals. Specific dendritic cell (DC) subsets, plasmacytoid DCs, considered the main source of IFN-α, have been described previously in IIMs [46]. This set of IIM-specific markers indicates that the intricate interplay of a broad spectrum of cellular and humoral cytokines, as well as specific chemokines drive the autoimmune machinery in these patients.
In further sub-categorization, these biomarkers appeared relevant as well. Moreover, when subsequently classified various IIMs based on their peripheral biomarker set-up we characterized and differentiated DM by the aforementioned, as well as IL-1β, IL-6, IL-7, IL-12, IL-17; PM by IL-7 and IL-17; JDM by IL-12 and IL-15; CAM by IL-1β and IL-17; OM by IL-6 and IL-13. DFA-specific variables to discriminate groups were IL-1β, IL-10, IL-17, GM-CSF, CCL3 and CCL4.
The shared clinical and molecular characteristics of IIMs, which include increased cytokine/chemokine expression—which is correlated with increased muscle fatigue and degeneration—imply that there is a similar pathophysiological inflammatory mechanism shared by this related but varied group of conditions. Many of these pro-inflammatory cytokines induce metabolic affects on myocytes, which are likely to play a role in the characteristic muscle degeneration observed in these patients. Moreover, these results clearly indicate that specific chemokines are highly involved in the pathogenesis of IIMs. The up-regulation of these β chemokines may contribute to the initiation and perpetuation of chronic inflammation and to the focal inflammatory exudates in the disease [47].
Of the investigated cytokines, IL-17 seemed to be a solid biomarker, characteristic of almost all IIM subsets. IL-17 has long been implicated in several autoimmune diseases, has the ability to induce nuclear factor-κB (NF-κB) and is a potent inducer of other inflammatory mediators [48]. Microarray studies on IL-17-induced genes revealed that several chemokines such as CXCL1, CXCL10, CCL2, CCL7, CCL20, as well as MMP3 and MMP13, were up-regulated upon IL-17 treatment [49]. These findings further reinforce the pivotal role of IL-17 in the maintenance of tissue inflammation in IIMs.
In patients with IIMs, one of the novel TNF-family members, BAFF, was highly correlated with IL-12 IL-1Rα, CXCL10 and IL-7, while APRIL was correlated with IL-6 and CXCL10 as well as the general marker of humoral autoimmune processes, RF. These findings raise the possibility that both BAFF and APRIL work in a synergistic manner with various pro-inflammatory cytokines and chemokines, among which IFN-related biomarkers are of key importance. Recently BAFF has been described to be elevated in subsets of patients with myositis and appeared to show positive correlation with CK levels [50].
Broad-based proteomic screening methods are beginning to reveal the rich repertoire of cytokines at play in a given form of autoimmune disease. Moreover, our group has developed increasingly sophisticated multi-variant analysis methods to aid in our understanding of the complex regulatory networks of these disease mediators [39, 40, 45, 51].
The limitation of this study was that the roles of different doses of corticosteroids and other immunosuppressive agents, disease duration and disease activity were not addressed when multivariate analyses were performed, which could be important confounders in the analysis.
In conclusion, by using these analyses, we have identified key cytokines, chemokines and growth factors that seem to perpetuate autoimmune processes in patients with IIMs, also, can distinguish between various IIM subsets, furthermore enable us to use them as biomarkers, as well as potential novel therapeutical targets in the future management of IIMs.
Acknowledgements
Funding: This work was supported by: NIH Ruth L. Kirschstein National Research Service Award, National Institutes of Health (NIH) grants 5U19AI062629, P20RR15577 and from Hungary the National Scientific Research Fund: TO46931 and Medical Research Council: 1F1KC00004/320.
Disclosure statement: M.C. is a consultant for Crescendo Bioscience Inc. All other authors have declared no conflicts of interest.
References
- 1.Wortmann RL. Inflammatory diseases of mucle and other myopathies. In: Harris ED, Budd RC, Firestein GS, et al., editors. Kelley's textbook of rheumatology. 7th edition. Philadelphia: Elsevier Saunders; 2005. pp. 1309–35. [Google Scholar]
- 2.Danko K, Ponyi A, Constantin T, Borgulya G, Szegedi G. Long-term survival of patients with idiopathic inflammatory myopathies according to clinical features: a longitudinal study of 162 cases. Medicine. 2004;83:35–42. doi: 10.1097/01.md.0000109755.65914.5e. [DOI] [PubMed] [Google Scholar]
- 3.Cronin ME, Plotz PH. Idiopathic inflammatory myopathies. Rheum Dis Clin North Am. 1990;16:655–65. [PubMed] [Google Scholar]
- 4.Dalakas MC. Muscle biopsy findings in inflammatory myopathies. Rheum Dis Clin North Am. 2002;28:779–98. doi: 10.1016/s0889-857x(02)00030-3. [DOI] [PubMed] [Google Scholar]
- 5.Grundtman C, Lundberg IE. Pathogenesis of idiopathic inflammatory myopathies. Curr Rheumatol Rep. 2006;8:188–95. doi: 10.1007/s11926-996-0024-4. [DOI] [PubMed] [Google Scholar]
- 6.Rider LG, Miller FW. Idiopathic inflammatory myopathies: pathology and pathogenesis. In: Klippel JH, Stone JH, Crofford LJ, White PH, editors. Primer on the rheumatic diseases. New York: Springer; 2008. pp. 368–74. [Google Scholar]
- 7.Aleksza M, Szegedi A, Antal-Szalmás P, et al. Altered cytokine expression of peripheral blood lymphocytes in polymyositis and dermatomyositis. Ann Rheum Dis. 2005;64:1485–9. doi: 10.1136/ard.2003.017715. [DOI] [PMC free article] [PubMed] [Google Scholar]
- 8.Lindberg C, Oldfors A, Tarkowski A. Local T-cell proliferation and differentiation in inflammatory myopathies. Scand J Immunol. 1995;41:421–6. doi: 10.1111/j.1365-3083.1995.tb03587.x. [DOI] [PubMed] [Google Scholar]
- 9.Lundberg I, Brengman JM, Engel AG. Analysis of cytokine expression in muscle in inflammatory myopathies, Duchenne dystrophy, and non-weak controls. J Neuroimmunol. 1995;63:9–16. doi: 10.1016/0165-5728(95)00122-0. [DOI] [PubMed] [Google Scholar]
- 10.Nyberg P, Wikman AL, Nennesmo I, Lundberg I. Increased expression of interleukin 1alpha and MHC class I in muscle tissue of patients with chronic, inactive polymyositis and dermatomyositis. J Rheumatol. 2000;27:940–8. [PubMed] [Google Scholar]
- 11.Wolf RE, Baethge BA. Interleukin-1 alpha, interleukin-2, and soluble interleukin-2 receptors in polymyositis. Arthritis Rheum. 1990;33:1007–14. doi: 10.1002/art.1780330713. [DOI] [PubMed] [Google Scholar]
- 12.Fang CH, Li BG, James JH, Fischer JE, Hasselgren PO. Cytokines block the effects of insulin-like growth factor-I (IGF-I) on glucose uptake and lactate production in skeletal muscle but do not influence IGF-I-induced changes in protein turnover. Shock. 1997;8:362–7. doi: 10.1097/00024382-199711000-00008. [DOI] [PubMed] [Google Scholar]
- 13.Lecker SH, Solomon V, Mitch WE, Goldberg AL. Muscle protein breakdown and the critical role of the ubiquitin-proteasome pathway in normal and disease states. J Nutr. 1999;129:227S–37S. doi: 10.1093/jn/129.1.227S. [DOI] [PubMed] [Google Scholar]
- 14.Quinn LS, Haugk KL, Grabstein KH. Interleukin-15: a novel anabolic cytokine for skeletal muscle. Endocrinology. 1995;136:3669–72. doi: 10.1210/endo.136.8.7628408. [DOI] [PubMed] [Google Scholar]
- 15.Nagaraju K, Raben N, Merritt G, Loeffler L, Kirk K, Plotz P. A variety of cytokines and immunologically relevant surface molecules are expressed by normal human skeletal muscle cells under proinflammatory stimuli. Clin Exp Immunol. 1998;113:407–14. doi: 10.1046/j.1365-2249.1998.00664.x. [DOI] [PMC free article] [PubMed] [Google Scholar]
- 16.Arahata K, Engel AG. Monoclonal antibody analysis of mononuclear cells in myopathies. I: quantitation of subsets according to diagnosis and sites of accumulation and demonstration and counts of muscle fibers invaded by T cells. Ann Neurol. 1984;16:193–208. doi: 10.1002/ana.410160206. [DOI] [PubMed] [Google Scholar]
- 17.Engel AG, Arahata K. Monoclonal antibody analysis of mononuclear cells in myopathies. II: Phenotypes of autoinvasive cells in polymyositis and inclusion body myositis. Ann Neurol. 1984;16:209–15. doi: 10.1002/ana.410160207. [DOI] [PubMed] [Google Scholar]
- 18.Hahne M, Kataoka T, Schröter M, et al. APRIL, a new ligand of the tumor necrosis factor family, stimulates tumor cell growth. J Exp Med. 1998;188:1185–90. doi: 10.1084/jem.188.6.1185. [DOI] [PMC free article] [PubMed] [Google Scholar]
- 19.Moore PA, Belvedere O, Orr A, et al. BLyS: member of the tumor necrosis factor family and B lymphocyte stimulator. Science. 1999;285:260–3. doi: 10.1126/science.285.5425.260. [DOI] [PubMed] [Google Scholar]
- 20.Mukhopadhyay A, Ni J, Zhai Y, Yu GL, Aggarwal BB. Identification and characterization of a novel cytokine, THANK, a TNF homologue that activates apoptosis, nuclear factor-kappaB, and c-Jun NH2-terminal kinase. J Biol Chem. 1999;274:15978–81. doi: 10.1074/jbc.274.23.15978. [DOI] [PubMed] [Google Scholar]
- 21.Schneider P, MacKay F, Steiner V, et al. BAFF, a novel ligand of the tumor necrosis factor family, stimulates B cell growth. J Exp Med. 1999;189:1747–56. doi: 10.1084/jem.189.11.1747. [DOI] [PMC free article] [PubMed] [Google Scholar]
- 22.Shu HB, Hu WH, Johnson H. TALL-1 is a novel member of the TNF family that is down-regulated by mitogens. J Leukoc Biol. 1999;65:680–3. [PubMed] [Google Scholar]
- 23.Mackay F, Ambrose C. The TNF family members BAFF and APRIL: the growing complexity. Cytokine Growth Factor Rev. 2003;14:311–24. doi: 10.1016/s1359-6101(03)00023-6. [DOI] [PubMed] [Google Scholar]
- 24.Zhang M, Ko KH, Lam QL, et al. Novel function of TNF cytokines in regulating bone marrow B cell survival. Cell Mol Immunol. 2004;1:447–53. [PubMed] [Google Scholar]
- 25.Huard B, Arlettaz L, Ambrose C, et al. BAFF production by antigen-presenting cells provides T cell co-stimulation. Int Immunol. 2004;16:467–75. doi: 10.1093/intimm/dxh043. [DOI] [PubMed] [Google Scholar]
- 26.Huard B, Schneider P, Mauri D, Tschopp J, French LE. T cell costimulation by the TNF ligand BAFF. J Immunol. 2001;167:6225–31. doi: 10.4049/jimmunol.167.11.6225. [DOI] [PubMed] [Google Scholar]
- 27.Jonsson MV, Szodoray P, Jellestad S, Jonsson R, Skarstein K. Association between circulating levels of the novel TNF family members APRIL and BAFF and lymphoid organization in primary Sjogren’s syndrome. J Clin Immunol. 2005;25:189–201. doi: 10.1007/s10875-005-4091-5. [DOI] [PubMed] [Google Scholar]
- 28.Seyler TM, Park YW, Takemura S, et al. BLyS and APRIL in rheumatoid arthritis. J Clin Invest. 2005;115:3083–92. doi: 10.1172/JCI25265. [DOI] [PMC free article] [PubMed] [Google Scholar]
- 29.Stohl W, Metyas S, Tan SM, et al. B lymphocyte stimulator overexpression in patients with systemic lupus erythematosus: longitudinal observations. Arthritis Rheum. 2003;48:3475–86. doi: 10.1002/art.11354. [DOI] [PubMed] [Google Scholar]
- 30.Toubi E, Shoenfeld Y. BLyS/BAFF: a potential target in the treatment of active systemic lupus erythematosus. Isr Med Assoc J. 2004;6:99–102. [PubMed] [Google Scholar]
- 31.Bohan A, Peter JB. Polymyositis and dermatomyositis (first of two parts) N Engl J Med. 1975;292:344–7. doi: 10.1056/NEJM197502132920706. [DOI] [PubMed] [Google Scholar]
- 32.Preliminary criteria for the classification of systemic sclerosis (scleroderma) Subcommittee for scleroderma criteria of the American Rheumatism Association Diagnostic and Therapeutic Criteria Committee. Arthritis Rheum. 1980;23:581–90. doi: 10.1002/art.1780230510. [DOI] [PubMed] [Google Scholar]
- 33.Arnett FC, Edworthy SM, Bloch DA, et al. The American Rheumatism Association 1987 revised criteria for the classification of rheumatoid arthritis. Arthritis Rheum. 1988;31:315–24. doi: 10.1002/art.1780310302. [DOI] [PubMed] [Google Scholar]
- 34.McAdam LP, O'Hanlan MA, Bluestone R, Pearson CM. Relapsing polychondritis: prospective study of 23 patients and a review of the literature. Medicine. 1976;55:193–215. [PubMed] [Google Scholar]
- 35.Michet CJJ, McKenna CH, Luthra HS, O'Fallon WM. Relapsing polychondritis. Survival and predictive role of early disease manifestations. Ann Intern Med. 1986;104:74–8. doi: 10.7326/0003-4819-104-1-74. [DOI] [PubMed] [Google Scholar]
- 36.Vitali C, Bombardieri S, Jonsson R, et al. European Study Group on Classification Criteria for Sjögren's Syndrome. Classification criteria for Sjogren's syndrome: a revised version of the European criteria proposed by the American-European Consensus Group. Ann Rheum Dis. 2002;61:554–8. doi: 10.1136/ard.61.6.554. [DOI] [PMC free article] [PubMed] [Google Scholar]
- 37.Ruperto N, Ravelli A, Pistorio A, et al. Paediatric Rheumatology International Trials Organisation (PRINTO); Pediatric Rheumatology Collaborative Study Group (PRCSG) The provisional Paediatric Rheumatology International Trials Organisation/American College of Rheumatology/European League Against Rheumatism Disease activity core set for the evaluation of response to therapy in juvenile dermatomyositis: a prospective validation study. Arthritis Rheum. 2008;59:4–13. doi: 10.1002/art.23248. [DOI] [PubMed] [Google Scholar]
- 38.Ponyi A, Borgulya G, Constantin T, Váncsa A, Gergely L, Dankó K. Functional outcome and quality of life in adult patients with idiopathic inflammatory myositis. Rheumatology. 2005;44:83–8. doi: 10.1093/rheumatology/keh404. [DOI] [PubMed] [Google Scholar]
- 39.Alex P, Szodoray P, Knowlton N, et al. Multiplex serum cytokine monitoring as a prognostic tool in rheumatoid arthritis. Clin Exp Rheumatol. 2007;25:584–92. [PubMed] [Google Scholar]
- 40.Szodoray P, Alex P, Chappell-Woodward CM, et al. Circulating cytokines in Norwegian patients with psoriatic arthritis determined by a multiplex cytokine array system. Rheumatology. 2007;46:417–25. doi: 10.1093/rheumatology/kel306. [DOI] [PubMed] [Google Scholar]
- 41.Nix B, Wild D. The immunoassay handbook. Elsevier Science; 2005. [Google Scholar]
- 42.Eisen MB, Spellman PT, Brown PO, Botstein D. Cluster analysis and display of genome-wide expression patterns. Proc Natl Acad Sci USA. 1998;95:14863–8. doi: 10.1073/pnas.95.25.14863. [DOI] [PMC free article] [PubMed] [Google Scholar]
- 43.Jackson JE. A user’s guide to principal components (Wiley Series in Probability and Statistics) Wiley-Interscience; 2003. [Google Scholar]
- 44.Little RJA, Rubin DB. Statistical analysis with missing data. 2nd edition. Wiley-Interscience; 2002. [Google Scholar]
- 45.Jarvis JN, Dozmorov I, Jiang K, et al. Novel approaches to gene expression analysis of active polyarticular juvenile rheumatoid arthritis. Arthritis Res Ther. 2004;6:R15–32. doi: 10.1186/ar1018. [DOI] [PMC free article] [PubMed] [Google Scholar]
- 46.de Padilla CM, Reed AM. Dendritic cells and the immunopathogenesis of idiopathic inflammatory myopathies. Curr Opin Rheumatol. 2008;20:669–74. doi: 10.1097/BOR.0b013e3283157538. [DOI] [PubMed] [Google Scholar]
- 47.Civatte M, Bartoli C, Schleinitz N, Chetaille B, Pellissier JF, Figarella-Branger D. Expression of the beta chemokines CCL3, CCL4, CCL5 and their receptors in idiopathic inflammatory myopathies. Neuropathol Appl Neurobiol. 2005;31:70–9. doi: 10.1111/j.1365-2990.2004.00591.x. [DOI] [PubMed] [Google Scholar]
- 48.Dong C. Regulation and pro-inflammatory function of interleukin-17 family cytokines. Immunol Rev. 2008;226:80–6. doi: 10.1111/j.1600-065X.2008.00709.x. [DOI] [PMC free article] [PubMed] [Google Scholar]
- 49.Park H, Li Z, Yang XO, et al. A distinct lineage of CD4 T cells regulates tissue inflammation by producing interleukin 17. Nat Immunol. 2005;6:1133–41. doi: 10.1038/ni1261. [DOI] [PMC free article] [PubMed] [Google Scholar]
- 50.Krystufková O, Vallerskog T, Helmers SB, et al. Increased serum levels of B cell activating factor (BAFF) in subsets of patients with idiopathic inflammatory myopathies. Ann Rheum Dis. 2009;68:836–43. doi: 10.1136/ard.2008.091405. [DOI] [PubMed] [Google Scholar]
- 51.Alex P, Zachos NC, Nguyen T, et al. Distinct cytokine patterns identified from multiplex profiles of murine DSS and TNBS-induced colitis. Inflamm Bowel Dis. 2009;15:341–52. doi: 10.1002/ibd.20753. [DOI] [PMC free article] [PubMed] [Google Scholar]