

Abstract
The aim of the present study was to retrospectively estimate the absorbed dose to kidneys in 17 patients treated in clinical practice with 90Y-ibritumomab tiuxetan for non-Hodgkin's lymphoma, using appropriate dosimetric approaches available. Methods: The single-view effective point source method, including background subtraction, is used for planar quantification of renal activity. Since the high uptake in the liver affects the activity estimate in the right kidney, the dose to the left kidney serves as a surrogate for the dose to both kidneys. Calculation of absorbed dose is based on the Medical Internal Radiation Dose methodology with adjustment for patient kidney mass. Results: The median dose to kidneys, based on the left kidney only, is 2.1 mGy/MBq (range, 0.92–4.4), whereas a value of 2.5 mGy/MBq (range, 1.5–4.7) is obtained, considering the activity in both kidneys. Conclusions: Irrespective of the method, doses to kidneys obtained in the present study were about 10 times higher than the median dose of 0.22 mGy/MBq (range, 0.00–0.95) were originally reported from the study leading to Food and Drug Administration approval. Our results are in good agreement with kidney-dose estimates recently reported from high-dose myeloablative therapy with 90Y-ibritumomab tiuxetan.
Key words: 90Y-ibritumomab tiuxetan, radioimmunotherapy, dosimetry, kidney
Introduction
90Y-ibritumomab tiuxetan, or Zevalin™, is an agent for the radioimmunotherapy (RIT) of relapsed or refractory non-Hodgkin's lymphoma (NHL). Radiation doses to organs from 90Y-ibritumomab tiuxetan were obtained from multicenter clinical trials that led to Food and Drug Administration (FDA) approval.1 The conjugate-view method of planar γ-camera imaging was used to calculate activity uptake in the whole body, lungs, liver, spleen, and kidneys. Correction for attenuation was based on a whole-body average-attenuation factor derived from the first 111In-ibritumomab tiuxetan planar imaging acquired before the first urination.1 van Reenen et al.2 demonstrated that this method was accurate for the quantification of activity in spleen, liver, and whole-body remainder. For an organ that is not visible on both conjugate views, Shen et al.3 showed that quantification, using a single view, is preferable. For most patients injected with 111In-ibritumomab tiuxetan, the kidneys can be visualized only on the posterior projection. Therefore, in the present study, a single-view patient-specific method was used to estimate the absorbed dose to kidneys in patients treated with 90Y-ibritumomab tiuxetan in clinical practice.
Materials and Methods
Study Design
This study was a retrospective dosimetry analysis of 17 patients treated with 90Y-ibritumomab tiuxetan in a nontrial setting at the Lausanne University Hospital (CHUV; Lausanne, Switzerland) between 2004 and 2007. Planar imaging with about 185 MBq of the surrogate complex, 111In-ibritumomab tiuxetan, was performed to confirm the expected biodistribution before administering the therapeutic dose. Serial images were available for each patient at three time points: 30 minutes after administration, on days 3 or 4, and on days 6 or 7 postinjection. Anterior and posterior images were acquired on a dual-head γ-camera (Biad; Trionix Research Laboratory, Inc., Twinsburg, OH) in a 256 × 1024 matrix, using a medium-energy collimator and 15% energy windows centered at 171 and 245 keV.
Activity Quantification
According to the single-view effective point source method described by the Medical Internal Radiation Dose (MIRD) Pamphlet No. 16,4 the activity A in the kidney may be expressed as shown in Equation 1:
 |
(1) |
where IROI is the count rate within the kidney region of interest (ROI) on the posterior view, μe is the effective linear attenuation coefficient of 111In, d is the kidney depth defined as the distance from the center of the kidney to the body surface, C is the γ-camera calibration factor, and F is the correction factor for background activity. To determine the effective linear attenuation coefficient, a kidney phantom represented by a 200-mL vial filled with 111In solution (13 MBq) was placed on Perspex® (Lucite International, Southhampton, UK) blocks (density of 1.18 g/cm3) of various thicknesses simulating patient tissue. Transmission counts for different kidney depths were measured in normal clinical conditions and then used to determine the parameter μe.5 A standard with a known amount of 111In, ranging between 1 and 3 MBq, was counted on a regular basis during the study period to determine the calibration factor. Variations between two consecutive measurements of the calibration factor ranged between −6 and +4%, except the stepwise increase of 22%, before and after γ-camera revision, and this 22% change, determined from the standard, was consistent with routine quality-assurance results when using the 57Co sheet source. For activity calculation, the calibration factor determined close to the patient examination date was used. The background correction technique proposed by Kojima et al.6 is particularly accurate for kidneys that show minimal uptake and are surrounded by high background activity.7 This method takes into account only the portion of the background equivalent to the organ volume, and the factor, F, in Equation 1 may be expressed as shown in Equation 2:
 |
(2) |
where IROI is the count rate obtained from a contour drawn over the kidney, which also includes over- and underlying activity, and IBKG is the count rate in the background region only. AROI and ABKG are the ROI areas. The theoretic narrow-beam linear-attenuation coefficient, μ0, is 0.141 cm−1 in soft tissue (density of 1.04 g/cm3) for the 171- and 245-keV γ-rays of 111In.8 The parameter, t, is the kidney effective thickness, and T is the body thickness at the kidney level. A conventional background correction would assume that the bracket of Equation 2 would be equal to unity, resulting in an oversubtraction of background activity.
ROIs for both kidneys were defined manually over the posterior projection at early time points, as shown in Figure 1. The background ROI was drawn below the kidneys, avoiding blood vessels as well as tumor masses, which may overlap soft-tissue background volumes in certain NHL patients. Clearance of 90Y in kidneys was expressed as the ratio of injected activity converted from 111In data at the different imaging time points. The residence time was determined by fitting a mono-exponential function to measured clearance data.
Figure 1.
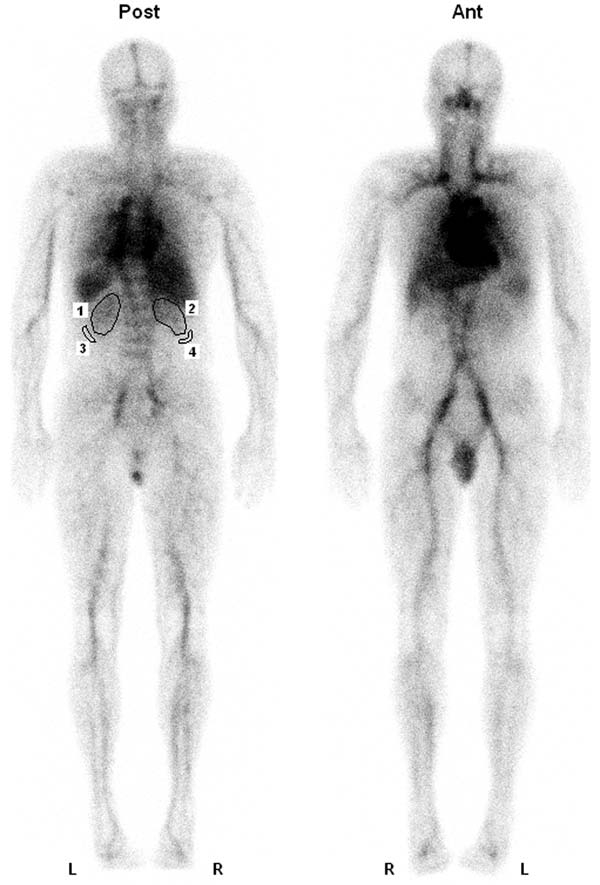
Whole-body images of patient 8 acquired 30 minutes after the injection of 111In-ibritumomab tiuxetan. Left kidney (region of interest [ROI] 1) and right kidney (ROI 2) are visualized above background on the posterior view only. The high uptake in the liver interferes with accurate activity measurement in the upper part of the right kidney. ROIs 3 and 4 show the background in the subrenal area.
Radiation Absorbed Dose Calculation
Following the MIRD schema, the mean absorbed dose to kidneys, Dkidneys, per unit administered activity, A0, is obtained, as shown in Equation 39:
 |
(3) |
where τkidneys is the sum of the residence time in the left and right kidneys, Δ90y the total mean energy emitted per disintegration of 90Y, that is, 1.50 · 10−13 (Gy · kg)/(Bq · s),10 and mkidneys is the kidney's mass. Due to the high uptake in the liver interfering with the right kidney in almost any projection of patients injected with 111In-ibritumomab tiuxetan, an accurate estimate of the residence time in the right kidney is hardly achievable. Since overlap of the left kidney by the spleen is much less pronounced, an alternative consists in using the dose to the left kidney as the surrogate for the mean dose to both kidneys. In this case, Equation 3 becomes that shown in Equation 4:
 |
(4) |
The kidney mass, m (volume), as well as the body thickness, L, and the kidney depth, d, were measured on patient-specific computed tomography (CT) data. The effective kidney thickness, t, is evaluated as the kidney volume divided by the kidney ROI area (AROI).11 CT measurements could not be obtained retrospectively for 4 patients. In these cases, a formula for kidney mass, based on the body-surface area, was applied, whereas distances were estimated from positron emission tomography or single-photon emission computed tomography data.12
Results
The effective linear attenuation coefficient obtained from an exponential regression fitting of ROI counts versus kidney depth was 0.139 cm−1 (Fig. 2). Correcting for the difference between soft-tissue (1.04 g/cm3) and Perspex (1.18 g/cm3) densities, a μe-value of 0.123 cm−1 was used for attenuation correction in Equation 1. Patient kidney masses and depths determined from CT are given in Table 1. Median values were similar for both the left and right kidneys, but substantial variation in masses were observed across patients. Absorbed doses to kidneys per unit of administered activity are reported in Table 2 along with residence times for the left and right kidneys. The median dose derived from both kidneys (i.e., 2.5 mGy/MBq) is larger by 20% than the median dose, based on the left kidney only (i.e., 2.1 mGy/MBq), suggesting that counts in the liver affect the activity estimate in the right kidney. In particular, for patient 17, the dose derived from both kidneys is twice the left kidney dose due to the atypically high liver-to-kidney uptake ratio of 13, compared to the median ratio of 6.1 for all patients.
Figure 2.

Posterior view counts versus depth of the kidney phantom simulated by a 200-mL 111In vial placed on Perspex® (Lucite International, Southhampton, UK) blocks. Depth is defined as the radius of the vial added to variable block thickness.
Table 1.
Patient Weight, Kidney Mass, and Depth Measured on Computed Tomography (CT)
| |
|
Kidney mass (g) |
Kidney depth (cm) |
||
|---|---|---|---|---|---|
| Patient no. | Weight (kg) | Left | Right | Left | Right |
| 1a | 83 | 212 | 212 | 9.0 | 10.0 |
| 2 | 83 | 103 | 304 | 8.1 | 8.2 |
| 3 | 74 | 240 | 216 | 7.8 | 7.5 |
| 4 | 82 | 308 | 217 | 6.5 | 7.4 |
| 5 | 75 | 240 | 213 | 7.1 | 7.0 |
| 6 | 61 | 160 | 149 | 6.9 | 7.3 |
| 7 | 74 | 184 | 216 | 7.9 | 7.0 |
| 8 | 80 | 275 | 265 | 7.3 | 7.7 |
| 9 | 75 | 240 | 270 | 6.6 | 6.3 |
| 10a | 58 | 171 | 171 | 7.8 | 6.9 |
| 11 | 55 | 198 | 192 | 5.5 | 5.9 |
| 12a | 63 | 187 | 187 | 6.6 | 6.4 |
| 13 | 94 | 257 | 240 | 8.5 | 8.2 |
| 14a | 76 | 202 | 202 | 6.5 | 6.5 |
| 15 | 66 | 127 | 155 | 9.9 | 10.0 |
| 16 | 86 | 235 | 88 | 6.8 | 5.6 |
| 17 | 87 | 192 | 205 | 6.3 | 6.7 |
| Median | 75 | 202 | 212 | 7.1 | 7.0 |
CT measurements were not available for those patients.
Table 2.
Administered Activity of 90Y-Iritumomab Tiuxetan, Residence Time in Kidneys and Absorbed Dose to Kidneys Per Unit Administered Activity: Comparison of Absorbed Doses Derived from Both Kidneys with Absorbed Doses Derived from the Left Kidney Only
| |
|
Residence time in kidneys (h) |
Absorbed dose to kidneys (mGy/MBq) |
||
|---|---|---|---|---|---|
| Patient no. | Administered activity of 90Y (MBq) | Left | Right | Left and right | Left only |
| 1a | 1250 | 0.83 | 1.08 | 2.4 | 2.1 |
| 2 | 1230 | 0.76 | 1.15 | 2.5 | 4.0 |
| 3 | 1100 | 1.09 | 1.61 | 3.2 | 2.4 |
| 4 | 1170 | 0.91 | 0.65 | 1.6 | 1.6 |
| 5 | 1100 | 1.03 | 1.15 | 2.6 | 2.3 |
| 6 | 950 | 0.59 | 0.79 | 2.4 | 2.0 |
| 7 | 730 | 0.68 | 0.72 | 1.9 | 2.0 |
| 8 | 890 | 1.07 | 1.16 | 2.2 | 2.1 |
| 9 | 1110 | 0.67 | 0.92 | 1.7 | 1.5 |
| 10a | 720 | 1.10 | 1.62 | 4.3 | 3.5 |
| 11 | 770 | 0.86 | 1.05 | 2.6 | 2.3 |
| 12a | 700 | 0.87 | 1.06 | 2.8 | 2.5 |
| 13 | 1080 | 2.10 | 1.74 | 4.2 | 4.4 |
| 14a | 840 | 0.80 | 1.20 | 2.7 | 2.1 |
| 15 | 910 | 0.84 | 1.63 | 4.7 | 3.6 |
| 16 | 1120 | 0.62 | 0.29 | 1.5 | 1.4 |
| 17 | 560 | 0.33 | 1.01 | 1.8 | 0.92 |
| Median | 950 | 0.84 | 1.08 | 2.5 | 2.1 |
Computed tomography measurements were not available for those patients.
Discussion
The median dose to kidneys of 2.1 mGy/MBq (range, 0.92–4.4) found in this study is about 10 times higher than the value of 0.22 mGy/MBq (range, 0.00–0.95) obtained from clinical trials, based on 172 patients.1 It is unexpected that the lowest dose of all organs reported by Wiseman et al.1 corresponds to kidneys. Indeed, the dose to kidneys can be mainly attributed to activity in the blood and urine and, therefore, should be larger than the dose to less perfused organs. Conversely, the present results are in good agreement with the median dose of 1.7 mGy/MBq (range, 0.6–3.8) reported recently by Cremonesi et al.,13 based on 22 patients enrolled in a trial with high-dose 90Y-ibritumomab tiuxetan. In a similar study of 16 patients undergoing myeloablative approach as well, Chiesa et al.11 obtained a median dose of 4.9 mGy/MBq (range, 2.8–10.5). Despite their limited number of patients, those two studies11,13 and the present work strongly suggest that the median dose to kidneys reported from the clinical trials1 may have been underestimated. The explanations of the discrepancies remain unclear. However, it is likely that those recent studies and our work used relatively accurate image-quantification methods, including background and attenuation corrections. Moreover, unlike the original study,1 the doses to the kidneys were calculated based on the individual patient kidney mass. As shown in Table 1, kidney masses vary considerably among patients, from −58% to +52% around the median value, and thus strongly affect dose estimates, according to Equations 3 and 4. Finally, in the present study, the left kidney dose is used as a surrogate for the total kidney dose, therefore avoiding challenging corrections in the right-kidney region for background and counts attributed to the overlying liver.
As long as high-dose myeloablative regimens are not considered, administered activities are unlikely to cause renal toxicity. In the present study, dose to kidneys calculated from administered activity (MBq) and left kidney dose per unit activity (mGy/MBq) ranged between 0.5 and 4.9 Gy. No renal dysfunction was observed in any of the patients. In spite of this, a reliable estimate of the absorbed dose to the kidneys could be necessary for assessing radiologic risk and for the planning of subsequent treatments involving radiation therapy (or other nephrotoxic therapies). Finally, an accurate dose estimate per unit administered activity to nontarget organs is key for myeloablative RIT approaches.13
A limitation of the present study was its retrospective nature. Renal-clearance kinetics were determined by using only three sampling points fitted to a monoexponential curve, thus making the reasonable assumption that maximum kidney uptake occurred at an early time postadministration. Since no scatter windows were set during acquisition, a measured effective linear-attenuation coefficient was used for scatter compensation. Moreover, the calibration standard was not measured at each time point to ensure the short-term stability of the γ-camera. In spite of this, this study provides acceptable dose estimates to kidneys based on validated approaches for activity quantification and dose calculation. It should be noted that the dose calculation assumes implicitly that all electrons are deposited locally within the kidneys, and that dose contributions from the liver and the spleen are negligible. However, high-energy electrons of 90Y may escape the source organs and deposit energy in adjacent organs. Further investigations may be necessary to examine dose distribution near the interfaces between kidney cortex and the liver or spleen, especially for patients treated with high-dose 90Y-ibritumomab tiuxetan. Such studies would require the use of three-dimensional imaging-based dosimetry.
Conclusions
Absorbed doses to kidneys were retrospectively estimated for 17 patients treated with 90Y-ibritumomab tiuxetan, selecting appropriate methods previously discussed in the literature. Results suggest that counts in the liver affect activity estimate in the right kidney. To circumvent the overestimation of renal activity, the left kidney dose could be used as a surrogate for the dose to both kidneys. Another common practice would be to draw an aliquot right-kidney ROI. The resulting median dose to kidneys was about 10 times higher than the median value reported from original clinical trials but was in good agreement with recently published dose values. The reason for these discrepancies is still unclear. In any case, the absorbed dose to kidneys remains far below dose levels that may cause renal toxicity, unless myeloablative regimens of 90Y-ibritumomab tiuxetan are concerned.
Acknowledgments
The authors thank Mr. Cédric Noé for technical assistance. This study was supported by the Swiss National Science Foundation (fellowship no. PBFR2-115886) and NIH/NCI grant R01 CA116477.
References
- 1.Wiseman GA. Kornmehl E. Leigh B, et al. Radiation dosimetry results and safety correlations from 90Y-ibritumomab tiuxetan radioimmunotherapy for relapsed or refractory non-Hodgkin's lymphoma: Combined data from 4 clinical trials. J Nucl Med. 2003;44:465. [PubMed] [Google Scholar]
- 2.van Reenen PC. Lotter MG. Heyns AD, et al. Quantification of the distribution of 111In-labelled platelets in organs. Eur J Nucl Med. 1982;7:80. doi: 10.1007/BF00251649. [DOI] [PubMed] [Google Scholar]
- 3.Shen S. DeNardo GL. DeNardo SJ. Quantitative bremsstrahlung imaging of yttrium-90 using a Wiener filter. Med Phys. 1994;21:1409. doi: 10.1118/1.597198. [DOI] [PubMed] [Google Scholar]
- 4.Siegel JA. Thomas SR. Stubbs JB, et al. MIRD pamphlet no. 16: Techniques for quantitative radiopharmaceutical biodistribution data acquisition and analysis for use in human radiation dose estimates. J Nucl Med. 1999;40:37S. [PubMed] [Google Scholar]
- 5.Shen S. Forero A. LoBuglio AF, et al. Patient-specific dosimetry of pretargeted radioimmunotherapy using CC49 fusion protein in patients with gastrointestinal malignancies. J Nucl Med. 2005;46:642. [PubMed] [Google Scholar]
- 6.Kojima A. Takaki Y. Matsumoto M, et al. A preliminary phantom study on a proposed model for quantification of renal planar scintigraphy. Med Phys. 1993;20:33. doi: 10.1118/1.597057. [DOI] [PubMed] [Google Scholar]
- 7.Buijs WC. Siegel JA. Boerman OC, et al. Absolute organ activity estimated by five different methods of background correction. J Nucl Med. 1998;39:2167. [PubMed] [Google Scholar]
- 8.Berger MJ. Hubbell JH, et al. XCOM: Photon Cross-Section Database (version 1.3) Gaithersburg, MD: National Institute of Standards and Technology, 2005; [Mar 5;2008 ]. [Google Scholar]
- 9.Loevinger R. Budinger TF. Watson EE. New York: The Society of Nuclear Medicine; 1991. MIRD Primer for Absorbed Dose Calculations. [Google Scholar]
- 10.Weber DA. Eckerman KF. Dillman LT, et al. MIRD: Radionuclide Data and Decay Schemes. New York: The Society of Nuclear Medicine; 1989. [Google Scholar]
- 11.Chiesa C. Botta F. Di Betta E, et al. Dosimetry in myeloablative 90Y-labeled ibritumomab tiuxetan therapy: Possibility of increasing administered activity on the base of biological effective dose evaluation. Preliminary results. Cancer Biother Radiopharm. 2007;22:113. doi: 10.1089/cbr.2007.302. [DOI] [PubMed] [Google Scholar]
- 12.Kasiske BL. Umen AJ. The influence of age, sex, race, and body habitus on kidney weight in humans. Arch Pathol Lab Med. 1986;110:55. [PubMed] [Google Scholar]
- 13.Cremonesi M. Ferrari M. Grana CM, et al. High-dose radioimmunotherapy with 90Y-ibritumomab tiuxetan: Comparative dosimetric study for tailored treatment. J Nucl Med. 2007;48:1871. doi: 10.2967/jnumed.107.044016. [DOI] [PubMed] [Google Scholar]