Abstract
A microfluidic device with planar square electrodes is developed for capturing particles from high conductivity media using negative dielectrophoresis (n-DEP). Specifically, Bacillus subtilis and Clostridium sporogenes spores, and polystyrene particles are tested in NaCl solution (0.05 and 0.225 S∕m), apple juice (0.225 S∕m), and milk (0.525 S∕m). Depending on the conductivity of the medium, the Joule heating produces electrothermal flow (ETF), which continuously circulates and transports the particles to the DEP capture sites. Combination of the ETF and n-DEP results in different particle capture efficiencies as a function of the conductivity. Utilizing 20 μm height DEP chambers, “almost complete” and rapid particle capture from lower conductivity (0.05 S∕m) medium is observed. Using DEP chambers above 150 μm in height, the onset of a global fluid motion for high conductivity media is observed. This motion enhances particle capture on the electrodes at the center of the DEP chamber. The n-DEP electrodes are designed to have well defined electric field minima, enabling sample concentration at 1000 distinct locations within the chip. The electrode design also facilitates integration of immunoassay and other surface sensors onto the particle capture sites for rapid detection of target micro-organisms in the future.
INTRODUCTION
The possibility of deliberate contamination of vulnerable foods, such as fruit juices and milk with infectious agents or their associated toxins, is an unfortunate reality.1, 2 For food defense purposes, there is a critical need to develop technologies that can rapidly and efficiently capture and concentrate biothreat agents (bacterial spores) from food matrices, thereby rendering them available for detection. Pathogen detection in foods is an extremely challenging endeavor given the vast diversity in food types, and their physical and chemical characteristics. In addition, pathogens in food samples are generally present in relatively low numbers. Therefore, sample processing methods have to be efficient in concentrating pathogens at low numbers. Often the organisms have to be physically separated from the matrix prior to detection. Some of the conventional sample concentration methods, such as centrifugation and mechanical filtration, generally require long processing time with well supervised operation, special equipments, and labor inputs. Recent development of specific, sensitive, and high throughput technologies such as biosensors, microarrays, and PCR-based tests to detect micro-organisms are indeed spectacular. However, practical relevance of these technologies for actual food safety applications without a prior sample preconcentration step is still limited. Mainly the reduced sample volumes that can be analyzed by these advanced technologies directly translate to lower detection sensitivities.3
It is desirable to develop microfluidic approaches for rapid manipulation of pathogens suspended in various liquid media.3, 4 Particle manipulation and capture can be achieved by mechanical, optical, electrokinetic, and electromagnetic means.5 Among the electrokinetic methods, dielectrophoresis (DEP) provides several advantages over the existing concentration methods, including the electric field controlled manipulation of particles, potential for automation, miniaturization and parallelization, and simple, inexpensive configuration of devices.6 DEP is the motion of polarizable particles subjected to spatially nonuniform electric fields in an ionic medium. Particles more polarizable than the media move toward high electric field regions, known as positive DEP (p-DEP). The particles less polarizable than the media are repelled toward the low electric field regions, known as negative DEP (n-DEP). Frequency-specific DEP force can be utilized in a broad range of particle manipulations by simply changing the frequency of the applied electric field.
The p-DEP attracts particles to the high electric field regions (typically electrode edges), and can trap them for as long as the electric field is applied. As a result, p-DEP has been utilized effectively for capturing particles from suspending media.7, 8 However, the p-DEP capture of biological cells and dielectric particles is generally limited to low conductivity media, whereas most food sample matrices and physiological buffers have high conductivities. In addition, stress induced on particles during p-DEP capture can result in cell damage. On the other hand, n-DEP repels particles toward electric field minima for both low and high conductivity media, and does not induce cell damage.9 However, the n-DEP electrodes should be designed with specific consideration of the particle motion. Several two-dimensional (castellated, quadrupole, and microwell electrodes10, 11, 12) and three-dimensional (insulator-based DEP, octopole, and patterned indium tin oxide7, 13, 14, 15, 16) electrode designs have been used for n-DEP capture. However, most of the two-dimensional designs either do not allow multiple capture sites (such as in the quadrupole electrode design) or have nonsymmetric configuration, which produces secondary low electric field minima (like in the case of the microwell electrodes). Meanwhile, the three-dimensional electrode designs require complicated fabrication processes that include electrode deposition at the top and bottom surfaces of channels with spatial alignment of the electrodes. One limiting factor for the development of n-DEP traps in high conductivity media is the lack of electrode designs that allow (i) simple fabrication methods, (ii) multiple capture sites with strong DEP forces, and (iii) integration of capture sites with (embedded) sensors.
Utilization of n-DEP capture in laboratory-on-a-chip applications has additional limitations due to the onset of alternating current electro-osmotic flow (ACEOF) and electrothermal flow (ETF). While the electric field induces DEP force acting on the particles, it also induces body forces on the fluid that causes ac electro-osmotic or electrothermal flow. The ACEOF is the fluid motion induced by the interaction of the nonuniform electric field with free charges in the electric double layer. The ETF is induced by the Joule heating resulting from volumetric heating of the system, when an electric field is applied across the conducting medium. The ACEOF is often negligible for high frequency electric fields, such as within the 1–100 MHz range used in the present study, as shown previously by a scaling analysis.17 Since the Joule heating is directly proportional to the conductivity and square of the applied electric field (∼σE2), the ETF becomes more significant as the conductivity of the liquid medium and∕or the applied electric field increases.18 Flow patterns induced by the ETF can interact with the n-DEP force, and dramatically influence the efficiency of microfluidic particle manipulation.
In this paper, we present a microfluidic device for capturing bacterial spores from high conductivity media. We utilized spores of B. subtilis and C. sporogenes as surrogates of the Bacillus anthracis and Clostridium botulinum biothreat agents, respectively. The objective of this manuscript is the demonstration of bacterial spore and polystyrene particle capture from high conductivity media, such as apple juice and milk. For this purpose, we utilized a planar square electrode design previously demonstrated by Park et al.19 We scaled up this design to produce 1000 separate capture sites within the chip. In addition, we presented a quantitative measurement of the particle capture by counting the captured particles in the DEP traps. This work distinguishes itself from literature by capturing two different bacterial spores from actual food matrices. An additional merit of this study is utilization of shallow fluidic chambers to investigate the relative importance of DEP and ETF in the vicinity of the electrode surfaces, and the observation of the onset of a global flow for deep chambers.
THEORETICAL MODEL
Electric field and dielectrophoresis
When particles in an ionic medium are subjected to an electric field, there is a charge difference at the particle-medium interface depending on the relative polarizabilities of the medium and the particle. This charge difference gives rise to an induced dipole across the particle. For a spherical particle, the induced dipole moment is a function of the particle volume, electric field, and relative polarizability, and it is given as20
| (1) |
where a is the particle radius, and subscripts p and m refer to the particle and the medium, respectively. is the complex permittivity written as , where ε is the relative permittivity, σ is the conductivity, ω is the frequency of the applied electric field, and . The term inside the bracket is known as the Clausius–Mossotti factor, {K}, which determines the direction of the dipole. As described by this equation, {K} is a function of the electric field frequency as well as the permittivity and the conductivity. For an isolated solid spherical particle, real part of the Clausius–Mossotti factor, Re{K}, varies between +1 and −0.5. In case of a nonuniform electric field, the electric field strength is greater on one side of the particle, and hence, there is an imbalance of forces due to the induced dipole. The net force is called as DEP force. The time average DEP force exerted on a solid spherical particle is represented as21
| (2) |
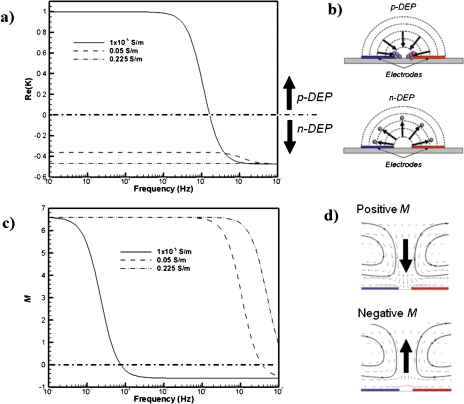
Assuming εp=2.55, σp=0.01 S∕m, and εm=78.5 for polystyrene (PS) particles, variation of Re{K} with respect to the frequency is plotted in Fig. 1a for different medium conductivities. One must note that the DEP characteristics of nonspherical particles, as well as particles with multiple layers of shells and surfaces, such as the biological cells, can be significantly more complicated.22 Depending on the sign of Re{K}, the DEP force pushes the particles either toward high or low electric field gradient zones, which are known as p-DEP and n-DEP, respectively. This is schematically depicted in Fig. 1b for two-dimensional (2D) interdigitated electrodes. For a very low conductivity media (1×10⁻⁵ S∕m), the PS particles experience p-DEP up to ∼2 MHz, where they are attracted to the high electric field regions [such as the electrode edges in Fig. 1b: top]. If the medium conductivity is higher than the particle conductivity, Re{K}<0, n-DEP is observed [i.e., particles are repelled from the electrode edges, Fig. 1b: bottom] at all frequencies. This implies that the utilization of p-DEP for manipulation of bacterial spores suspended in high conductivity media is restricted. Mostly n-DEP would be observed for bacterial spores suspended in high conductivity media, such as apple juice and milk, whose conductivities were measured as 0.225 and 0.525 S∕m (PHH-80MS, Omega), respectively.
Figure 1.
(a) Variation of the real part of the Clausius–Mossotti factor (Re{K}) as a function of the applied electric field frequency. (b) Schematic representations of positive and negative DEP particle motion under the electric field induced by 2D interdigitated electrodes. (c) Variation of electrothermal factor (M) as a function of the electric field frequency. (d) Schematic representation of ETF at two different frequencies. Data are obtained for a 1 μm solid polystyrene spherical particle immersed in an aqueous medium of variable conductivity. The properties of polystyrene particles and medium are εp=2.55, σp=0.01 S∕m, and εm=78.5.
Gravitational force can also affect the particle motion, if there is a density difference between the particle and medium Δρ=(ρp−ρm). The characteristic velocity for the gravitational motion of the particles is estimated by using a force balance between gravity and the Stokes drag for small particles as23
| (3) |
where η is the viscosity of the medium and g is the gravitational acceleration.
Joule heating and electrothermal flows
The Joule heating is the volumetric heating when an electric current passes through a conducting medium, such as an electrolyte, whose resistivity causes heat generation. For a general system, the effect of the Joule heating can be determined by investigating the conservation of energy equation, in which the electric, temperature, and velocity fields are coupled. Neglecting the convective effects, the energy equation can be reduced to the following form:23
| (4) |
Temperature gradient due to the Joule heating induces variations in the permittivity and conductivity of the fluid, which produces a body force. The time averaged electrical body force for an incompressible fluid is represented by24
| (5) |
where α=(∂ε∕∂T)∕ε and β=(∂σ∕∂T)∕σ. This equation can be written such that the frequency and conductivity dependence of the electrical body force can be lumped into the M-factor23
where
Frequency dependence of the M factor for different medium conductivities is plotted in Fig. 1c. Assuming T=300 K, α=(∂ε∕∂T)∕ε=0.0046 K−1 and β=(∂σ∕∂T)∕σ=0.02 K−1; the M factor varies between −0.7 and +6.7. The crossover frequency for the M-factor is predicted around ∼8 kHz for σ=1×10⁻⁵ S∕m. However, the crossover frequency increases with the increased medium conductivity. For example, for σ=0.05 S∕m, the crossover frequency is about 30 MHz, while no crossover frequency is observed within the presented frequency range for σ=0.225 S∕m. For positive M-factors, the induced electrothermal flow is toward the gap between the two oppositely charged electrodes [Fig. 1d: top], while the reversed flow is observed when the M factor becomes negative [Fig. 1d: bottom]. As depicted in Fig. 1d, the electrothermal flow induces a pair of counter-rotating vortices symmetric to the gap between the two oppositely charged electrodes. This typical two-dimensional electrothermal flow structure has been reported in literature on planar interdigitated electrodes.25, 26, 27 The fluid motion is governed by the Navier–Stokes equations. For a typical microfluidic system the Reynolds number is often much less than unity, and hence, resulting in the following simplified equation:20
| (6) |
METHODOLOGY
Device fabrication
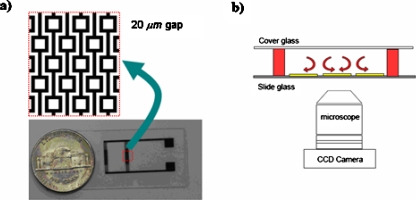
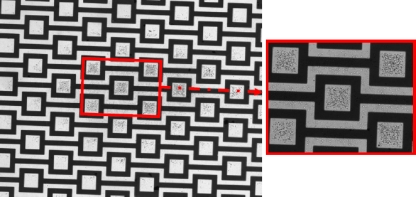
Planar square electrodes, previously developed by Park et al.,19 were used as the negative DEP traps. The electrodes consist of positive and negative electrodes with repeated patterns of square blocks, as shown in Fig. 2a. The electrode gap and electrode width are 20 μm. Each interdigitated electrode has square patterns with 60×60 μm2 inner area, which serves as the primary particle collection area. In the current design, negative DEP traps were increased to include 1000 capture sites by simply repeating the patterns. The electrode design requires simple fabrication steps, giving a competitive advantage over other existing negative DEP trap designs. The electrodes shown in Fig. 2a were microfabricated on the microscope slides using conventional photolithographic techniques.
Figure 2.
(a) Microfabricated electrodes on a glass slide. Electrode (dark) width and the gap (white) between two oppositely charged electrodes are 20 μm. Square patterns has 60×60 μm2 inner area. (b) Schematics of the microfluidic chamber (side-view). Electrodes are fabricated on a microscope slide glass. A microfluidic chamber is constructed using PDMS spacers at various heights (red) and a fluidic system is constructed by covering the enclosure via a cover glass. An inverted microscope with a CCD camera is used for observations.
The 20 μm height “microfluidic chambers” over the electrode were produced as follows: Positive photoresist (SC 1805, MicroChem) was spin-coated on the fabricated electrode surface at 3000 rpm for 30 s (0.65 μm thickness). After exposing the photoresist layer to UV light (Exoteric Inst.), the substrate was then developed in MF319 developer (Rohm and Haas Electronic Materials) for 1 min to give 5×5 mm2 photoresist layer on the observation area. After patterning the photoresist layer, the slide surface is spin-coated with polydimethyl siloxane (PDMS) (Sylgard 184, Dow Corning, 10:1 ratio) mixture at 3000 rpm for 1 min to result in 20 μm thick PDMS layer.28 The PDMS layer on top of the photoresist layer is removed by applying the lift-off process in acetone to construct the 20 μm deep microfluidic chambers.
Bacterial spore preparation
B. subtilis (ATCC 6633) spores were prepared by growing an overnight culture of the cells in Tryptic Soy Broth medium. An aliquot of the overnight culture was incubated at 37 °C for 7 days. The cells were harvested by centrifugation and resuspended in cold sterile water. Lysozyme (1 mg∕ml) was added and incubated on ice for 60 min. The suspension was sonicated three times for 2 min each time. The cells were centrifuged (8000 g) for 20 min. The supernatant was discarded and the pellet was resuspended in cold sterile water with vigorous shaking. This centrifugation and resuspension were repeated three times. The final pellet was again resuspended in cold sterile water and stored at 4 °C prior to use.
C. sporogenes (ATCC 3584) spores were prepared using an overnight culture of the organism in cooked meat medium and incubated at 37 °C anaerobically for 7 days. The cells were harvested by centrifugation (10000 g, 20 min, 4 °C). The cell pellet was resuspended in cold sterile water. Lysozyme was added to the cell suspension and incubated for 30 min at 37 °C. The sample was heated at 80 °C for 10 min. The cells were centrifuged at 10 000 g for 15 min at 4 °C. The cells were resuspended in cold sterile water at 4 °C until use.
To enable microscopic observations, 1 ml aliquots of the spore preparations containing ∼108 spores∕ml were stained with 3 μl of a 1:1 mixture of SYTO9 and propidium iodide (LIVE∕DEAD® BacLight™, Invitrogen) and incubated at room temperature for 30 min in the dark. The spores were centrifuged (10 000 g) for 5 min and the pellet was aseptically transferred to a clean container to avoid residual staining.
Five different particle solutions were used in this study. First two solutions were prepared by diluting 1 μm fluorescent PS particles (FluoSpheres, Interfacial Dynamics) in de-ionized water (Simplicity, Millipore). Conductivity of the medium was adjusted to match a prescribed conductivity (0.05 S∕m) and the conductivity of apple juice (0.225 S∕m) by adding NaCl. The third and forth particle solutions were prepared by diluting B. subtilis and C. sporogenes spores in a commercial brand apple juice. In the last particle solution C. sporogenes spores were diluted in 2% fat milk (0.525 S∕m).
The prepared particle solution was then injected into the fluid chamber, and a 10 V peak-to-peak ac voltage was supplied by a function generator (AFG 3102, Tektronix). Particle motion was observed using an optical microscope (TE2000-U, Nikon) and a 10× objective (0.3 NA). Images were captured using software (IMAGE PRO, Media Cybernetics) and CCD camera (PowerView1.4 MP, TSI) with 1376×1040 pixel2 resolution (6.45 μm pixel size).
Numerical simulations
Commercially available multiphysics software (CFD-ACE+, CFD Research Corp.) was used in order to predict the particle behavior in a liquid medium under nonuniform ac electric field. Three-dimensional governing equations of the electrical, thermal, and mechanical problems were solved numerically with the appropriate boundary conditions. Details of the numerical solution and boundary conditions can be found in Ref. 19. In summary, the numerical procedure begins with the solution of electrical potential, ϕ, governed by Laplace’s equation: ∇2ϕ=0. Then, the computed electric field E=−∇ϕ is used to determine the Joule heating effects in the reduced energy equation [Eq. 4]. The solution of this equation gives the temperature field, which enables prediction of the electrical permittivity and conductivity variations within the liquid. Using a linear perturbation expansion, the time averaged electrical body force exerted on the fluid is computed using Eq. 5. The velocity field subjected to this body force is obtained by solving the incompressible Stokes equations [Eq. 6]. The DEP force acting on a particle is calculated using Eq. 2, once the electric field is computed.
Validation of the electrothermal flow capability of the software was previously demonstrated by Feng et al.,29 where a simple two-dimensional planar electrode was used to verify the numerical model with the analytical solutions. This two-dimensional problem was also modeled prior to the three-dimensional simulations, and excellent agreements are obtained with the analytical solution (results not shown for brevity).
RESULTS
In this section, we present the n-DEP particle capture results in shallow and deep chambers, where the ETF and DEP effects show variations as a function of the medium conductivity. Especially for the deep chamber cases, we will also present onset of a global flow, which enables local sample concentration at the center of the DEP chamber.
Particle capture in shallow chambers
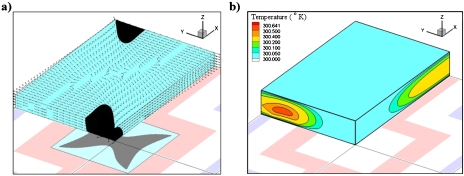
Simulated DEP force field acting on a pseudo-1-μm PS particle at 10 Vp.p. voltage and 10 MHz frequency is shown in Fig. 3a. The lateral components of DEP forces (shown in vectors) are plotted at a plane 10 μm above the electrode surface. Contour colors represent the direction of the vertical component of the DEP force (black: downward; cyan: upward). It can be deduced from this figure that the lateral DEP force vectors always drive the particles to the n-DEP capture zones. On the other hand, direction of the vertical component of n-DEP force is downward over most of the particle capture zone (shown in gray) and upward elsewhere. Thus the particles can only be captured at the specified regions, where the vertical component of DEP force is negative. In the meantime, the upward DEP force outside the capture zone prevents or decreases particle sticking on the electrode surfaces. This figure also implies that the n-DEP effects can capture the particles that are already inside the capture zone, unless a supportive effect, such as gravitational forces, that sediments particles onto the capture zones or ETF exists.
Figure 3.
(a) DEP force field acting on a pseudo 1 μm PS particle at 10 Vp.p. voltage and 10 MHz frequency. The lateral components of DEP forces are plotted at a plane 10 μm above the electrode surface (vectors). Contour colors represent the direction of the vertical component of the DEP force (black: downward and cyan: upward). (b) Temperature field inside the microfluidic chamber for high conductivity media (σ=0.225 S∕m).
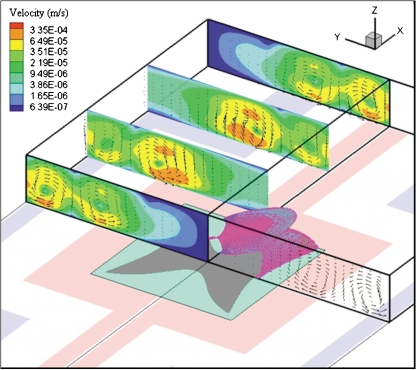
Temperature field due to the Joule heating inside the fluidic chamber is shown in Fig. 3b. A temperature maxima (0.641 °K warmer than the surfaces for σ=0.225 S∕m) is observed in the middle of the electrode surface and top cover glass. The temperature gradient produces variations in the electrical permittivity and conductivity of the liquid. These variations in the electrical properties result in charge density variations, and hence, electrical body forces on the fluid. This body force produces a fluid flow which is called the ETF. Fig. 4 shows the ETF field inside the microfluidic chamber at four different cross-sectional planes. Direction and magnitude of the flow velocity field are presented as vectors and contours, respectively. Velocity fields at four different slices show that the ETF can potentially circulate particles throughout the microfluidic chamber. There is a pair of counter-rotating vortices symmetric to the gap between two oppositely charged electrodes. The electrothermally induced vortices can continuously circulate and transport particles toward the DEP capture zone. While the first vortex circulates and brings the particles to the capture zone, the secondary vortex brings them to the centerline of the electrodes. There is a velocity field minimum over the capture zone, which eliminates (or reduces) the unfavorable effect of the ETF (i.e., dragging of the particles out of the capture zone). Based on this scenario, the number of captured particles is expected to gradually increase by time. Thus, the induced ETF should continuously enhance DEP capture of particles. The effective DEP capture zone is represented with pink colored isosurface over the square electrode. Contour colors inside the square electrode represent the direction of the vertical component of n-DEP force (upward: cyan; downward: gray). Below this isosurface, the n-DEP force pushes the particle downward, and hence the particle capture can take place. Outside this isosurface, DEP force repels particles away from the electrode surface and capture zone. The effective DEP zone, where the vertical component of DEP force is downward, extends to the top surface of the microfluidic chamber. This is particularly important because all particles over the electrodes are affected by the DEP force.
Figure 4.
Representation of electrothermal flow field inside the microfluidic chamber at four different cross-sectional planes. Direction and magnitude of the velocity field are presented as vector and contours at these slices. Effective DEP capture zone is represented with pink colored isosurface over the square electrode. Contour colors inside the square electrode represent upward (cyan) and downward (gray) DEP forces.
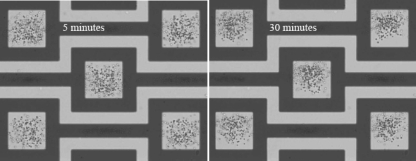
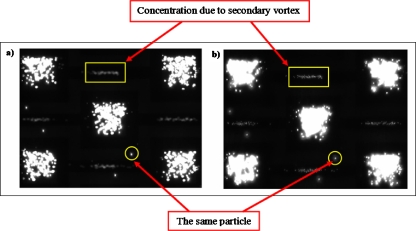
The n-DEP capture of particles on specified locations in a shallow chamber is experimentally observed using three different particle solutions. Fig. 5 shows the capture of 1 μm PS particles from a low conductivity solution (3.8 mM NaCl, 0.05 S∕m). Images were taken after applying 10 Vp.p. ac electric field at 10 MHz for 5 min (left) and 30 min (right). Due to the confined chamber, the particles outside the capture zone cannot be repelled away from the DEP force penetration region. Therefore, all of the particles are under the effect of DEP force, which always pushes the particles toward the capture zone in the horizontal domain, as shown in numerical solutions [Fig. 3a]. Comparison of the 5 and 30 min images infers that the particle concentration does not vary by time for low conductivity medium. This is because all of the particles inside the fluidic chamber are concentrated within 5 min. Figure 6 supports this conclusion. It shows the fluorescent images of 1 μm PS particles captured by the DEP trap for low conductivity medium after applying electric field for 5 min. The microscope is focused on the electrode surface and on the cover glass (top surface of the microfluidic chamber) in Figs. 6a, 6b, respectively. The exposure time is intentionally long to observe all of the particles inside the fluidic chamber. A careful examination shows that the same particles are observed in both figures, which means that there are no other particles inside the chamber, except from the captured and four stuck particles. This figure clearly shows that n-DEP trap in shallow chamber is able to capture all of the particles inside the fluidic chamber for low conductivity cases.
Figure 5.
Image of 1 μm PS particles suspended in low conductivity (0.05 S∕m) NaCl solution for 5 and 30 min after applying ac electric field at 10 Vp.p. voltage and 10 MHz frequency in 20 μm height chamber.
Figure 6.
Fluorescent image of 1 μm PS particles captured by n-DEP and electrothermal flow from low conductivity media (3.7 mM NaCl solution, σ=0.05 S∕m) in 20 μm height chamber. Microscope is focused (a) on the electrode surface and (b) on the cover glass. The exposure time is intentionally long to observe all particles inside the chamber.
Particle concentrations at the centerline of the electrodes are also observed in Fig. 6. Since the electrode centerline is a symmetry boundary, there are two electric field minima (and hence, DEP force minima): the first one is at the electrode surface and the second one is at the cover glass. These locations are velocity field minima as well. In addition, the secondary vortex for the shallow chamber is similar in size with its counterpart. Therefore, some of the circulated particles are brought to these locations by the secondary vortex, and captured by the DEP force. However only a few particles are concentrated at this location since the electric field minima is rather small in this region. As seen in this figure, these particles are better focused on Fig. 6b, which indicates they are concentrated on the upper surface rather than electrode surface since the DEP force repels particles to the upper surface.
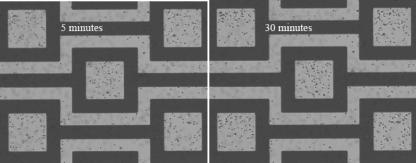
Figure 7 shows the n-DEP capture of 1 μm PS particles from high conductivity media (17 mM NaCl, 0.225 S∕m). When compared with the low conductivity case, there is a substantial decrease in the number of captured particles. One reason for this reduction is the adverse effects of the increased ETF. As the conductivity increases, electrothermal effects become dominant. The drag force acting on particles due to ETF overwhelms the DEP force and draws some of the particles away from the capture zone. Therefore, the particle concentration is less compared to the low conductivity case. In addition, as the conductivity increases, the electric double layer thickness decreases. Therefore, the particles can easily stick to the chamber surfaces. Furthermore, the vertical component of DEP force is upward except over the capture zone. This force pushes the particles to the upper surface of the chamber and increases the chances of particle sticking on to the surfaces. DEP increased particle sticking could not be observed for higher (400 μm) chambers since the upper surface is far away from the DEP force penetration region.19
Figure 7.
Image of 1 μm PS particles suspended in high conductivity (0.225 S∕m) NaCl solution at 5 and 30 min after applying ac electric field at 10 Vp.p. voltage and 10 MHz frequency in 20 μm height chamber.
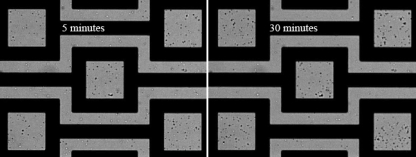
Similar results are also experimentally observed when we use the apple juice (0.225 S∕m) contaminated with B. subtilis spores. Figure 8 shows the n-DEP capture of B. subtilis spores, after 5 min (left) and 30 min (right) of ac electric field application at 10 Vp.p. and 20 MHz. As soon as the electric field is applied, randomly distributed B. subtilis spores interact with hydrodynamic and DEP forces and start being collected on the DEP capture sites. The concentration of captured spores increases gradually as the spores are continuously driven toward the electrode array by the electrothermal flow motion.
Figure 8.
Image of B. subtilis spores suspended in apple juice (0.225 S∕m) at 5 and 30 min after applying ac electric field at 10 Vp.p. voltage and 20 MHz frequency in 20 μm height chamber.
The difference in the number of captured particles by time is not viable when we visually compare the 5 and 30 min results in Figs. 78. Therefore, we presented a quantitative measurement to compare and demonstrate the DEP capture efficiency and electrothermal enhancement for high conductivity cases. For this reason, we processed the images of 5 and 30 min results and counted the captured particles using the “particle analyzer” tool in the IMAGEJ software (National Institutes of Health). The number of particles inside the five DEP capture site within 5 and 30 min of device operation is given in Table 1. The number of captured PS particles in NaCl solution increased more than 30% by time, which clearly shows the electrothermal enhancement of particle capture. In the meantime, the number of captured B. subtilis spores in apple juice increased more than 70% within 30 min. As we noticed, the increase of the B. subtilis captured from apple juice is more than that of PS particle from NaCl solution, which could be explained by the effects of gravity. The specific gravity of the B. subtilis spores is slightly higher (1.25–1.35 g∕ml) than that of the PS particles (1.05 g∕ml).30 As mentioned before, one of the reasons for the decrease in the number of captured particles in high conductivity solutions is the adverse effects of the ETF, which drag away particles from the DEP capture zone. Therefore, in addition to the increased sedimentation, higher specific gravity also results in less number of particles that are dragged away from the capture zone. For that reason the particle concentration at the designated locations increases more than that of PS.
Table 1.
Quantification of particle capture from high conductivity (0.225 S∕m) media.
| No. of particles | PS in 17 mM NaCl | B. subtilis in apple juice |
|---|---|---|
| 5 min | 336 | 154 |
| 30 min | 444 | 267 |
| Percentage increase | 32% | 73% |
Particle capture in deep chambers and onset of a global flow
The capture of PS particles from high conductivity NaCl solution (0.225 S∕m) in 400 μm high DEP chambers was demonstrated earlier.19 In this section, we present n-DEP capture of bacterial spores in food matrices, and also show the development of an electrothermally induced global flow within the microfluidic chamber.
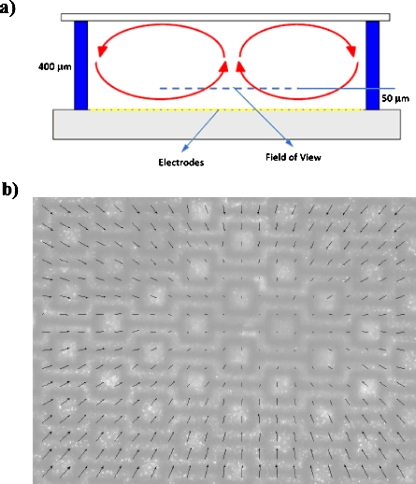
As mentioned before, the Joule heating effects increase with increased conductivity, and create temperature inhomogeneities in the DEP chamber. The system is similar to an internally heated enclosure. In our experiments using spacer heights larger than 150 μm, we observed a global fluid motion in the DEP chamber, which is schematically shown in Fig. 9a. The fluid circulates in the chamber by rising in the middle (over the electrodes) and then moves downward near the side boundaries. Although the reasons for this global motion are out of scope of the current study, we performed microparticle image velocimetry (μ-PIV) measurements of the flow. The μ-PIV experiments are performed using 1 μm diameter fluorescent PS particles diluted in apple juice under the application of 10 Vp.p. electric field at 10 MHz; using 4× (0.13 NA) objective lens. Image frames are captured and post processed using insight 3G software (TSI Inc.) to obtain the velocity field. Several time-sequences of images are correlated and ensemble-averaged to obtain higher resolution 2D velocity fields.
Figure 9.
(a) Schematic drawing of the side-view of the global flow observed in deep DEP chambers. (b) The velocity field measured inside the DEP chamber at a focal plane 50 μm above the electrode surface using the μ-PIV technique. The results are obtained in a 400 μm high DEP chamber using 1 μm fluorescent particles suspended in apple juice (0.225 S∕m) under 10 Vp.p. electric field at 10 MHz. The maximum measured velocity is 10 μm∕s.
The μ-PIV results at various focal planes confirm the circulating flow pattern, as depicted in Fig. 9a. Systematic variation of the DEP chamber height from 400 to 100 μm reveals that the magnitude of this global motion decreases with decreasing the spacer height. Below 150 μm, the fluid motion was very small and thus negligible (i.e., smaller than the Brownian motion of PIV particles). In addition, we have performed control experiments to eliminate the possibilities of light-induced motion and buoyancy driven flow due to the electrode surface heating. For these purposes, we checked the flow motion with and without the light source, and inverted the experimental setup to place DEP electrodes on the top. All results, not included here for brevity, indicate that the observed global flow is driven by the electric field and the Joule heating. We have planned detailed future studies for further investigation of this phenomenon.
Figure 9b shows the velocity field measured in apple juice at the center of the chamber and at a focal plane approximately 50 μm above the electrode surface. We must note that particle electrophoresis and ACEO at this excitation frequency is negligible, as previously shown using a scaling analysis.17 In addition, the DEP force decays rapidly away from the electrode surface. Therefore, the PS particles follow the fluid flow. As shown in this figure, there is a lateral fluid motion toward the center of the chamber from all sides of the boundary. The 2D velocity field is largest at the boundaries of the field of view with the maximum velocity of 10 μm∕s, and decreases through the center of the chamber where the fluid rises (i.e., fluid motion is upward over the center of the electrodes, and thus, cannot be measured using the 2D PIV technique).
This global fluid motion can be exploited to concentrate particles locally in the DEP capture zones. Figure 10 shows the B. subtilis spores suspended in apple juice in 400 μm height fluidic chamber. As soon as 10 Vp.p. at 10 MHz electric field is applied, the described global motion takes places and continuously circulates the B. subtilis spores inside the chamber. The spores are driven toward the center of the chamber by this motion, and hence the DEP capture sites at the center of the chamber are continuously feed by particles. As can be seen from the μ-PIV image [Fig. 9b] there is a lateral velocity field minimum at the center of the chamber, which serves as the primary particle collection area. Therefore, a large number of particles is captured by n-DEP traps at the center of the chamber (Fig. 10). Having the same particle concentrations with that of Fig. 8, we can easily see the particle capture enhancement due to the global fluid motion. However, unlike the case shown in Fig. 8, where the DEP particle capture was uniform in the entire DEP capture sites, B. subtilis spores are concentrated within a few capture sites at the center of the DEP chamber. As consistent with the velocity field data [Fig. 9b], the number of captured particles in the DEP capture sites is minimal at the boundaries of the field of view, and increases toward the center. This feature can be exploited to capture and detect particles from high conductivity media with low particle concentration. This motion causes nonspecific particle capture. Imprinting antibodies or fabricating biosensors at these capture sites could allow fast and target specific detection of initially low concentration of pathogens from high conductivity media.
Figure 10.
Image of B. subtilis spores suspended in apple juice (0.225 S∕m). As a result of the global fluid motion in the 400 μm height chamber, B. subtilis spores are driven to the center of the chamber, and they are captured by the DEP traps.
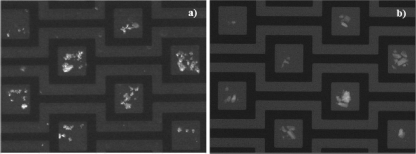
In Fig. 11 we show the n-DEP capture of C. sporogenes in apple juice (0.225 S∕m) and 2% fat milk (0.525 S∕m) after applying ac electric field for 30 min. The experimental configuration is similar to the results shown in Fig. 10, with the exception of the applied electric frequency of 50 MHz. Unlike B. subtilis spores the C. sporogenes spores aggregate in apple juice and milk, and they form large aggregates in the DEP traps. Therefore, it is not possible to enumerate the results for particle capture performance. In addition, it was difficult to obtain good quality images in milk due to its opaqueness. It is inferred from this figure that n-DEP can be successfully utilized to capture C. sporogenes spores form both apple juice and milk.
Figure 11.
n-DEP capture of stained C. sporogenes spores suspended in (a) apple juice (0.225 S∕m) and (b) 2% fat milk (0.525 S∕m) after applying 10 Vp.p. ac electric fields for 30 min at 50 MHz frequency. Chamber height is 400 μm.
CONCLUSIONS
Capture of B. subtilis and C. sporogenes spores and PS particles from high conductivity media using negative DEP is demonstrated using planar square electrodes acting as particle traps. Experiments are conducted at low (0.05 S∕m) and different high conductivity (0.225 and 0.525 S∕m) media, including a commercial brand of apple juice and 2% fat milk. Results obtained in 20 μm high chambers show combined effects of n-DEP and ETF at various medium conductivities. Specifically, the ETF circulates particles in the microfluidic chamber, while n-DEP has a limited region of capture as identified using numerical simulations. For low conductivity case, the ETF enhances the n-DEP capture by convecting the particles in to the DEP traps. Therefore, nearly all particles could be captured in the DEP traps. However, the ETF effects, induced by the Joule heating, increases with increased medium conductivity. As a result, the ETF can overwhelm the n-DEP. Specifically for PS particles suspended in NaCl medium (0.225 S∕m) and B. subtilis spores in apple juice (0.225 S∕m), we have observed a reduction in the n-DEP capture efficiency. The reason of this reduction can be explained as the increased electrothermal effects, which dominate the n-DEP force and drag particles away from the capture zones. An additional effect is the possibility of particle sticking to the top surface of the chamber, which is amplified by the thin electric double layer due to high conductivity and the n-DEP force that penetrates to the top surface of the shallow chamber. Although the particle capture in high conductivity medium is less compared to the low conductivity case, we have quantitatively demonstrated that the number of captured particles gradually increases by time. Compared to the 5 min results, the number of captured particles increased 32% for the PS particles suspended in NaCl solution and 73% for B. subtilis spores suspended in apple juice within 30 min of operation.
Using microparticle image velocimetry, we have experimentally shown the formation of a globally circulating fluid flow in high conductivity media for DEP chamber heights larger than 150 μm. Even though a detailed investigation of this flow is beyond the scope of this work, this circulating motion affects the n-DEP capture performance. We have shown that B. subtilis spores in apple juice are concentrated nonuniformly at the center of the fluidic chamber, which enables rapid capturing and potentially detection of particles from high conductivity media with low particle number concentration. Similar results are shown for C. sporogenes spores suspended in apple juice and milk. However, the C. sporogenes spores aggregate too much in these food matrices.
As successfully demonstrated by capturing the B. subtilis and C. sporogenes spores from apple juice and milk, current results can be utilized in the development of laboratory-on-a-chip devices for capture, concentration, and eventual detection of biological cells and bacterial spores from food matrices and high conductivity biological buffers. While the n-DEP traps enhanced by electrothermal flows capture and concentrate particles within 1000 separate sites, antibodies immobilized on these sites may enable target specific detection of biological particles in the future.
ACKNOWLEDGMENTS
This research was supported by the U.S. Department of Homeland Security (Grant No. N-00014-04-1-0659), through a grant awarded to the National Center for Food Protection and Defense at the University of Minnesota. Any opinions, findings, conclusions, or recommendations expressed in this publication are those of the author(s) and do not represent the policy or position of the Department of Homeland Security.
References
- Danzig R., Catastrophic Bioterrorism: What is to be Done?Center for Technology and National Security Policy, National Defense University, Washington, D.C., 2003). [Google Scholar]
- Wein L. M. and Liu Y., Proc. Natl. Acad. Sci. U.S.A. 102, 9984 (2005). 10.1073/pnas.0408526102 [DOI] [PMC free article] [PubMed] [Google Scholar]
- Balasubramanian A. K., Soni K. A., Beskok A., and Pillai S. D., Lab Chip 7, 1315 (2007). 10.1039/b706559k [DOI] [PubMed] [Google Scholar]
- Stone H. A., Stroock A. D., and Ajdari A., Annu. Rev. Fluid Mech. 36, 381 (2004). 10.1146/annurev.fluid.36.050802.122124 [DOI] [Google Scholar]
- Albrecht D. R., Sah R. L., and Bhatia S. N., Biophys. J. 87, 2131 (2004). 10.1529/biophysj.104.039511 [DOI] [PMC free article] [PubMed] [Google Scholar]
- Gascoyne P. R. C. and Vykoukal J., Electrophoresis 23, 1973 (2002). [DOI] [PMC free article] [PubMed] [Google Scholar]
- Lapizco-Encinas B. H., Simmons B. A., Cummings E. B., and Fintschenko Y., Electrophoresis 25, 1695 (2004). 10.1002/elps.200405899 [DOI] [PubMed] [Google Scholar]
- Voldman J., Braff R. A., Toner M., Gray M. L., and Schmidt M. A., Biophys. J. 80, 531 (2001). 10.1016/S0006-3495(01)76035-3 [DOI] [PMC free article] [PubMed] [Google Scholar]
- Pethig R., in BioMEMS and Biomedical Nanotechnology, edited by Ferrari M. (Springer, New York, 2007), Vol. II, pp. 103–126. [Google Scholar]
- Rosenthal A. and Voldman J., Biophys. J. 88, 2193 (2005). 10.1529/biophysj.104.049684 [DOI] [PMC free article] [PubMed] [Google Scholar]
- Pethig R., Huang Y., Wang X. B., and Burt J. P. H., J. Phys. D: Appl. Phys. 25, 881 (1992). 10.1088/0022-3727/25/5/022 [DOI] [Google Scholar]
- Huang Y. and Pethig R., Meas. Sci. Technol. 2, 1142 (1991). 10.1088/0957-0233/2/12/005 [DOI] [Google Scholar]
- Suzuki M., Yasukawa T., Shiku H., and Matsue T., Langmuir 23, 4088 (2007). 10.1021/la063075a [DOI] [PubMed] [Google Scholar]
- Bhatt K. H., Grego S., and Velev O. D., Langmuir 21, 6603 (2005). 10.1021/la050658w [DOI] [PubMed] [Google Scholar]
- Suzuki M., Yasukawa T., Mase Y., Oyamatsu D., Shiku H., and Matsue T., Langmuir 20, 11005 (2004). 10.1021/la048111p [DOI] [PubMed] [Google Scholar]
- Schnelle T., Muller T., and Fuhr G., J. Electrost. 50, 17 (2000). 10.1016/S0304-3886(00)00012-7 [DOI] [Google Scholar]
- Park S. and Beskok A., Anal. Chem. 80, 2832 (2008). 10.1021/ac7024859 [DOI] [PubMed] [Google Scholar]
- Ramos A., Morgan H., Green N. G., and Castellanos A., J. Phys. D: Appl. Phys. 31, 2338 (1998). 10.1088/0022-3727/31/18/021 [DOI] [Google Scholar]
- Park S., Koklu M., and Beskok A., Anal. Chem. 81, 2303 (2009). 10.1021/ac802471g [DOI] [PubMed] [Google Scholar]
- Morgan H. and Green N. G., AC Electrokinetics: Colloids and Nanoparticles (Research Studies Press, Ltd., Baldock, Hertfordshire, 2003). [Google Scholar]
- Jones T. B., Electromechanics of Particles (Cambridge University Press, Cambridge, 1995). 10.1017/CBO9780511574498 [DOI] [Google Scholar]
- Hu Q., Joshi R. P., and Beskok A., J. Appl. Phys. 106, 024701 (2009). [Google Scholar]
- Castellanos A., Ramos A., Gonzalez A., Green N. G., and Morgan H., J. Phys. D: Appl. Phys. 36, 2584 (2003). 10.1088/0022-3727/36/20/023 [DOI] [Google Scholar]
- Stratton J. A., Electromagnetic Theory (McGraw-Hill, New York, 1941). [Google Scholar]
- Chen D. F. and Du H., J. Micromech. Microeng. 16, 2411 (2006). 10.1088/0960-1317/16/11/023 [DOI] [Google Scholar]
- Feldman H. C., Sigurdson M., and Meinhart C. D., Lab Chip 7, 1553 (2007). 10.1039/b706745c [DOI] [PubMed] [Google Scholar]
- Sigurdson M., Wang D., and Meinhart C. D., Lab Chip 5, 1366 (2005). 10.1039/b508224b [DOI] [PubMed] [Google Scholar]
- Krulevitch P., Benett W., Hamilton J., Maghribi M., and Rose K., Biomed. Microdevices 4, 301 (2002). 10.1023/A:1020958323891 [DOI] [Google Scholar]
- Feng J. J., Krishnamoorthy S., and Sundaram S., Biomicrofluidics 1, 024102 (2007). 10.1063/1.2734910 [DOI] [PMC free article] [PubMed] [Google Scholar]
- Tisa L. S., Koshikawa T., and Gerhardt P., Appl. Environ. Microbiol. 43, 1307 (1982). [DOI] [PMC free article] [PubMed] [Google Scholar]


