

Abstract
In using musculoskeletal models, researchers can calculate muscle forces, and subsequently joint contact forces, providing insight into joint loading and the progression of such diseases as osteoarthritis (OA). The purpose of this study was to estimate the knee contact force (KCF) in patients with varying degrees of OA severity using muscle forces and joint reaction forces derived from OpenSim. Walking data was obtained from individuals with severe (n=2), moderate (n=10) and no signs of OA (n=14). For each subject, we generated 3D, muscle-actuated, forward dynamic simulations of the walking trials. Muscle forces that reproduced each subject’s gait were calculated. KCFs were then calculated using the vector sum of the muscle forces and joint reaction forces along the longitudinal axis of the femur. Moderate OA subjects exhibited a similar KCF pattern to healthy subjects, with lower KCF peaks (p = 0.0169). Although subjects with severe OA had similar initial peak KCF to healthy and moderate OA subjects (more than 4 times BW), the pattern of the KCF was very different between groups. After an initial peak, subjects with severe OA continually unloaded the joint, whereas healthy and moderate OA subjects reloaded the knee during late stance. In subjects with symmetric OA grades, there appears to be differences in loading between OA severities. Similar initial peaks of KCF imply that reduction of peak KCF may not be a compensatory strategy for OA patients; however, reducing duration of high magnitude loads may be employed.
Keywords: Osteoarthritis, knee contact force, musculoskeletal model
Introduction
Osteoarthritis (OA) is the most common form of arthritis, with the knee being the most affected joint. A combination of biochemical, biomechanical, and neuromuscular factors are thought to lead to the development and progression of OA (Felson 2000). The progression of OA is often accompanied by pain and may result in changes in gait and neuromuscular function, which may in turn lead to increased wear on the joint and further progression of the disease (Astephen, et al. 2008).
Gait analysis has provided significant information about biomechanical changes in OA (Astephen, et al. 2008, Hunt, et al. 2006, Baliunas, et al. 2002, Sharma, et al. 1998, Thorp, et al. 2006, Zeni and Higginson 2009). Studies have shown that altered loads on the articular cartilage due to obesity, increased knee laxity, decreased proprioception, increased age, increased knee adduction moments, and increased knee varus/valgus increase the risk of OA (Zhao, Banks and D’Lima, et al. 2007, Zhao, Banks and Mitchell, et al. 2007, Mundermann, Dyrby and Andriacchi 2005).
Instrumented tibiofemoral implant studies provide valuable in vivo loading information (Mundermann, Dyrby and D’Lima, et al. 2008, Varadarajan, et al. 2008, D’Lima, et al. 2008, Zhao, Banks and D’Lima, et al. 2007, Zhao, Banks and Mitchell, et al. 2007, Kim, et al. 2009). These studies have shown peak knee contact forces (KCF) ranging from 1.6 to 3.5 times body weight (BW) for self-selected speed walking (Mundermann, Dyrby and D’Lima, et al. 2008, Zhao, Banks and D’Lima, et al. 2007, Zhao, Banks and Mitchell, et al. 2007, Kim, et al. 2009). These studies, however, provide limited joint loading data pertaining to those individuals needing total knee arthroplasty, and require surgery for implantation, even though the data can be recorded and retrieved non-invasively post-surgery.
Recent advances in musculoskeletal modeling and computation power have enabled researchers to generate gait simulations in efforts to estimate muscle forces, and subsequently estimate joint contact forces (e.g. Kim et al., 2009, Winby et al., 2009). In rare cases, predictions of contact forces were validated with instrumented prostheses data and range from 1.9–3.5 BW at the tibiofemoral joint (Kim et al., 2009). KCFs during walking at self-selected speeds averaged 3.9 BW for healthy females and 3.4 BW for healthy males (Kuster et al., 1997), and exceeded 4.0 BW when using EMG-driven models (Winby et al., 2009). Taylor et al. (2004) used scaled, whole body models to calculate KCF during walking at self-selected speeds and showed forces averaging 3.1 BW.
Few studies have used computational modeling to calculate KCF during walking in patients with OA. Using a statically determinant model, Henriksen et al. (2006) compared KCF estimations between OA and healthy subjects and found significant differences. The average peak KCF calculated during early single limb support was 1.8 BW for OA subjects and 2.4 BW for healthy subjects, and 1.6 and 1.9 BW during late single limb support for OA and healthy subjects, respectively. However, they grouped all patients with radiographic evidence of OA into one group and compared them to a healthy control group (Henriksen, et al. 2006). Several studies have reported differences in KCF when asymmetric loading conditions exist during walking such as with unilateral hip osteoarthritis or following joint replacement (Levinger, Webster and Feller 2008, Milner 2008, Shakoor, et al. 2003), however none have addressed loading conditions for subjects with symmetric OA grades who likely use unique compensatory strategies.
The purpose of this study was to estimate the net KCF in healthy adults and those with increasing severity of symmetric knee OA using 3D, subject-specific, muscle-driven gait simulations generated using OpenSim (Delp, et al. 2007). We hypothesized that individuals with increased OA severity exhibit decreased net KCF consistent with slower self-selected walking speeds.
Methods
Subjects
Subjects were recruited locally to the University of Delaware to participate in the study. Only subjects who met the following criteria were included in the study: they had radiographic evidence of knee OA, they were ambulatory without assistive devices, they were able to walk for 10 minutes on a treadmill with breaks as needed, and they were between the ages of 40 and 85. Subjects were excluded from the study if they had any prior significant knee injury or surgery (with the exception of arthroscopic debridement), uncontrolled hypertension or unstable angina, neurological disorder such as a stroke or Parkinson’s disease, diagnosed OA at another lower extremity joint, or a pain score greater than 5/10 on the contralateral knee. Eligible subjects signed informed consent forms approved by the Human Subjects Review Board prior to their participation.
Subjects first obtained a standing radiograph, with the knee flexed to 30 degrees. The radiographs were read by an experienced radiologist familiar with the Kellgren-Lawrence (KL) OA grading scale, and assigned a score ranging from 0 to 4, with 4 being the most severe OA grade (Zeni, Rudolph and Higginson 2010). Healthy subjects had no or minimal evidence of joint space narrowing or osteophytes and no complaints of knee pain (n=14), while moderate (n=10) and severe (n=2) OA subjects had KL scores of 2–3 or 4, respectively (Table 1). All subjects had symmetric OA grades and potential subjects were excluded if the lateral compartment grade was greater than the ipsilateral medial compartment.
Table 1.
Anthropometric and spatiotemporal parameters at self-selected speeds across OA severities Mean (SD).
| OA Group | Age (years) | Height (m) | Weight (kg) | Speed (m/s) | Stride Length (m) | Double Support (%Gait Cycle) |
|---|---|---|---|---|---|---|
| Healthy (n = 14) | 52.1 (12.5) | 1.62 (0.13) | 70.2 (13.9)* | 1.30 (0.5) | 1.22 (0.21) | 12.88 (1.36)* |
| Moderate (n = 10) | 60.3 (8.5) | 1.71 (0.09) | 85.3 (17.5)* | 1.19 (0.53) | 1.16 (0.17) | 14.44 (1.92)* |
| Severe (n = 2) | 58 | 1.66 | 88.2 | 0.98 | 0.99 | 19.04 |
Represents significant differences between healthy and moderate groups (p < 0.05). Statistics were not calculated for the severe group.
Gait analysis
Gait analysis consisted of a 30-second walking trial at self-selected speed on an instrumented split-belt treadmill (Bertec Corp, Columbus, OH). Reflective markers were applied to the subjects using the Helen Hayes marker set. 3D kinematic data was collected with eight cameras at 60 Hz (Motion Analysis, Santa Rosa, CA), while kinetic data was simultaneously collected at 1080 Hz. EMG data was also collected at 1080 Hz for vastus lateralis and medial hamstrings. EMG signals were normalized to peak during each walking trial. Experimental muscle activity (EMG) was compared to the predicted muscle activity to improve confidence in the simulation results.
Gait Simulations
OpenSim (Delp, et al. 2007) was used to generate 3D, subject-specific, muscle-actuated simulations of each subject. The 3D model consisted of 23 degrees of freedom (DOF) and 54 muscles. The knee was represented as a 1 DOF hinge joint allowing with anterior-posterior translation occurring as a function of flexion/extension. The 3D model was scaled to match each subject’s height and weight. Segment lengths were obtained from the marker positions acquired during the static trial, and segment masses were scaled based on anthropometric data and the subject’s body weight. A computed muscle control (CMC) algorithm calculated muscle excitations and forces that generated the muscle-driven simulation of the subject’s movements (Delp, et al. 2007, Thelen and Anderson 2006, Thelen, Anderson and Delp 2003). Simulations were generated for eight gait cycles (four on each leg) and then averaged for each leg.
Calculation of Co-contraction Index
Muscle activations were calculated for quadriceps and hamstrings muscle groups for each subject. Total activation was then determined as the sum of the quadriceps and hamstrings activation, and co-contraction depends on total activation as well as relative EMG levels (Zeni et al, 2010). Since the groups consist of subjects with uniform OA grades, the two legs were averaged for each subject. The values were then averaged across OA severity and compared between groups.
Calculation of KCF
Muscle and bone orientations were derived from OpenSim. The muscle forces were decomposed into orthogonal components, with the component along the long axis of the femur contributing to the compressive KCF. Only the muscles crossing the knee were used in this calculation: biceps femoris long head, biceps femoris short head, rectus femoris, vastus, tensor fasciae longus, sartorius, gracilis, and gastrocnemius. Next, inverse dynamics was used to calculate the joint reaction force (JRF) at the knee using segment masses and accelerations from OpenSim and experimental ground reaction forces. The JRFs were also broken into components, with the component along the long axis of the femur contributing to the KCF. The net KCF was calculated as the sum of the muscle and JRF components. Since the groups consist of subjects with uniform OA grades, the two legs were averaged for each subject, and first and second peaks of the KCFs were compared between groups.
Statistical analysis
Paired t-tests were used for comparison between healthy and moderate OA groups. Parameters of interest were the first and second KCF peaks. Paired t-tests were also used to confirm that the right and left legs were representative of each other for the healthy and moderate OA groups with insignificance (p > 0.05) indicating that symmetry existed. Parameters of interest were the first and second KCF peaks as well as the timing of these peaks in the gait cycle. Statistics were not calculated for the severe group due to small sample size.
Results
Comparison of normalized EMG activity and muscle forces showed agreement in patterns for both the hamstrings and quadriceps muscle groups for all OA severities (RMSE ranged from 0.1347 to 0.3033; peak RMSE was 0.2805 for healthy, 0.3033 for moderate OA and 0.2535 for severe OA). Hamstrings and quadriceps co-contractions and total activations increased with OA severity (Fig. 1A and B).
Fig. 1.

A) Co-contraction index of quadriceps and hamstrings for healthy (solid black), moderate (dashed black) and severe (solid gray) OA groups. B) Total activation (quadriceps + hamstrings activation) for healthy (solid black), moderate (dashed black) and severe (solid gray) OA groups.
No statistically significant differences were found between right and left legs in the first or second peaks of the KCF for healthy (p = 0.69 and p = 0.40, respectively) or moderate OA groups (p = 0.96 and 0.31, respectively; Fig. 2). The timing of the first or second peaks in the gait cycle was also similar.
Fig. 2.

Average right (solid line) and left (dashed line) KCFs for (A) healthy and (B) moderate OA groups during stance phase. The shaded region represents one standard deviation.
We found that the muscles had a major contribution to the KCF (Fig. 3). No differences were found in the first peak KCF between healthy and moderate OA subjects (p = 0.40; Table 2; Fig. 4). Significant differences existed in the second peak KCF between healthy and moderate OA subjects (4.40 and 3.79, respectively; p = 0.021). The overall peak KCF occurred during late stance (second peak) for healthy subjects and during early stance (first peak) for moderate and severe OA subjects. A trend was observed where the second peak KCF decreased with increasing OA severity. Healthy and moderate subjects exhibited two distinct peaks in the KCF, whereas severe subjects appeared to unload their knee throughout stance phase (Fig. 4).
Fig. 3.

(A) Muscle force and JRF contributions to the KCF. (B) Individual muscle contributions to the total muscle force component of the KCF. Only the components along the long axis of the femur are shown.
Table 2.
Peak KCFs across OA severities expressed in BW. Mean (SD).
| Group | 1st Peak | 2nd Peak |
|---|---|---|
| Healthy | 4.36 (0.76) | 4.40* (0.70) |
| Moderate | 4.17 (0.74) | 3.79* (0.51) |
| Severe | 4.45 | 3.67 |
Represents significant differences between healthy and moderate groups (p < 0.05). Statistics were not calculated for the severe group.
Fig. 4.
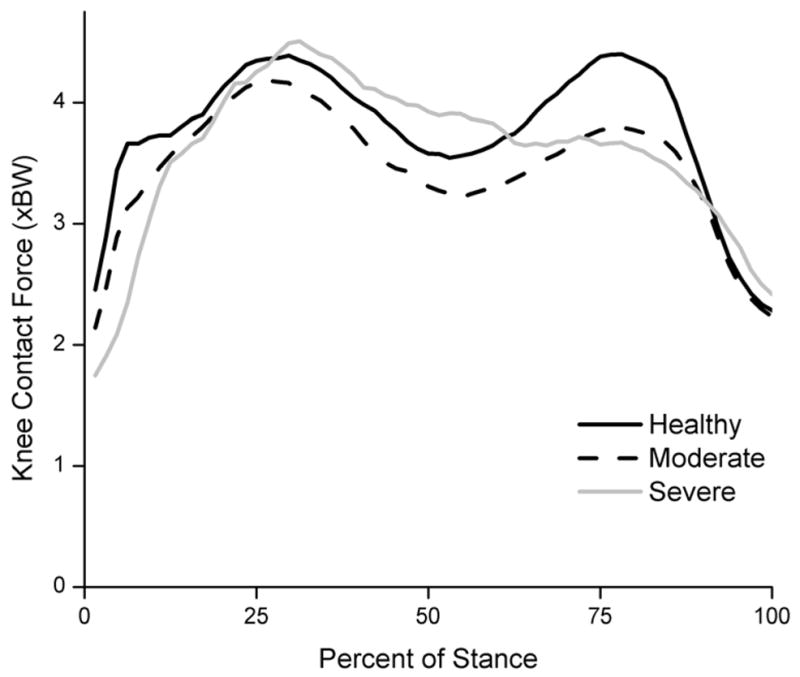
KCF during stance phase across varying OA severities. Healthy subjects (solid black) had significantly higher second peak KCFs than moderate subjects (dashed black). Severe subjects exhibited a different pattern than healthy and moderate OA subjects, unloading their knees throughout stance phase.
Several anthropometric and spatiotemporal parameters were also examined across subject groups (Table 1). No differences were found in speed, height, or stride length, although a trend suggests that stride length decreases with increasing OA severity. However, statistically significant differences between healthy and moderate OA subjects were found in weight (p = 0.04) and double support time (p = 0.04). Subjects with severe OA used decreased speed, shorter stride length and longer double support times than the moderate and healthy groups.
Discussion
Peak KCFs during walking in this study ranged from 3.67 to 4.45 BW and decreased with OA severity (Fig. 4; Table 2). Results were symmetric for healthy adults and those with moderate OA suggesting that this subgroup of the OA population uses a whole-body compensatory strategy rather than unloading an individual limb.
Muscles contributed substantially to the KCF (Fig 3), adding forces up to 3.5 BW. Others have also concluded that muscles play a significant role in knee joint contact loads in healthy adults (Winby et al., 2009). The predicted activity patterns of the quadriceps and hamstrings muscle groups are similar to EMG data which gives confidence in the ability of our model to estimate loading patterns at the knee. Furthermore, we can see that the model predicts increasing co-contraction between quadriceps and hamstrings with increasing OA severity (Fig. 1A). This increase in co-contraction is consistent with increases in total activation (Fig. 1B). Other studies have shown that co-contraction of the quadriceps and hamstrings is present in healthy subjects, and the degree of co-contraction increases in subjects with knee OA despite declines with walking speed (Zeni, Rudolph and Higginson 2010).
Although no significant differences in speed were observed between groups, a trend was observed that adults with knee OA walk more slowly than their healthy counterparts. We might expect reduced joint loads at slower speeds, and in fact the second peak of the KCF decreased significantly with increasing OA severity. However, the first peak of the KCF was similar between groups suggesting that increases in KCF due to co-contraction early in stance may offset reductions in muscle forces expected with slower walking speeds in the OA population. Additionally, decreased walking speed has been reported when there is increased self-assessed pain in subjects with OA (Nebel, et al. 2009). Therefore, reducing walking speed may decrease KCF in order to alleviate pain associated with OA.
Instrumented tibiofemoral implant studies have provided researchers with invaluable data regarding the dynamic loading conditions at the knee, reporting KCFs ranging from 1.6 to 3.5 BW during level walking (Mundermann, Dyrby and D’Lima, et al. 2008, Varadarajan, et al. 2008, D’Lima, et al. 2008, Zhao, Banks and D’Lima, et al. 2007, Zhao, Banks and Mitchell, et al. 2007, Kim, et al. 2009), values generally below the peaks found in this study. However, the results from instrumented prostheses cannot be extrapolated to larger populations other than tibiofemoral implant patients because of the drastically different joint conditions. A gold standard does not exist for estimating KCF, but others have demonstrated the ability of musculoskeletal models to predict physiological joint loads by comparing with measured KCFs from an instrumented implant (Kim et al., 2009). Although our model does not include knee ligaments to ensure loading of the lateral compartment, we have constrained the joint to only a single rotational DOF and do find muscle activity which would promote loading of both compartments.
For our study, we included subjects with identical bilateral OA grades who exhibited symmetrical joint loading patterns to avoid confounding issues with compensatory strategies employed by subjects with a single painful joint. In fact, no significant differences were found between right and left legs for the first and second KCF peaks, nor the timing of these peaks in the stance phase, supporting the findings of previous studies involving healthy adults and those with moderate OA (Sadeghi, et al. 2004, Liikavainio, et al. 2007). This is important because it suggests that there are similar loading conditions present in both knees so any utilized compensatory strategy maintains symmetry.
Statistical analysis revealed significant differences between healthy and moderate OA subjects in the second KCF peak, but not in the first peak (Fig. 4; Table 2). Therefore, reduction of overall peak KCF may not be a compensatory method for subjects with knee OA. Specifically, differences in the second peak KCF are attributed to decreased gastrocnemius force. The second peak KCF coincides with the forward propulsion of the center of mass, which occurs during late stance. During late stance, there is also maximal hip extension, which causes the femur to be aligned with the tibia. Since much of the KCF results from muscle force (Fig. 3), we can conclude that the lower second KCF peaks arise from less muscle force being produced to propel the body forward, consistent with slower walking speeds generally adopted by subjects with moderate knee OA.
Although statistical analysis was not conducted for the severe OA group (n=2), several trends can be observed. First, we saw initial peak KCFs similar to healthy and moderate OA groups. However, severe OA subjects exhibited prolonged midstance loading and lower second peak KCFs, consistent with decreased propulsive force and walking speed. Severe OA subjects also had shorter stride length and longer double support time than healthy and moderate OA subjects. Therefore, by decreasing walking speed, increasing double support time, and decreasing stride length, subjects with OA can decrease the second KCF peak.
We acknowledge several limitations with the musculoskeletal model used for this study. The knee was represented as a single DOF joint and we solved for muscle contributions to knee flexion/extension which is achieved by strategic control of the quadriceps, hamstrings and gastrocnemius muscles. Although this provided us with a representation of the knee and a net KCF, the effect of adduction moments on KCF were not addressed nor was the distribution of loads on the medial and lateral compartments verified directly. Several studies have shown that there is significant correlation between medial knee compartment loading and the knee adduction moment (Zhao, Banks and D’Lima, et al. 2007, Zhao, Banks and Mitchell, et al. 2007, Mundermann, Dyrby and Andriacchi 2005). Since this study examines net KCF, and not medial/lateral compartment loads resulting from adduction moments, we feel that the simplified knee joint provided adequate estimates.
In addition, there is no way to validate the individual muscle forces that are being calculated by directly measuring in vivo muscle forces in the OA population. We can only verify that the muscles in the model are active at physiological times by comparing normalized experimental EMG signals to predicted muscle activity (Fig. 1). Kim et al. (2009) found only small differences between measured values of KCFs from an instrumented implant and predicted values from a subject-specific musculoskeletal model. Since muscles contribute significantly to KCF, estimates of muscle force based on musculoskeletal models must be reasonably well predicted. Furthermore, plantarflexor force (sum of the gastrocnemius and soleus muscles) calculated from our musculoskeletal simulations are comparable to loads measured in vivo via the Achilles tendon using implanted force transducers (Froberg, et al. 2009). Although there are important differences between models and patient groups studied previously, recent results support the use of musculoskeletal models to predict physiological loading conditions in the knee (Kim, et al. 2009, Froberg, et al. 2009).
Conclusion
Subjects with healthy knees or symmetric OA exhibit symmetry of KCFs between their right and left legs. There appears to be decreases in loading with increasing OA severity. Similar initial peaks of KCF imply that reduction of overall peak KCF may not be a compensatory strategy for OA patients. However, decreased second peaks of KCF in subjects with increasing OA severity indicates that less muscle force is being produced, and therefore the subjects are not propelling themselves forward with as much force. This could explain why subjects with increasing OA severity have slower gait speeds. Further, the slowed gait prevents the subjects from reloading their knees to a higher force late in stance phase and could be a compensatory mechanism.
Acknowledgments
The authors would like to thank Joseph Zeni, Jr. and Andy Kubinski for their assistance in data collection and processing. Financial support for this project was provided by NIH P20-16458.
Footnotes
Conflict of Interest
The authors have no conflict of interest in this study.
Publisher's Disclaimer: This is a PDF file of an unedited manuscript that has been accepted for publication. As a service to our customers we are providing this early version of the manuscript. The manuscript will undergo copyediting, typesetting, and review of the resulting proof before it is published in its final citable form. Please note that during the production process errors may be discovered which could affect the content, and all legal disclaimers that apply to the journal pertain.
References
- Astephen JL, Deluzio KJ, Caldwell GE, Dunbar MJ, Hubley-Kozey CL. Gait and neuromuscular pattern changes are associated with differences in osteoarthritis severity levels. J Biomech. 2008;41:868–876. doi: 10.1016/j.jbiomech.2007.10.016. [DOI] [PubMed] [Google Scholar]
- Baliunas AJ, et al. Increased knee joint loads during walking are present in subjects with knee osteoarthritis. Osteoarthritis and Cartilage. 2002;10(7):573–579. doi: 10.1053/joca.2002.0797. [DOI] [PubMed] [Google Scholar]
- Delp SL, et al. OpenSim: Open-Source Software to Create and Analyze Dynamic Simulations of Movement. IEEE Trans Biomed Eng. 2007;54:1940–1950. doi: 10.1109/TBME.2007.901024. [DOI] [PubMed] [Google Scholar]
- D’Lima DD, Steklov N, Fregly BJ, Banks SA, Colwell CW., Jr In Vivo Contact Stresses during Activities of Daily Living after Knee Arthroplasty. J Orthop Res. 2008;26:1549–1555. doi: 10.1002/jor.20670. [DOI] [PubMed] [Google Scholar]
- Felson DT. Osteoarthritis: New Insights; Part 1: The Disease and Its Risk Factors. NIH Conference; 2000. [DOI] [PubMed] [Google Scholar]
- Froberg A, Komi P, Ishikawa M, Movin T, Arndt A. Force in the Achilles Tendon During Walking With Ankle Foot Orthosis. Am J Sports Med. 2009;37(9):1200–1207. doi: 10.1177/0363546508330126. [DOI] [PubMed] [Google Scholar]
- Henriksen M, et al. Increased joint loads during walking - A consequence of pain relief in knee osteoarthritis. The Knee. 2006;13:445–450. doi: 10.1016/j.knee.2006.08.005. [DOI] [PubMed] [Google Scholar]
- Hunt MA, Birmingham TB, Giffin JR, Jenkyn TR. Associations among knee adduction moment, frontal plane ground reaction force, and lever arm during walking in patients with knee osteoarthritis. J Biomech. 2006;39(12):2213–2220. doi: 10.1016/j.jbiomech.2005.07.002. [DOI] [PubMed] [Google Scholar]
- Kim HJ, Fernandez JW, Akbarshahi M, Walter JP, Fregly BJ, Pandy MG. Evaluation of Predicted Knee-Joint Muscle Forces during Gait Using an Instrumented Knee Implant. J Orthop Res. 2009;27(10):1326–1331. doi: 10.1002/jor.20876. [DOI] [PubMed] [Google Scholar]
- Kuster MS, Wood GA, Stachowiak GW, Gachter A. Joint Load Considerations in Total Knee Replacement. Brit Ed Soc of Bone Joint Surg. 1997;79:109–113. doi: 10.1302/0301-620x.79b1.6978. [DOI] [PubMed] [Google Scholar]
- Levinger P, Webster KE, Feller J. Asymmetric knee loading at heel contact during walking in patients with unilateral knee replacement. The Knee. 2008;15:456–460. doi: 10.1016/j.knee.2008.06.002. [DOI] [PubMed] [Google Scholar]
- Liikavainio T, et al. Loading and gait symmetry during level and stair walking in asymptomatic subjects with knee osteoarthritis: Importance of quadriceps femoris in reducing impact force during heel strike? The Knee. 2007;14:231–238. doi: 10.1016/j.knee.2007.03.001. [DOI] [PubMed] [Google Scholar]
- Milner CE. Interlimb asymmetry during walking following unilateral total knee arthroplasty. Gait Posture. 2008;28:69–73. doi: 10.1016/j.gaitpost.2007.10.002. [DOI] [PubMed] [Google Scholar]
- Mundermann A, Dyrby CO, Andriacchi TP. Secondary Gait Changes in Patients with Medial Compartment Knee Osteoarthritis. Arth Rheum. 2005;52:2835–2844. doi: 10.1002/art.21262. [DOI] [PubMed] [Google Scholar]
- Mundermann A, Dyrby CO, D’Lima DD, Colwell CW, Jr, Andriacchi TP. In Vivo Knee Loading Characteristics during Activities of Daily Living as Measured by an Instrumented Total Knee Replacement. J Orthop Res. 2008;26:1167–1172. doi: 10.1002/jor.20655. [DOI] [PubMed] [Google Scholar]
- Nebel MB, et al. The relationship of self-reported pain and functional impairment to gait mechanics in overweight and obese persons with knee osteoarthritis. Arch Phys Med Rehab. 2009;90:1874–1879. doi: 10.1016/j.apmr.2009.07.010. [DOI] [PMC free article] [PubMed] [Google Scholar]
- Sadeghi H, Prince F, Zabjek KF, Labelle H. Simultaneous, bilateral, and three-dimensional gait analysis of elderly people without impairments. Am J Phys Med Rehabil. 2004;2(83):112–123. doi: 10.1097/01.PHM.0000107484.41639.2C. [DOI] [PubMed] [Google Scholar]
- Shakoor N, Hurwitz DE, Block JA, Shott S, Case JP. Asymmetric knee loading in advanced unilateral hip osteoarthritis. Arth Rheum. 2003;48:1556–1561. doi: 10.1002/art.11034. [DOI] [PubMed] [Google Scholar]
- Sharma L, et al. Knee adduction moment, serum hyaluronan level, and disease severity in medial tibiofemoral osteoarthritis. Arth Rheum. 1998;41(7):1233–1240. doi: 10.1002/1529-0131(199807)41:7<1233::AID-ART14>3.0.CO;2-L. [DOI] [PubMed] [Google Scholar]
- Taylor WR, Heller MO, Bergmann G, Duda GN. Tibio-femoral loading during human gait and stair climbing. J Orthop Res. 2004;22:625–632. doi: 10.1016/j.orthres.2003.09.003. [DOI] [PubMed] [Google Scholar]
- Thelen DG, Anderson FC. Using computed muscle control to generate forward dynamic simulations of human walking from experimental data. J Biomech. 2006;39(6):1107–1115. doi: 10.1016/j.jbiomech.2005.02.010. [DOI] [PubMed] [Google Scholar]
- Thelen DG, Anderson FC, Delp SL. Generating dynamic simulations of movement using computed muscle control. J Biomech. 2003;36(3):321–328. doi: 10.1016/s0021-9290(02)00432-3. [DOI] [PubMed] [Google Scholar]
- Thorp LE, Sumner DR, Block JA, Moisio KC, Shott S, Wimmer MA. Knee joint loading differs in individuals with mild compared with moderate medial knee osteoarthritis. Arth Rheum. 2006;54(12):3842–3849. doi: 10.1002/art.22247. [DOI] [PubMed] [Google Scholar]
- Varadarajan KM, Moynihan AL, D’Lima DD, Colwell CW, Li G. In vivo contact kinematics and contact forces of the knee after total knee arthroplasty during dynamic weight-bearing activities. J Biomech. 2008;41:2159–2168. doi: 10.1016/j.jbiomech.2008.04.021. [DOI] [PMC free article] [PubMed] [Google Scholar]
- Winby CR, Lloyd DG, Besier TF, Kirk TB. Muscle and external load contribution to knee joint contact loads during normal gait. Journal of Biomechanics. 2009;42(14):2294–2300. doi: 10.1016/j.jbiomech.2009.06.019. [DOI] [PubMed] [Google Scholar]
- Zeni JA, Rudolph K, Higginson JS. Alterations in quadriceps and hamstrings coordination in persons with medial compartment knee osteoarthritis. J Electromyography Kines. 2010;20(1):148–54. doi: 10.1016/j.jelekin.2008.12.003. [DOI] [PMC free article] [PubMed] [Google Scholar]
- Zeni JA, Higginson JS. Differences in gait parameters between healthy subjects and persons with moderate and severe knee osteoarthritis: A result of altered walking speed? Clin Biomech. 2009;24(4):372–378. doi: 10.1016/j.clinbiomech.2009.02.001. [DOI] [PMC free article] [PubMed] [Google Scholar]
- Zhao D, Banks SA, D’Lima DD, Colwell CW, Fregly BJ. In Vivo Medial and Lateral Tibial Loads during Dynamic and High Flexion Activites. J Orthop Res. 2007;25:593–602. doi: 10.1002/jor.20362. [DOI] [PubMed] [Google Scholar]
- Zhao D, Banks SA, Mitchell KH, D’Lima DD, Colwell CW, Fregly BJ. Correlation between the Knee Adduction Torque and Medial Contact Force for a Variety of Gait Patterns. J Orthop Res. 2007;25:789–797. doi: 10.1002/jor.20379. [DOI] [PubMed] [Google Scholar]