Abstract
Tendon pathology is frequently sub-clinical prior to frank rupture, denoting the need for non-destructive methods of assessing disease presence and progression. Despite the lack of clinical presentation, previous studies have observed that distinct changes to the tendon microstructure are present, and that such qualitative changes have a dose-response relationship with the level of damage accumulated. These initial findings suggest that there is value in investigating the physical nature of damage within tendon, not only to better understand the pathological process, but to gain insight into reparative processes and develop treatments. However, a necessary first step towards carrying out these avenues of research is to develop diagnostic tools for quantitatively assessing the level of damage present.
In this study, we established a dose-response relationship between a quantitative measure of structural damage and the level of global damage induced. Furthermore, we developed and validated an automated technique for quantifying matrix disorganization (damage), which correlates and co-localizes strongly with manual quantification. In combination, these findings allow us to measure the amount of damage accumulation of a region of tendon on a clinical scale, rapidly and accurately.
Keywords: tendon, collagen, damage, microstructure, second harmonic generation, Fourier transform
1. Introduction
Tendon pathology is associated with morphological changes to the collagen fiber microstructure (Fung et al., 2008; Kannus and Jozsa, 1991; Kastelic and Baer, 1980; Sonnabend et al., 2001), which has been studied and modeled extensively (Alastrue et al., 2007; Ciarletta and Ben Amar, 2009; Natali et al., 2005). Recently, such morphological changes were also observed in an in vivo rat model of tendon fatigue as well (Fung et al., 2009). Importantly, a dose-response relationship between fatigue and morphological changes which are the physical manifestation of damage was noted, in which control tendon had no distortion or fiber disruption, low fatigue resulted in fiber kinking, moderate fatigue resulted in further kinking, and high damage resulted in fiber rupture and delamination (Fig. 1). Based on these fatigue-level specific morphological changes, we hypothesized that damage area fraction (DAF) varies as a function of fatigue damage induced. The ability to quantify damage accumulation within tendon using image analysis provides a powerful tool for locally measuring damage accumulation and, if paired with a non-destructive imaging modality, has potential future clinical applications. However, the time-intensive nature of manual image analysis limits the applicability of any progress in this field. Therefore, we also developed and validated an automated method to quantify damage accumulation in tendon.
Fig. 1.
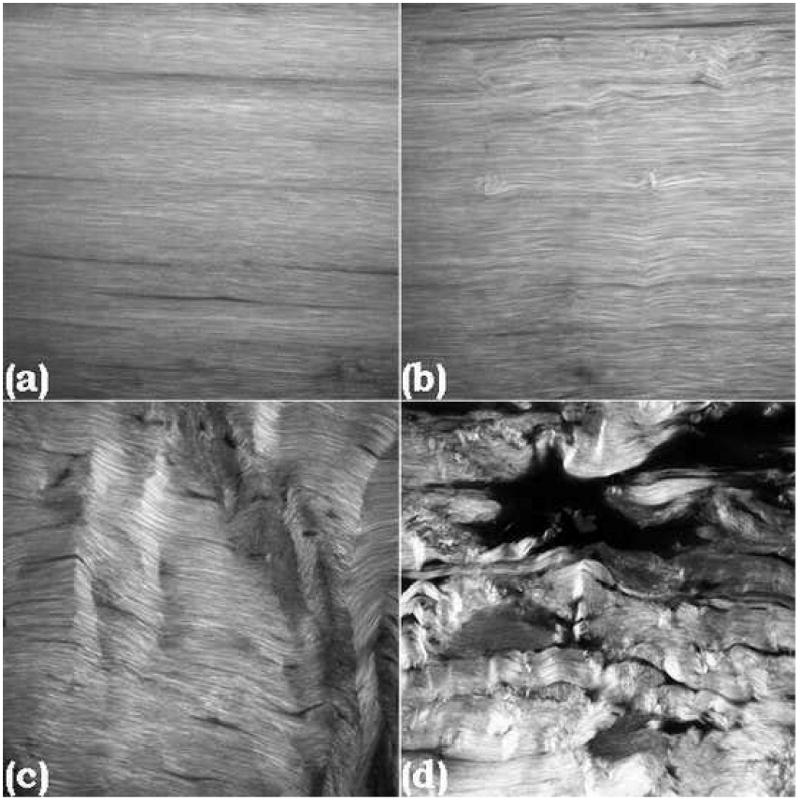
1024×1024 pixel SHG images of control (a), low- (b), moderate- (c), and high-level damage (d) in tendon (resolution = 0.2μm/pixel). There is a progression from no distortion or disruption to kinking of fibers which increases with damage accumulation, finally resulting in discontinuities and ruptures among fibers.
2. Materials and methods
2.1 Microstructural image generation
Using a previously published rat model (Fung et al., 2009), rat patellar tendons were cyclically loaded between 1 and 35N (∼40% of monotonic failure strength) to low- (n=4), moderate- (n=3), and high-level fatigue (n=3), defined by fatigue-creep (0.6%, 1.7%, and 3.5% peak strain beyond baseline, respectively); naïve patellar tendons were used as controls (n=3). All rats were immediately sacrificed, and patellar tendons were fixed in tension using formalin, embedded in methyl methacrylate, and anhydrously cut into 0.2mm sagittal sections. Second harmonic generation (SHG) imaging on unstained tendon sections was performed on an upright laser-scanning multiphoton microscope (BioRad Radiance2000; Carl Zeiss Microimaging Inc., Thornwood, NY), with a 10-Watt Verdi V10-Mira 900 Ti:Sapphire laser (Coherent Inc., Santa Clara, CA) tuned to 840 nm. A 60× (NA=1.4) oil immersion objective was used for focusing the excitation beam on slides that were mounted on the stage with the longitudinal axis of the tendon aligned with the horizontal axis of the visual field. Reflected SHG signals were collected using an external detector via a bandpass filter (450/80 nm). Under these configurations, 8-bit grayscale images were acquired with 1024 × 1024 pixel resolution on a field of view of 205 μm at a scan speed of 50 lines/second and 1 μm optical sections through the entire thickness of the midlength region of the central sagittal tendon section. Images were exported in TIFF format
2.2 Manual damage quantification
A grid with 30×30 pixel windows (6×6μm, 900 windows/image) was superimposed on 13 SHG images (1 image per tendon) using ImageJ (Rasband, 1997-2010). Each window was then determined to be damaged or non-damaged, using an established set of rules based upon a previously published definition of damage (Fung et al., 2008), by a blinded user. The number of damaged windows was then normalized by the total number of windows in the image to determine its DAF. Each image was analyzed three times to determine the user's repeatability, which was assessed using a repeated measures ANOVA with post-hoc Bonferroni test. All data are reported as mean ± standard deviation, and p ≤ 0.05 represents statistical significance for all statistical tests.
2.3 Automatic damage quantification
An additional cohort of rat patellar tendons (n=19) were loaded to 7200 cycles, and three images were taken per tendon (n=57 images). Each image was analyzed via a custom-written MATLAB (The MathWorks, Natick, MA) code which first divided the image into many smaller windows. The fast Fourier transform power spectrum (FFT-ps) of each window was plotted, then processed using a 3×3 pixel Gaussian filter with σ=1 pixel, followed by a high-pass filter to remove all but the top 10% of contiguous pixels by intensity. An ellipse was then fit around the processed FFT-ps. Given the nature of the FFT-ps, the principle fiber orientation of the window is parallel to the orientation of the semi-minor axis of the ellipse; therefore Fiber Orientation (FO) was defined as the angle of rotation of the semi-minor axis from the positive x-axis (Fig. 2). Furthermore, the ratio of the semi-major axis length to the semi-minor axis length provides an indication of the confidence of fiber orientation identification. A Confidence Index (CI) was calculated for each FO
Fig. 2.
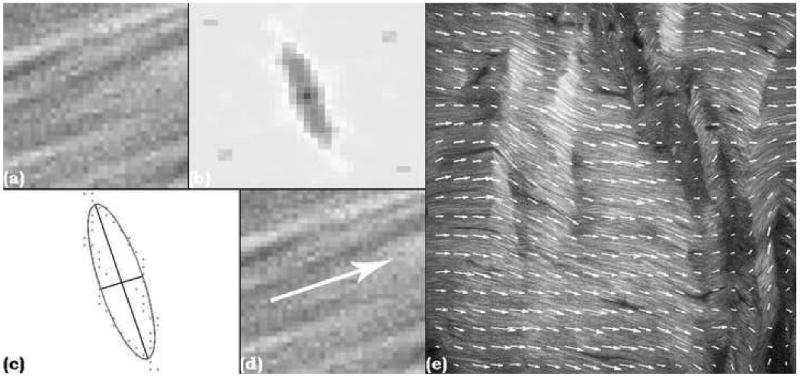
Sample window (a), FFT-ps (b), filtered FFT-ps with best fit ellipse and semi-major and semi-minor axes superimposed (c), arrow representing fit window FO (d), and entire image with FO arrows superimposed (e).
ranging from 0 (as the fit approaches a circle, low confidence) to infinity (as the fit approaches a line, high confidence). Additionally, an interpolated FO was calculated for each window by averaging the FOs of the adjacent windows, weighted by their respective CIs. The CI of the interpolated FO was set equal to the average of the adjacent CIs. Finally, whichever FO had a higher CI, the fit FO or the interpolated FO, was assigned to the window.
Once the FO of each window was determined, the angle differences between each window and the windows to the left and right were calculated. Each pair of windows whose angle difference was greater than a predefined threshold was defined, for the purposes of this technique, as damaged (Fig. 3), and the image's DAF was calculated.
Fig. 3.
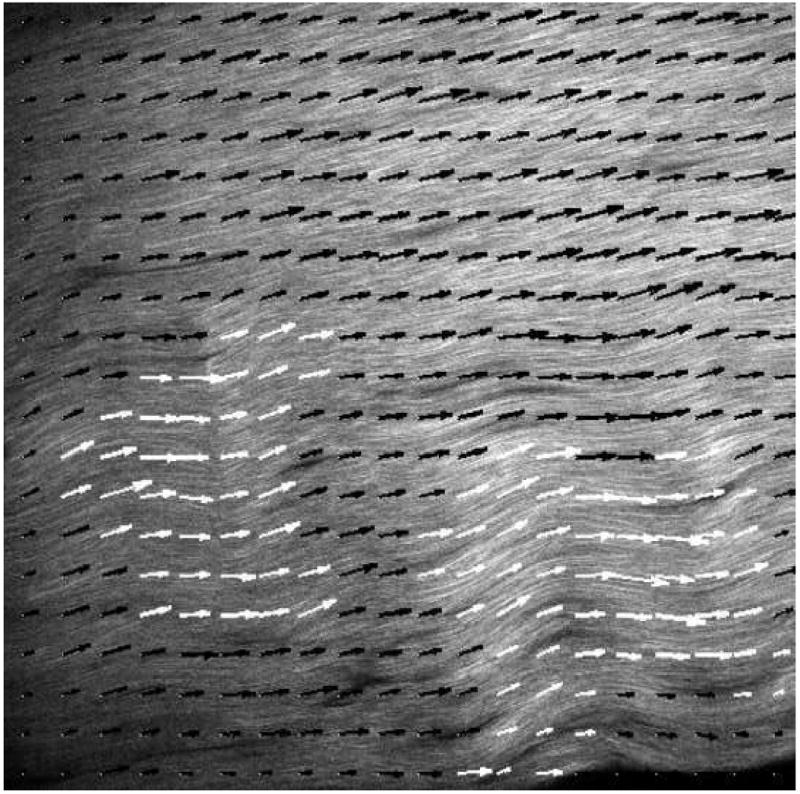
The FO of every window is compared to the FOs of the windows to the left and right, and if the angle difference is greater than a predefined damage threshold, both windows are defined as damage (white arrows), otherwise windows are defined as non-damaged (black arrows).
2.4 Optimization of the automated damage quantification method
Using 10° as an initial damage threshold, automatic damage quantification was performed using a range of window sizes to determine which was most appropriate as an initial value. The 57 images analyzed using the automated method were then also analyzed manually, using the protocol described above. Correlations were performed between the automatic and manual DAFs, holding the window size constant and varying the damage threshold, measuring the R2 value and choosing the damage threshold value that maximized that output. Using the optimized damage threshold, the window size was once again varied to identify the most appropriate value. These two calculations were sequentially repeated until the optimal damage threshold and window size pair were found. (Fig. 4).
Fig. 4.

The damage threshold was initially set at 10°, and the DAF was calculated as a function of window size (a). The smallest window size in the linear region of the DAF curve was chosen, to maximize resolution. The window size was then held constant at that value as automatic DAFs were correlated with manual DAFs, measuring the R2 value (b). This process was repeated until the optimal set values for each variable were found, where the optimal value for each variable is found by varying either variable with the other held constant. The optimal set of values found were window size = 51×51 pixels and damage threshold = 5°.
2.5 Co-localization of automated and manual damage measurements
The images were re-analyzed manually at the optimal window size, and the manual and automatic methods were compared, quantifying the number of windows of agreement (both methods reporting damage or both reporting non-damage). The percent agreement was statistically analyzed using a chi-square goodness-of-fit test, the observed count being the number of windows of agreement, and expected count being calculated independently for each image as a function of the previously calculated manual and automatic DAFs.
3. Results
3.1 DAF as a function of fatigue damage
DAFs were manually determined to be 2.86±0.81% for control, 18.60±6.44% for low-, 52.70±14.68% for moderate-, and 68.86±13.37% for high-level fatigue. Significant differences were observed between Control and Moderate (p<0.01), Control and High (p<0.001), Low and Moderate (p<0.01), and Low and High (p<0.001) (Fig. 5). There were no significant differences between the user's repeated analyses (p>0.63).
Fig. 5.
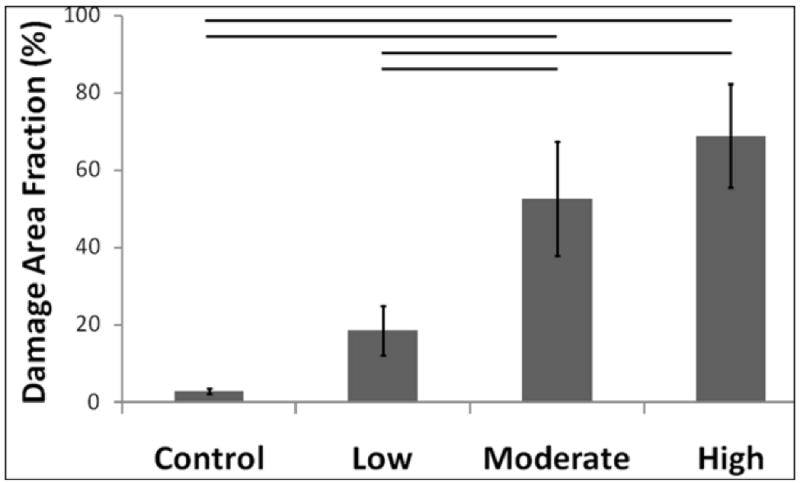
A dose-response relationship was observed between DAF and level of fatigue damage accumulated. Significant differences noted with horizontal bars.
3.2 Validation of automatic DAF quantification
All correlations performed were statistically significant (p<0.0001). A window size of 51×51 pixels and a damage threshold of 5° were determined to be optimal, yielding a best fit line of
and R2 =0.73 (Fig. 6). The automatic and manual determinations (damaged/non-damaged) co-localized 78.00±13.00% of the time (p<0.0001). When there was disagreement, automatic defined the window as damaged 48.25% of the time, and manual defined the window as damaged 51.75% of the time.
Fig. 6.
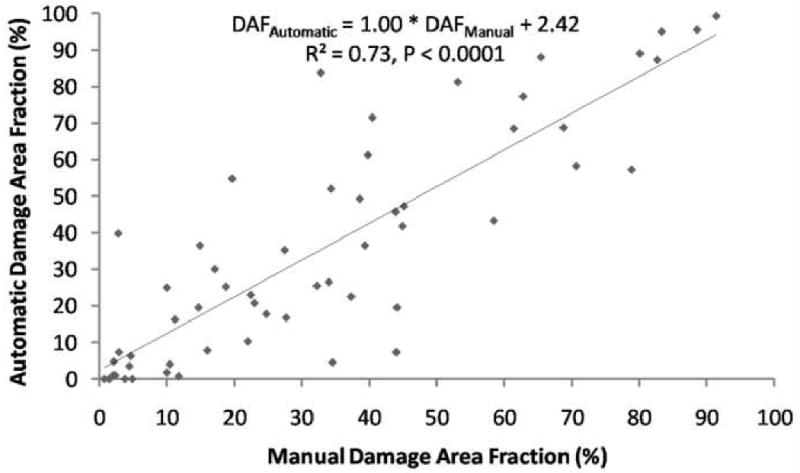
Optimized correlation of Automatic and Manual DAFs window size = 51×51 pixels and damage threshold = 5°.
4. Discussion
Our analysis revealed that quantifiable DAF has a dose-response relationship with fatigue damage accumulation. This finding suggests that as damage is accumulated, there is a cascade effect in which an increasing amount of tendon matrix becomes disorganized. Furthermore, this finding establishes a use for quantifiable matrix disorganization as a measure of fatigue/overuse damage accumulation by providing a scale that may allow DAF to be related to clinical conditions.
Manual DAF quantification is time-intensive, motivating the development of an automated method of quantifying DAF. This method, based on identifying and interpolating FO and assessing each window in relation to adjacent windows parallels the method by which one assesses an image by eye; identifying matrix disruption relative to surrounding tissue. This represents an improvement over our previously published automated damage quantification method, in which global criteria were used to assess damage, because it was found that the global criteria, against which each window was measured, were themselves significantly affected by damage accumulation (Fung et al, 2010). Furthermore, discrepancies in definitions of damage, either for one user between analyses or between users, result in inter- and intra-user variability. This variability is eliminated in the automatic method by using user set variables to define how damage is identified.
Given our technique's potential to be coupled with non-destructive clinical imaging modalities, such as MRI (Tsoref et al., 1998), similar tests may be developed in the future to diagnose and grade sub-clinical tendon pathology. Furthermore, given the ability of this technique to identify fiber orientation and assess damage using customizable window size and damage threshold, this technique may be optimized for applications outside of tendon.
Acknowledgments
We acknowledge Brooke E. Rosenbaum for her contributions. This study was supported by NIH grants GM007280 (JBS) and AR052743 (ELF). Microscopy was performed at the MSSM-Microscopy Shared-Resource-Facility, supported with funding from NIH-NCI (CA095823), NSF (DBI-9724504), and NIH (RR09145).
Footnotes
Below is the list of any conflicts of interest for the authors, their immediate families, and any research foundation with which they are affiliated, including receiving royalties, stock or stock options, consultant agreements, or ownership from or with any commercial entity related to the subject of this work.
- Jedd B Sereysky: This author, their immediate family, and any research foundation with which they are affiliated did not receive any financial payments or other benefits from any commercial entity related to the subject of this article.
- Nelly Andarawis-Puri: This author, their immediate family, and any research foundation with which they are affiliated did not receive any financial payments or other benefits from any commercial entity related to the subject of this article.
- Stephen J. Ros: This author, their immediate family, and any research foundation with which they are affiliated did not receive any financial payments or other benefits from any commercial entity related to the subject of this article.
- Karl J. Jepsen: This author, their immediate family, and any research foundation with which they are affiliated did not receive any financial payments or other benefits from any commercial entity related to the subject of this article.
- Evan L. Flatow: This author, their immediate family, and any research foundation with which they are affiliated did not receive any financial payments or other benefits from any commercial entity related to the subject of this article.
Publisher's Disclaimer: This is a PDF file of an unedited manuscript that has been accepted for publication. As a service to our customers we are providing this early version of the manuscript. The manuscript will undergo copyediting, typesetting, and review of the resulting proof before it is published in its final citable form. Please note that during the production process errors may be discovered which could affect the content, and all legal disclaimers that apply to the journal pertain.
References
- Alastrue V, Rodriguez JF, Calvo B, Doblare M. Structural damage models for fibrous biological soft tissues. Int J Solids Struct. 2007;44:5894–5911. [Google Scholar]
- Ciarletta P, Ben Amar M. A finite dissipative theory of temporary interfibrillar bridges in the extra-cellular matrix of ligaments and tendons. J R Soc Interface. 2009;6:909–924. doi: 10.1098/rsif.2008.0487. [DOI] [PMC free article] [PubMed] [Google Scholar]
- Fung DT, Sereysky JB, Basta-Pljakic J, Laudier DM, Huq R, Jepsen KJ, Schaffler MB, Flatow EL. Second harmonic generation imaging and fourier transform spectral analysis reveal damage in fatigue-loaded tendons. Ann Biomed Eng. 38:1741–51. doi: 10.1007/s10439-010-9976-7. [DOI] [PMC free article] [PubMed] [Google Scholar]
- Fung DT, Wang VM, Andarawis-Puri N, Basta-Pljakic J, Li Y, Laudier DM, Sun HB, Jepsen KJ, Schaffler MB, Flatow EL. Early response to tendon fatigue damage accumulation in a novel in vivo model. J Biomech. 2009 doi: 10.1016/j.jbiomech.2009.08.039. [DOI] [PMC free article] [PubMed] [Google Scholar]
- Fung DT, Wang VM, Laudier DM, Shine JH, Basta-Pljakic J, Jepsen KJ, Schaffler MB, Flatow EL. Subrupture tendon fatigue damage. J Orthop Res. 2008 doi: 10.1002/jor.20722. [DOI] [PMC free article] [PubMed] [Google Scholar]
- Kannus P, Jozsa L. Histopathological changes preceding spontaneous rupture of a tendon. A controlled study of 891 patients. J Bone Joint Surg Am. 1991;73:1507–25. [PubMed] [Google Scholar]
- Kastelic J, Baer E. Deformation in tendon collagen. Symp Soc Exp Biol. 1980;34:397–435. [PubMed] [Google Scholar]
- Natali AN, Pavan PG, Carniel EL, Lucisano ME, Taglialavoro G. Anisotropic elasto-damage consitutive model for the biomechanical analysis of tendons. Med Eng Phys. 2005;27:209–214. doi: 10.1016/j.medengphy.2004.10.011. [DOI] [PubMed] [Google Scholar]
- Rasband WS. U. S. National Institutes of Health; Bethesda, Maryland, USA: 1997-2010. ImageJ. http://rsb.info.nih.gov/ij/ [Google Scholar]
- Sonnabend DH, Yu Y, Howlett CR, Harper GD, Walsh WR. Laminated tears of the human rotator cuff: a histologic and immunochemical study. J Shoulder Elbow Surg. 2001;10:109–15. doi: 10.1067/mse.2001.112882. [DOI] [PubMed] [Google Scholar]
- Tsoref L, Shinar H, Seo Y, Eliav U, Navon G. Proton double-quantum filtered MRI--a new method for imaging ordered tissues. Magn Reson Med. 1998;40:720–6. doi: 10.1002/mrm.1910400512. [DOI] [PubMed] [Google Scholar]


