Abstract
Filamentous M13 phage can be engineered to display cancer cell-targeting or tumor-homing peptides through phage display. It would be highly desirable if the tumor targeting phage can also carry anti-cancer drugs to deliver them to the cancer cells. We studied the evolution of structures of the complexes between anionic filamentous M13 phage and cationic serum-stable liposomes which encapsulate the monomeric photosensitizer, zinc naphthalocyanine. At specific phage-liposome ratios, multiple phage nanofibers and liposomes are interwoven into a “nanoweb”. The chemical and biological properties of the phage-liposome nanoweb were evaluated for possible application in drug delivery. This study highlights the ability of phageliposome nanowebs to serve as efficient carriers to transport photosensitizers to cancer cells.
Keywords: Phage, liposome, photosensitizer, photodynamic therapy
Introduction
The use of liposomes for drug delivery across cell membranes is ubiquitous owing to their biocompatibility, ability to protect encapsulant, and improve circulatory half-life and release profiles (1-3). Compared to other cancer therapies, photomedicine, which comprises photothermal therapy (PTT) and photodynamic therapy (PDT), has many advantages including lack of toxic side effects or disfigurement (3). Developments in diode lasers and optical fibers have opened up PTT and PDT as emerging cancer treatment methods. While PTT relies upon the ability of electromagnetic radiation to treat cancer cells, PDT takes advantage of the interaction of light with drug (in this case, the photosensitizer) to initiate apoptosis or necrosis of cancer cells and destroy the tumor (1, 4). In PDT, cytotoxic reactions are initiated by reactive oxygen species generated due to transfer of triplet state energy from photosensitizer to nearby oxygen molecules present when activated by light (5). Effect of PDT is dependent upon the ability of photosensitizer to bring about photooxidation of biological matter by type I (radical formation through photosensitized electron transfer) or type II (formation of singlet oxygen) mechanism. One of the most promising photosensitizers used in PDT is zinc naphthalocyanine (ZnNC), which has improved properties such as increased tissue penetration arising from strong absorbance at long wavelengths (700-1000 nm) (6-9). 2,3 Naphthlocyanine has been reported to bring about photo necrosis or random necrosis, with direct photodamage to the membrane, mitochondria and rough endoplasmic reticulum in the neoplastic cells and delayed photedestruction of the endothelial cells surrounding the tumor tissue (10-12). Its phototoxicity is enhanced due to the relatively long lived excited singlet and triplet states in high quantum yields and there is nearly 100% increase in singlet oxygen efficiency (13). However, ZnNC, like most photosensitizers used in PDT, is insoluble in water and tends to aggregate in biologically compatible solvents, which further reduces photosensitizing efficiency and causes low tumor selectivity (14-15). The insolubility and aggregation of the drugs can be overcome by encapsulating them inside liposomes (16). In liposomal media, energy transfer as well as singlet oxygen formation (type I and type II mechanism) has been found to occur efficiently (17). However, liposomal structure may be disrupted by serum proteins and biological membranes, resulting in the non-specific release of photosensitizer into bloodstream (14, 16). This drawback as well as the inability to deliver drugs to target sites can be overcome by way of chemical or physical modification (18). Chemical methods include surface coating with PEG chains (19) and ligands like antibodies (20), peptides (2), sterol-modification(21) or small molecules (22). However, incorporating targeting motifs into liposomes has been shown to result in increased leakage of encapsulated drugs (23-24).
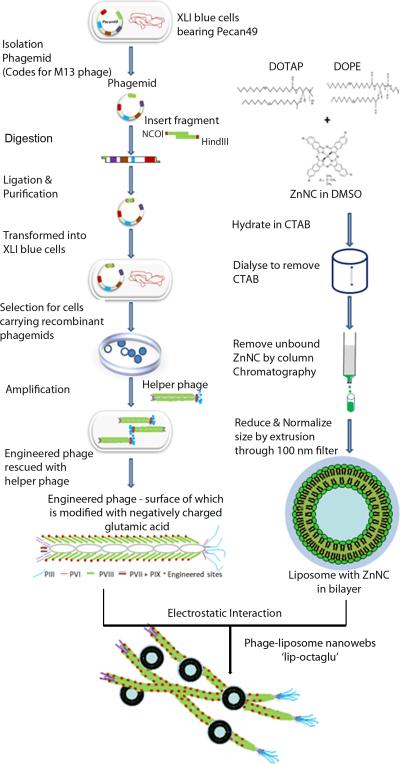
Here we demonstrate a new drug delivery system where cationic liposomes (which encapsulate ZnNC), and filamentous M13 phage (which can co-display anionic peptides and cell or tissue-specific peptides, Scheme S1), are electrostatically assembled into a web-like nanostructure (Fig. 1). M13 phage has attracted worldwide attention in medical and materials research (25). It has the potential for gene transfer, drug and vaccine delivery due to its plasticity, low cost, stability and safety (26-28). It is a rod-like virus (~880 nm long and ~7 nm wide) that specifically infects bacteria and is non-toxic to humans. Its side wall is assembled from ~2700 copies of a major coat protein called pVIII whereas a few copies of minor coat proteins (e.g., pIII) form the two distal ends of the phage (Scheme S1). Because the coat protein is encoded by the DNA encapsulated inside the protein coat, foreign peptides can be displayed on the tip and/or side wall of the phage by genetic means (25, 29-31). In this work we displayed an anionic peptide with a sequence of Glu8 on the side wall of phage to make it anionic (Scheme S1) and encapsulated ZnNC in the hydrophobic region of the lipid bilayers of cationic liposomes. Thus the anionic phage can electrostatically interact with cationic liposomes to form a novel nanoweb (Figure 1) for targeted drug delivery via PDT since target-specific peptides can be co-displayed on phage.
Fig. 1.
Filamentous phage, which are genetically engineered to display an anionic peptide on the side wall, are mixed with cationic liposomes that encapsulate ZnNc. As a result, a complex is formed where phage and liposomes are interwoven into a nanoweb (not to scale).
Materials and Methods
Chemicals/Materials
3-(4,5-dimethylthiazol-2yl)-2,5-diphenyl tetrazolium bromide (MTT), chloramphenicol, dimethyl sulfoxide (DMSO), hexadecyltrimethylammonium bromide (CTAB), isopropyl β-D-1thiogalacto pyranoside (IPTG), kanamycin, Luria-Bertani (LB) broth, N-(3-Dimethylaminopropyl)-N′-ethyl carbodiimide hydrochloride (DEC), phosphotungstic acid, poly ethylene glycol (PEG), rhodamine B, sodium chloride (NaCl), tetracyclin, trehalose, Tris, Zinc 2,11,20,29-tetra-tert-butyl-2,3-naphthalocyanine (ZnNC) and other minor chemicals were sourced from M/s. Sigma-Aldrich, USA and used without purification. 1,2-di-(9Z-octadecenoyl)-sn-glycero-3-phosphoethanolamine (DOPE), 1,2-di-(9Z-octadecenoyl)-3-trimethylammonium-propane (chloride salt) (DOTAP) and 1,2-dioleoyl-sn-glycero-3-phosphoethanolamine-N-(carboxy fluoresce-in) (ammonium salt) (DOPE-CF), all in chloroform were sourced from Avanti Polar Lipids Inc. USA and used as received. DMEM, McCoy's 5a modified medium and other cell culture requirements were sourced from American Type Culture Collection (ATCC). KSFM was sourced from Invitrogen, USA.
Display of E8 Peptide on Major Coat Protein, pVIII (i.e. side wall) of M13 Phage
Molecular cloning technique employed in this work was performed as described in literature (32). Phage display technique was used to fuse eight glutamic acid residues (E8) to the N-terminus of the major coat protein of M13 bacteriophage. By using E. coli XL 1 blue bacteria and pecan49 as a phagemid, the GLU-pecan49 was constructed. For this pecan49 was digested with NcoI and HindIII restriction endonucleases and ligated with similarly digested GLU-g8p PCR product which was amplified by PCR of M13K07. The primers employed were 5’ATCCATGGCGGAAGAAGAAGAAGAAGAAGAAGAAGATCCCGCAAAAGCG3’ (NcoI restriction site is underlined) 5’GCAAGCTTTTATCAGCTTGCTTTCGAG3’ (HindIII restriction site is underlined).
Briefly, the PCR products were purified using QIAgen PCR product purification kit (QIAgen Inc. USA) according to the described procedures in the kit. The purified DNA was digested and the DNA fragments were loaded into 1% agarose gel and isolated by electrophoresis in 0.5xTBE buffer. The digested fragment was than extracted from the agarose gel using QIAgen gel DNA extraction kit. The ligation reaction was carried out at 25°C for 2 h using T4 ligase. DNA was then transfected into competent E. coli TG1 cells by CaCl2 method. 100 μL of transfected bacteria was spread onto agar plate containing 30 ug/mL chloramphenicol and 2% glucose . A well separated clone from the plate was inoculated into 3 mL LB broth (plus 2% glucose) and incubated at 250 rpm at 37°C overnight. The recombinant phagemid DNA was isolated using QIAgen miniprep plasmid extraction kit according to the manufacturer's protocols. To analyze the recombinant phagemid DNA, the phagemid DNA was digested with both NcoI and HindIII restriction enzymes. The digested products were analyzed by electrophoresis in agarose gel and observed under UV light. The correctly inserted fragments were verified by DNA sequencing (carried out MCLAB USA). To realize display of E8 on the major coat of M13 phage, 0.5 μL recombinant phagemid DNA was transfected into competent host strain XL1 blue E. coli by CaCl2 method. The transfected bacteria were spread on a agar plate containing 20 μgmL-1 tetracycline and 35 μgmL-1 chloramphenicol. Then a well spread clone from the plate was inoculated into 3 mL LB medium containing the appropriate antibiotics. The culture was incubated in the tube for 4-6 h at 37 °C with moderate shaking. 1.2×10¹⁰ pfu M13KO7 virions were added to the tube and the tube continued to be incubated for 30 min at 37 °C. The mixture in the tube was transferred to 150 mL of LB medium containing appropriate antibiotics. Kanamycin was added to reach a final concentration of 70 μgmL-1 and IPTG was added to a final concentration of 0.1 mM. The mixture was incubated overnight at 37°C with vigorous shaking.
Engineered Phage Purification
The overnight culture was first centrifuged at 2400g for 10 min at 4°C using Beckman Coulter™ high performance centrifuge, and the supernatant was collected and re-centrifuged at 6,700g for 10 min at 4 °C. Then 1/5th volume PEG/NaCl solution was added and the suspension stored in a refrigerator overnight. Phage precipitates were collected by centrifugation at 10,100g for 60 min at 4°C, dissolved in TBS and centrifuged at 10,100g for 10 min until clear. The engineered phage was than examined under transmission electron microscope and its concentration determined spectrophotometrically (Shimadzu UV2101 PC), by measuring the absorbance at 269 nm.
Preparation of ZnNC Encapsulated Liposomes
The liposome was made from a cationic lipid DOTAP (N-(1-2,3-dioleoyloxy) propyl)-N,N,N-trimethylammonium chloride) and a helper lipid DOPE (1,2-dioleoyl-sn-glycero-3-phosphoethanolamine) in a molar ratio of 30:70. A stock solution of ZnNC, was prepared in DMSO such that the effective concentration was 6mM. The two lipids DOPE (1 g/50 mL) and DOTAP (1 mg/4 mL) were procured as chloroform solutions and used as such without purification. The two lipids were mixed in a mole ratio of 70:30 such the total mole weight of the lipids was 4.10 ×10⁻³ g. 600 μL of ZnNC in DMSO was added to the lipid mixture, shaken well and the chloroform removed under nitrogen atmosphere in a narrow glass beaker and desiccated under vacuum for 6 h. Hydration was performed using three parts of CTAB for every part of lipid. CTAB stock solution was prepared in a phosphate buffered saline (10 mM NaH2PO4, pH 7.0, 100 mM NaCl). After addition of CTAB the contents of the flask was vortexed for 3 min, allowed to hydrate for about 30 min and finally sonicated to obtain a clear solution. The solution was then subjected to extensive dialysis (dialysis bag MWCO 6-8000) against phosphate buffer to remove most of the excess CTAB. The dialysed vesicle suspension was eluted through a Sephadex G-50 column to remove unbound ZnNC, lipids and surfactant, with phosphate buffer as solvent. The formed multilamellar vesicles was then extruded through a 100 nm diameter polycarbonate membrane for 21 times to form small unilamellar vesicles. The final suspension (25 mL) was in phosphate buffer and stored under dark at 4°C. Residual chloroform was analyzed by using gas chromatography.
Preparation of Phage-Liposome Complexes
The concentration of phage employed in this study was spectrophotometrically determined as per reported procedures (33). Liposomes having known lipid concentration was mixed with varying quantities of engineered phage and made up to 3 mL in phosphate buffer such that the lipid to engineered phage (L/P) weight ratio varied from 2 to 40, for a lipid concentration of 4.92×10⁻⁵ g (1.65 × 10⁻¹¹ M) and engineered phage concentration varying from 0 – 30 × 10-11 M. After an initial mixing of the solution by vortexing for 30 sec, the mixture was allowed to stand for 30 min in room temperature for the self assembly of liposomes on to the engineered phage. Subsequently, the phage-liposome complexes were stored under dark at 4°C for characterization.
Determination of Concentration of ZnNC in Liposomes and Phage-Liposome Complex
The amount of ZnNC encapsulated was determined spectrophotometerically after disruption of the liposomes in absolute ethanol. The absorbance of the sample after appropriate dilution in DMSO was measured at 769 nm and employing an extinction coefficient of 1.08×10⁵ M-1cm-1 (as determined from a standard plot constructed using various concentrations of ZnNC in DMSO). The monomeric nature of ZnNC was confirmed by comparing the UV-Vis spectral characteristics of ZnNC in DMSO, liposome and phage-liposome complex.
Charge of Liposomes and Phage-Liposome Complexes
Zeta potential of the liposome and phage-liposome complex was measured using Zetapals (Brookhaven Instruments Corporation, USA) and employing the Hemholtz-Smoluchowski equation.
Size and Morphology of the Liposomes and Phage-Liposome Complexes
Size distribution was measured using dynamic light scattering using a particle sizer (Zetapals, Brookhaven Instruments Corporation, USA). The morphology of the liposomes, engineered phage and phage-liposome complexes was evaluated under a transmission electron microscope. For this, 10 μL of the sample was mixed with equal quantity of a negative stain (comprising of 5% phosphotungstic acid and 2.5% trehalose at pH 7.3) on a parafilm and the resultant solution was dropped onto a formvar coated 400 mesh copper grid. After 5 min the leftover solution was wicked away and the negatively stained sample allowed to dry under natural conditions. For the phage-liposome complexes, the samples were examined within 2 h of the preparation of the complex. The grids were examined under JEOL 2000-FX Intermediate Voltage (200,000 volt) Scanning Transmission Electron Microscope.
Fluorescence Spectroscopic Studies
In order to estimate binding constant for liposomes to the engineered phage, UV-Vis and fluorescence spectroscopic studies were carried out by maintaining liposome concentration constant (1.65 × 10⁻¹¹ M of total lipid) and varying the engineered phage concentration from 0 to 30×10-11 M. The fluorescence spectra of the ZnNC encapsulated liposome and phage-liposome complexes were obtained on Shimadu RF5301 PC fluorescence spectrophotometer. The excitation wavelength employed was 680 nm and the emission was monitored from 700 to 900 nm, keeping the excitation and emission slit widths as 3.0 nm. The fluorescence quantum yields of ZnNC in liposome and phage-liposome complexes (L/P=2.2) were measured using the ratio method described by Eaton equation (34-35), utilizing ZnNC in DMSO as a standard (φFStandard = 0.07) (36).
| (1) |
Where Fsample and FStandard are the fluorescence intensity of the sample and standard respectively, ASample and AStandard are the absorbance of sample and standard respectively, ηSample and ηStandard the dielectric constant of the solvents employed for preparation of sample and standard respectively.
A spectroscopic titration technique was used to determine the binding constant (Kb) of liposome to the engineered phage as per reported procedures (37). Briefly, the fluorescence intensity of the ZnNC in the liposome was monitored as a function of the concentration of the added phage, exactly after 60 min of incubation of the liposome with phage. Intensity of fluorescence was found to increase with increasing concentration of the phage in all the concentrations investigated in this study. The increase fulfills the expression
| (2) |
Where F is the fluorescence intensity for a given phage concentration, F0 and F∞ are the relative fluorescence intensities of the ZnNC-liposome alone and liposome saturated with phage respectively. The binding constant Kb is obtained by plotting log[(Fo-F)/(F-F∞)] versus log[phage]. The slope of the double-logarithm plot obtained from experimental data is the number equivalent binding capacity (n), whereas the value of log[phage] at log[(Fo-F)/(F-F∞)] = 0 equals the logarithm of the dissociation constant (Kdiss). The reciprocal of Kdiss is the binding constant Kb. The fluorescence intensity values were obtained from the area under the fluorescence spectra, in the range of our investigation (700-900 nm). The quenching of the fluorescence emission by ZnNC incorporated into liposomes in the presence and absence of bacteriophages was studied using methyl viologen as quencher. ZnNC-liposome solution (5.0 μM) in the absence/presence of bacteriophages (L/P = 2.2) was excited at 680 nm and their fluorescence emission was recorded in the range of 700-900 nm. The fluorescence quenching data obtained were analyzed by Stern-Volmer formalism (15).
| (3) |
Where [MV2+] is the concentration of the quencher (methyl viologen), F0 is the fluorescence intensity at [MV2+] = 0, F the fluorescence intensity at a given quencher concentration [MV2+] and KSV the Stern-Volmer quenching constant.
Effect of Blood Plasma on Liposome Stability
Liposome fractions containing 6-carboxyfluorescein (0.3 mL containing 3 mg total lipid) were mixed with 0.3 mL blood plasma (Innovative Research, Inc.) and incubated for 3 h at 37°C. Aliquots were diluted 500 times and the fluorescence (λex = 492 nm and λem = 518 nm) measured before and after liposome lysis by the addition of 100 μL 10% (w/v) Triton X-100. Percentage of encapsulated CF was calculated from the expression (38). The experiments were repeated in triplicates.
| (4) |
Where Fi,and Ft are the fluorescence intensity of the diluted sample before and after lysis using triton X-100, and Fo is the fluorescence intensity of the same sample before incubation with blood plasma. The blood plasma stability for the phage-liposome complex (L/P = 6.7) was also estimated by the same procedure.
Cell Cultures
Breast cancer cell lines (SKBR-3) was obtained from American Type Cell Culture (ATCC) around December 2008. The viability of the cells has been tested and confirmed using Trypan blue dye exclusion tests. The cells were initially cultured in 25 cm2 flasks and on reaching 90% confluence, detached using trysin/EDTA and centrifuged at 2000 rpm for 5 min. The supernatant was removed and a pellet resuspended in 5 ml of Mc Coy's medium. Later a 100μl of the cell sample was taken and treated with trypan blue and the viability verified using hemocytometer. A human head and neck squamous cell carcinoma cell line (SCC-15) established and characterized by Rheinwald, was obtained from Cell Culture Core facility at BWH Dermatology/Harvard Skin Disease Research Center, Harvard Institutes of Medicine, USA in November 2008. The cells obtained were thawed, expanded, and cryopreserved in GIBCO K-sfm as per the protocols provided by the supplier. The cells were subsequently grown to ~1/3 confluence in GIBCO K-sfm medium and used for the experiments. The cells obtained from the suppliers were used within six months of procurement for the experiments in this study.
MTT Assay
An important prerequisite that a photosensitizer should have is the absence/low toxicity when not irradiated. Toxicity measurements were carried out on SKBR-3 (3.6 × 10³ cells) and SCC-15 (2.9 × 10³ cells) plated to 24–well plates and treated with 5 μM ZnNC encapsulated in liposomes, engineered phage and lip-octaglu carrying 5 μM ZnNC. Untreated cells served as control. Specific care was taken to carry out all experiments under dark conditions to avoid the influence of any stray light. After 6 h of incubation in dark, the percentage of viable cells in each sample was measured. For this, 0.5 mL 3-(4,5-dimethylthiazol-2yl)-2,5-diphenyltetrazolium bromide (MTT (0.5 mg/mL)) was added into each well and incubated for 3 h at 37°C. The MTT crystals formed on incubation were dissolved in 1 mL of HCl (0.04 M) in isopropyl alcohol. The absorbance of the samples were read at 595 nm and subtracted from a reference wavelength of 620 nm in a Shimadzu UV-Vis Spectrophotometer (Abssample). Similarly the absorbance of untreated cells were also measured (Abscontrol). Data were collected in triplicate. The dark toxicity/toxicity was calculated as follows (39):
| (5) |
Cellular Uptake
The cellular uptake of ZnNC by SKBR-3 cells and SCC-15 was determined based on the previous method (40). 5μM of ZnNC encapsulated liposomes and Lip-octglu containing 5 μM of ZnNC was used to study the amount of ZnNC taken up by cells over an incubation period of 12 h. To calculate intracellular ZnNC concentrations (Cintra) we used the concentration of ZnNC within cell suspensions of known cell densities and assumed a cellular volume of 2.3 × 10⁻⁹ mL. The concentration outside the cell was assumed to be the concentration of ZnNC in 3% PBS (Cextra). The ratio of these two values is indicative of ZnNC's tendency to be taken up by the cells.
Fluorescence Microscopy Studies
Fluorescent labeled bacteriophages and liposomes were prepared by reported procedures (41). Briefly, Rhodamine B labeling of engineered phages were performed by mixing 0.2 g of DEC, 1-[3-Dimethylamino)propyl]-3-ethylcarbodiimide hydrochloride coupling agent and 0.02 g of Rhodamine B in 25 mL of engineered phage stock solution in phosphate buffer (pH 5.6). This procedure results in permanent attachment of the dye through DEC assisted caging. The labeled phages were extensively dialyzed for 5 days under stirring to remove low molecular weight organic compounds and free dye molecules. The modified phages were stored at 4°C under dark. Carboxyfluorescein labeled liposomes were prepared by replacing 1% of DOPE with DOPE-CF in the preparation of liposomes. The labeled phage and liposomes were interacted in a similar manner as that of engineered phage and ZnNC-liposomes such that the L/P ratio was 6.7. Two sets of six well tissue culture plates carrying 25 mm cover slips were seeded with 3.5×10³ SKBR-3 and SCC-15 cells. After allowing 24 h for the cells to attach and spread on the cover slips, the unattached cells removed by washing with PBS (pH 7.4). The cells were then treated with culture medium containing 500 μl of CF-labeled liposomes and fluorescent lip-octaglu for 3 h. Treatment was terminated by washing with PBS three times and then fixed by incubating with 4% paraformaldehyde in PBS for 15 min, then washed with PBS several times. The cells were mounted on a microscope slide using gelvatol. The green fluorescence associated with CF associated cell cultures were examined using a blue filter and the red fluorescence of Rhodamine B examined using a green filter on a Zeiss Universal epiflourescence microscope with Olympus oil immersion DApo UV objectives. Digital images of cells were collected using Olympus DP-70 camera and software.
Photodynamic Therapy
At 30 min after the treatment of SKBR-3 cells (5×10³cells) with liposome-ZnNC or lipoctaglu, the cells were exposed to near IR radiation for 4 min. The external irradiation of the cells was performed through a fiber optic cable capable of delivering laser power at a fluence rate of 206 mW cm-2. The cells were incubated for 3 h following the irradiation. The percentage cell death was calculated using MTT assay as described above. Trypan blue exclusion studies were carried out by staining the cells with 0.4% trypan blue. Cell viability was observed under a light microscope.
Results and Discussion
Optical Properties of Phage-Liposome Complexes
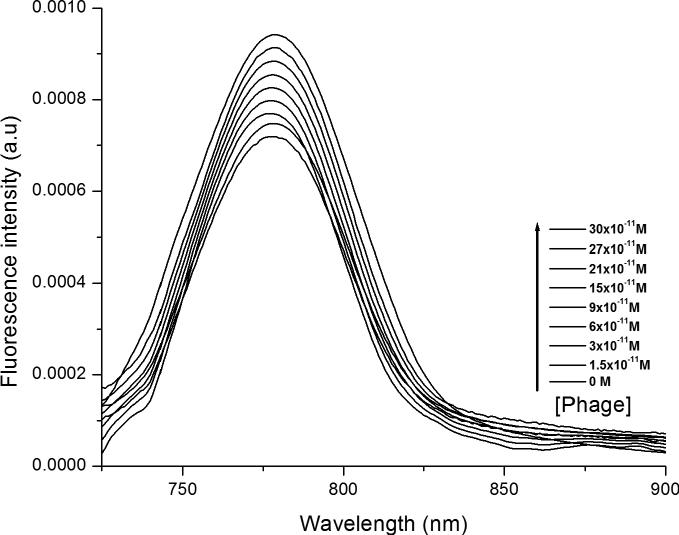
The entrapment of ZnNC in liposomes did not introduce any additional band in the spectra of ZnNC (Figure S1), indicating that the liposome environment did not exert influence on the electronic structure of ZnNC. In addition, the Soret band at 337 nm does not undergo any red shift or split (Figure S1), implying the absence of aggregation of ZnNC in liposomes (42). Residual chloroform was not detectable in the final liposomal composition. The percentage of encapsulation of ZnNC in liposomes was estimated to be 68.9% after disruption of the liposomes in absolute ethanol. The absorption spectra of liposomes and phage-liposome complexes (termed lip-octaglu) show that the formation of phage-liposome complex did not change the absorption spectra (Figure S1), indicating that ZnNC is not aggregated inside the bilayers of the liposomes. However, the fluorescence intensity of ZnNC is increased upon increasing phage concentration (Figure 2), indicating that the phage-liposome complex protects ZnNC from water molecules and molecular oxygen that may quench the fluorescence (43).
Figure 2.
Fluorescence spectra (λex = 680 nm) of ZnNC encapsulated liposomes on complexation with increasing concentration of engineered phages (0 – 30 × 10-11 M).
Quenching of ZnNC fluorescence by using methyl viologen (MV2+) was studied through steady state emission quenching experiments. Stern-Volmer plots (Figure 3) were constructed from relative integrated fluorescence intensity at 778 nm. ZnNC encapsulated liposomes, in the presence of MV2+ at 25°C, had no significant quenching. In liposomal systems, MV2+ is oriented co-planar to liposomal surface in order to maximize contact between polar and non-polar parts of quencher and liposome (44). Lower Stern-Volmer constant (KSV) value for MV2+ indicates the incorporation of ZnNC into the bilayer structure towards the inner part of the liposomal structure, which lowers the accessibility of MV2+ to ZnNC.
Figure 3.
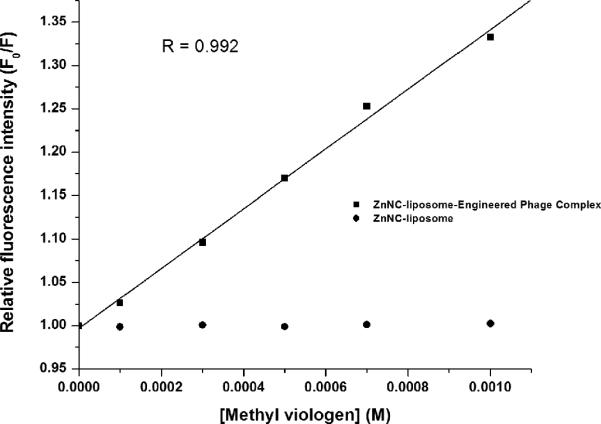
Stern-Volmer plots for the quenching of fluorescence of ZnNC encapsulated liposome and phageliposome complex. The integrated fluorescence intensity of liposome and complex with increasing concentration of methyl viologen (quencher) was measured (λex = 680 nm, λem = 700 – 900 nm) and the relative fluorescence intensity (Fo/F) was calculated from the fluorescence intensity at a given concentration of MV2+ (F) and absence of quencher (Fo). Stern-Volmer quenching constant is obtained from the slope of the plot, with intercept of 1.
Further electrostatic repulsion between cationic liposomes and divalent MV2+ reduces the accessibility of quencher to ZnNC. In the presence of engineered phage (L/P=2.2), both liposome and quencher are electrostatically immobilized on the phage surface, which may change the orientation of MV2+ from parallel to perpendicular to liposomal surface. KSV value of 350 M-1 observed in this study for phage-liposome system is similar to the case of ZnPC interacting perpendicularly with 9,10-anthraquinone-2,6-disulfonic acid (AQS-), through an electron transfer process (15). This observation suggests that engineered phage can serve as an efficient relay for electron transfer processes. Fluorescence quantum yield of the liposome entrapped ZnNC in the absence and presence of engineered phage (L/P=2.2) determined as per standard procedures (36) was found to be 0.072 and 0.076, respectively. An increase in the quantum yield of ZnNC due to the formation of phage-liposome complex can be attributed to radiationless relaxation and resonance energy transfer between engineered phage and ZnNC, making phage-liposome complex an ideal vehicle for phototherapeutics (45).
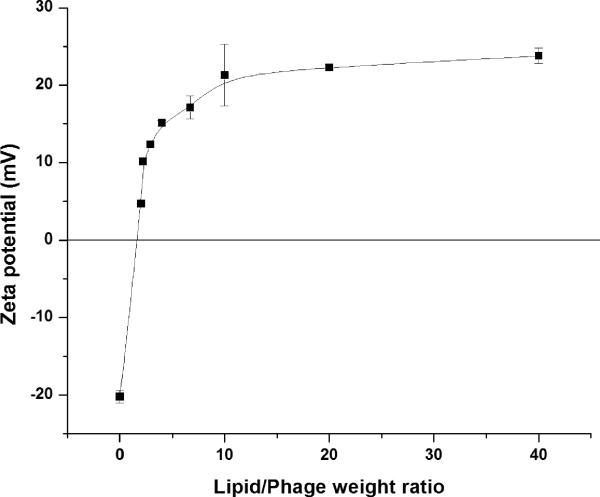
Binding constant for ZnNC-encapsulated liposomes onto phage, estimated by a spectroscopic titration technique (46), was found to be 1.1×10¹⁰ M-1, with number equivalent binding capacity being 1.48 (Figure S2). The binding constant is three orders of magnitude higher than that reported for hexa- and octaarginines onto anionic liposomes (47). When the weight ratio of the total lipid to the engineered phage (L/P value) was increased, the zeta potential of the phage-liposome mixture undergoes a change from negative, to zero and then to positive (Figure 4). The zeta potential change confirms that the anionic phage is being assembled with the cationic liposomes.
Figure 4.
Zeta Potential of the phage-liposome complex as a function of the weight ratio of lipid and phage (L/P). The complexes were made from stock solutions of 1.6×10⁻⁴ g/ml DOPE+DOTAP (70:30) and 5.46×10¹¹ viruses/ml engineered phage. The horizontal line indicates charge neutrality (ξ- potential = 0) at L/P = 1.63.
Microscopic Characterization of Phage-Liposome Complexes
The lipid bilayer thickness was estimated to be around 23 nm (Figure 5a’). When the phage (Figure 5b) is mixed with liposomes at a very low concentration (L/P=40), very few liposomes are bound to a single phage (Figure S3) due to the repulsion between cationic liposomes. At a higher phage concentration (L/P=10), more liposomes were found to bind to an individual phage (Figure 5c), similar to the “beads-on-rod” structure observed before (48-49). At L/P= 6.7, several linear beads-on-rod structures are entangled to form a nanoweb (Figure 5d). At an even higher phage concentration (L/P=2.9), short rings or spirals (Figure 5e) were found where phages wrapped liposomes. The formation of rings or spirals has been suggested in microtubule–liposome complexes owing to the mismatch of charge densities between microtubule and cationic liposomes (49), and in DNA-liposome system due to electrostatic interaction (43). When phage concentration is very high (L/P=2.0), phages self-assembled into a matrix with liposomes embedded (Figure 5f).
Figure 5.
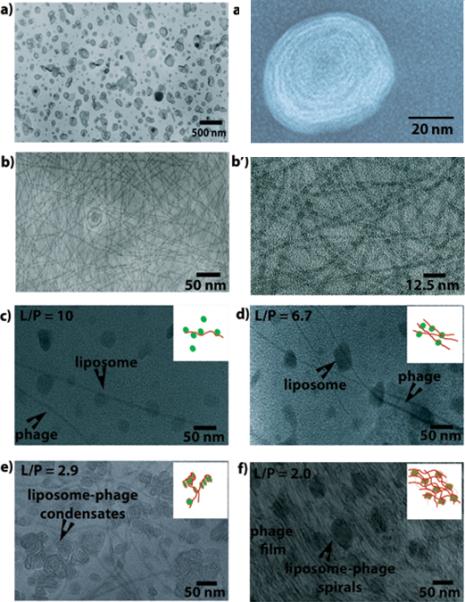
TEM images of the liposomes, engineered phages and phage-liposome complexes as a function of L/P values. (a) ZnNC-encapsulated liposomes. (a’) a high magnification view of an individual ZnNC-encapsulated liposome highlighting the bilayer of a single liposome. (b) Engineered phages. (b’) high magnification of phages. (c-f) phage-liposomes at different L/P ratios. The insets show the cartoons of the phage-liposome complex structures.
Plasma Stability of Phage-Liposome Nanowebs and Their Toxicity to Mammalian Cells
We entrapped carboxyfluorescein into phage-liposome nanowebs and measured their stability in the presence of plasma. Generally, plasma stability is measured in terms of percentage carboxyfluorescein that remains encapsulated within the liposome in the presence of plasma (38). We observed an 18.2% higher percentage carboxyfluorescein encapsulation when liposomes were complexed to phage than when liposomes are alone. The enhancement in plasma stability for nanowebs is probably due to the presence of phage, which functions in a similar manner to cholesterol in liposomes (50). Both liposome and nanoweb carriers of ZnNC did not show any dark toxicity within 6 h to breast cancer cell lines (SKBR-3) and squamous cell carcinoma (SCC-15) cell lines by MTT ((3-(4,5-Dimethylthiazol-2-yl)-2,5-diphenyltetrazolium bromide) assay for a ZnNC concentration of 5 μM (Figure 6). This could be attributed to the stability of liposomes and nanowebs as well as to shorter side chains in ZnNC (51). Therefore, the nanowebs formed at L/P=6.7 were found to be stable in serum and showed no dark cell toxicity.
Figure 6.
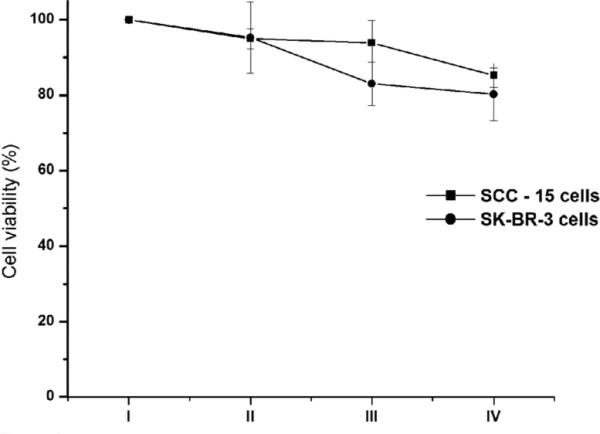
Percentage cell viability observed for a) Group I – untreated SKBR-3 and SCC-15 cell lines b) Group II – treated with 250 μl engineered phage (1.6×10¹¹ vir/ml), c) Group III – treated with 250 μl liposomes (1.8 × 10⁻¹⁰ M lipids) and d) Group IV – treated with 250 μl nanowebs (L/P = 6.7). The cell viability was measured using MTT assay, the standard errors calculated using SPSS 10.0. No significant change was observed by Students T-Test when Group II, Group III and Group IV were compared against Group I.
Internalization of phage-liposome nanowebs in cancer cells
PDT requires that photosensitizer be delivered as close as possible to targeted cells. Because electrostatic repulsion between negatively charged cell surface and anionic delivery vectors hinders cellular uptake, we chose to use phage-liposome nanowebs (L/P=6.7), which are cationic (Figure 4) and capable of carrying drug more effectively due to their web-like structure, to deliver ZnNC to two types of cancerous cell lines, viz., breast cancer cell lines (SKBR-3) and squamous cell carcinoma (SCC-15) cell lines. The cationic nanowebs can be attracted by the negatively charged plasma membrane to increase their uptake potential by the cancer cells. The ratio of ZnNC internalized into the cells through liposomes or nanowebs to that outside the cells (Cintra/Cextra) was determined by following a reported procedure (40). To calculate the intracellular ZnNC, the concentration of ZnNC that remained within the cell was determined. The extracellular ZnNC was determined from the difference between total ZnNC and that within the cell. It was found that the (Cintra/Cextra) was higher for nanowebs than for liposomes alone (8.19 and 5.13 for SCC-15 cell lines, respectively, and 6.13 and 3.95 for SKBR-3 cell lines, respectively). This fact suggests that the formation of nanowebs enhances the drug delivery into the cancer cells because liposomes are embedded in the web-like nanostructures.
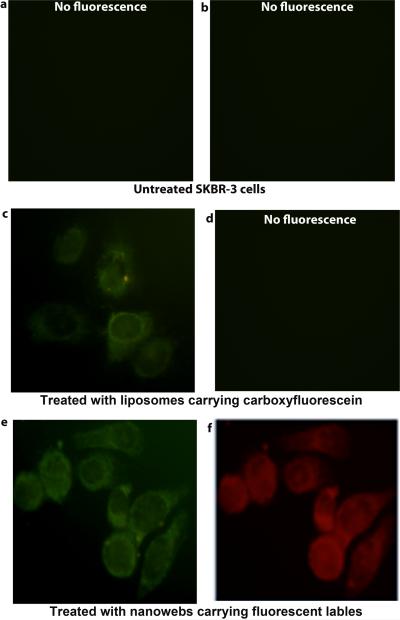
Cell internalization of phage-liposome nanowebs was demonstrated through fluorescence microscopy. For this experiment, ZnNC in the bilayer of liposome was replaced by a green dye, carboxyfluorescein, to fluorescently label the liposomes, because ZnNC fluorescence is in the near IR region and invisible. Engineered phage was fluorescently labeled by a red dye, rhodamine-B, through carbodiimide coupling and the unbound dye was removed by dialysis (41). Fluorescently tagged liposomes were complexed with rhodamine tagged phages to form nanowebs (L/P= 6.7). After the nanowebs were incubated with SKBR-3 cells for 3 h, the fluorescence images (Figure 7) show that the red and green fluorescence arise from the same regions within the cells, suggesting that the nanowebs containing both dye-labeled liposomes and phages are now associated with the same cells. Similar observations were made in the case of SCC-15 cells as well (Figure S4).
Figure 7.
Fluorescence microscopic images of treated and untreated SKBR-3 cells. (a) and (b) Untreated cells with no fluorescence. (c-d) Cells treated with liposomes, with green fluorescence from carboxyfluorescein tag present in the liposomes (c) and with no fluorescence observed due to absence of phage (d). (e-f) Cells treated with nanowebs, with green fluorescence from carboxyfluorescein tagged liposomes (e) and with red fluorescence from the rhodamine-B tagged phages (f) present in the nanowebs. Left column (a, c, d) and right column (b,d,e) are observed under blue and green filters, respectively.
Photodynamic destruction of cancer cells by phage-liposome complexes
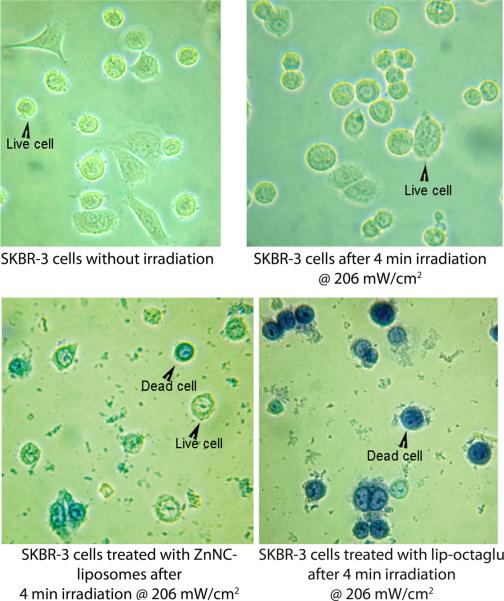
The ability of the nanowebs to function as an efficient photosensitizer carrier was further demonstrated by PDT studies on SKBR-3 cells. Cells were treated with ZnNC-encapsulated liposomes and nanowebs separately and irradiated with a near IR light at a fluence rate of 206 mW cm-2 for a period of 4 min. An increase in cell death by 20% was observed in the case of nanoweb-treated cells when compared to liposome-treated cells (Figure 8), indicating that the nanowebs can deliver more drugs into the cells than the liposomes alone. Further evidence showing the increased cell death on treatment with nanowebs was obtained from trypan-blue exclusion studies (Figure 9).
Figure 8.
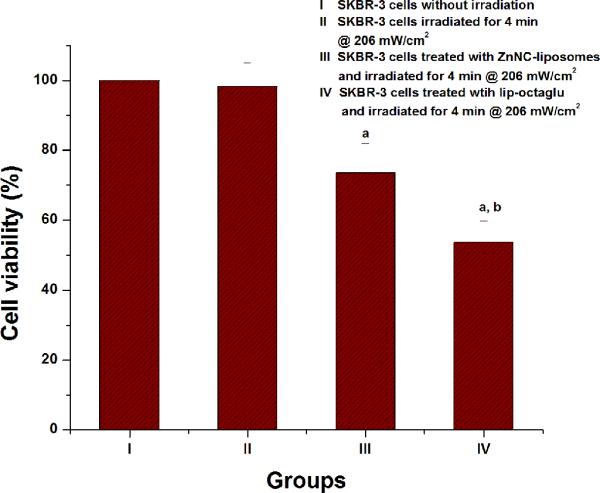
% cell viability observed for a) Group I – SKBR-3 cells without irradiation b) Group II – SKBR-3 cells with irradiation for 4 min @ 206 mW/cm2, c) Group III – treated with 250 μl ZnNC- liposomes (1.6×10⁻⁴ g/ml (1.8 × 10⁻¹⁰ M) lipids) and d) Group IV – 250 μl nanowebs (e.g., lip-octaglu at L/P = 6.7). The cell viability was measured using MTT assay, the standard errors calculated using SPSS 10.0. a,bP<0.05 was observed by Students T-Test where a indicates: Group I was compared with Group III and Group IV and b indicates: when Group III was compared with Group IV.
Figure 9.
Light microscopy images of SKBR-3 cells treated with and without ZnNC-liposome and nanowebs (i.e., lip-octaglu at L/P=6.7) before and after irradiation with near infrared light at a fluence rate of 206 mW/cm2 for a period of 4 min. The cells were treated with 0.4% trypan blue after 3 h of incubation. While live cells exclude trypan blue, the dead cells take up trypan blue.
The study highlights the ability of phage-liposome nanowebs to serve as a more efficient vehicle than liposomes alone to transport photosensitizers to target cells. It is expected that the cell-delivery efficiency will be further enhanced if the tips or side walls of the phage in the nanowebs are engineered to co-display cell-targeting peptides, which we have selected by phage display technique recently (not shown here). This work is now underway.
In summary, we have studied the morphological evolution of phage-liposome complexes and evaluated their chemical and biological properties for possible applications in drug delivery. Because phages can be engineered to co-display cancer-targeting peptides at the tip (by fusion to pIII) and liposome-binding peptides on the side wall (by fusion to pVIII, Scheme S1) and anti-cancer drugs can be loaded into liposomes, the phage-liposome nanowebs assembled from such cancer-targeting phage and anti-cancer liposomes will serve as novel carriers that can specifically target the anti-cancer drugs to the tumors (Figure S5).
Supplementary Material
Acknowledgements
We thank the financial support from Department of Defense Congressionally Directed Medical Research Program, National Science Foundation, SFBR internal funds, NIH C06RR12087, and the Oklahoma Center for the Advancement of Science and Technology (HR06-161S). We also thank Mr Greg Strout (TEM), Dr Kenneth Dormer (Zeta potential), Prof. B. Safiegko-Mroczka (Fluorescence microscopy), and Prof. Paul F Cook (Fluorescence spectroscopy) for extending the facilities and Dr. Pascaline Ngweniform for help during the early stage of this study. KJS thanks Dept. of Science and Technology, Govt. of India for the BOYSCAST fellowship.
Financial support: NIH C06RR12087 (Hayhurst), NIH 1R21EB009909-01A1 (Mao)
Abbreviation list
- PDT
photodynamic therapy
- ZnNC
zinc naphthalocyanine
- MTT
3-(4,5-dimethylthiazol-2yl)-2,5-diphenyl tetrazolium bromide
- DMSO
dimethyl sulfoxide
- CTAB
hexadecyltrimethylammonium bromide
- IPTG
isopropyl β-D-1thiogalacto pyranoside
- (LB) broth
Luria-Bertani
- DEC
N-(3-Dimethylaminopropyl)-N′-ethyl carbodiimide hydrochloride
- PEG
poly ethylene glycol
- DOPE
1,2-di-(9Z-octadecenoyl)-sn-glycero-3-phosphoethanolamine
- DOTAP
1,2-di-(9Z-octadecenoyl)-3-trimethylammonium-propane (chloride salt)
- DOPE-CF
1,2-dioleoyl-sn-glycero-3-phosphoethanolamine-N-(carboxy fluorescein) (ammonium salt)
References
- 1.Derycke AS, Kamuhabwa A, Gijsens A, et al. Transferrin-conjugated liposome targeting of photosensitizer AlPcS4 to rat bladder carcinoma cells. J Natl Cancer Inst. 2004;96:1620–30. doi: 10.1093/jnci/djh314. [DOI] [PubMed] [Google Scholar]
- 2.Huang G, Zhou Z, Srinivasan R, et al. Affinity manipulation of surface-conjugated RGD peptide to modulate binding of liposomes to activated platelets. Biomaterials. 2008;29:1676–85. doi: 10.1016/j.biomaterials.2007.12.015. [DOI] [PMC free article] [PubMed] [Google Scholar]
- 3.Ravindra K. Pandey. Recent advances in photodynamic therapy. J Porphyrins Phthalocyanines. 2000;4:368–73. [Google Scholar]
- 4.Mojzisova H, Bonneau S, Brault D. Structural and physico-chemical determinants of the interactions of macrocyclic photosensitizers with cells. Eur Biophys J. 2007;36:943–53. doi: 10.1007/s00249-007-0204-9. [DOI] [PubMed] [Google Scholar]
- 5.Weishaupt KR, Gomer CJ, Dougherty TJ. Identification of singlet oxygen as the cytotoxic agent in photoinactivation of a murine tumor. Cancer Res. 1976;36:2326–9. [PubMed] [Google Scholar]
- 6.Brasseur N, Ouellet R, La Madeleine C, van Lier JE. Water-soluble aluminium phthalocyanine-polymer conjugates for PDT: photodynamic activities and pharmacokinetics in tumour-bearing mice. Br J Cancer. 1999;80:1533–41. doi: 10.1038/sj.bjc.6690557. [DOI] [PMC free article] [PubMed] [Google Scholar]
- 7.Li YJ, Dini D, Calvete MJF, Hanack M, Sun WF. Photophysics and nonlinear optical properties of tetra- and octabrominated silicon naphthalocyanines. J Phys Chem A. 2008;112:472–80. doi: 10.1021/jp0771116. [DOI] [PubMed] [Google Scholar]
- 8.Spikes JD, Vanlier JE, Bommer JC. A comparison of the photoproperties of zinc phthalocyanine and zinc naphthalocyanine tetrasulfonates - model sensitizers for the photodynamic therapy of tumors. J Photochem Photobiol A. 1995;91:193–8. [Google Scholar]
- 9.Shopova M, Woehrle D, Mantareva V, Mueller S. Naphthalocyanine Complexes as Potential Photosensitizers for Photodynamic Therapy of Tumors. J Biomed Opt. 1999;4:276–85. doi: 10.1117/1.429930. [DOI] [PubMed] [Google Scholar]
- 10.Shopova M, Peeva M, Stoichkova N, Jori G, Wöhrle D, Petrov G. Light intensity effect on the mechanisms of tumor damage photosensitized by a substituted Zn(II)-naphthalocyanine. J Porphyrins Phthalocyanines. 2001;5:798–802. [Google Scholar]
- 11.Müller S, Mantareva V, Stoichkova N, et al. Tetraamido-substituted 2,3-naphthalocyanine zinc(II) complexes as phototherapeutic agents: synthesis, comparative photochemical and photobiological studies. J Photochem Photobiol B. 1996;35:167–74. doi: 10.1016/s1011-1344(96)07294-6. [DOI] [PubMed] [Google Scholar]
- 12.Shopova M, Wohrle D, Stoichkova N, et al. Hydrophobic Zn(II)-naphthalocyanines as photodynamic therapy agents for Lewis lung carcinoma. J Photochem Photobiol B. 1994;23:35–42. doi: 10.1016/1011-1344(93)06983-a. [DOI] [PubMed] [Google Scholar]
- 13.Ruck A, Beck G, Bachor R, Akgun N, Gschwend MH, Steiner R. Dynamic fluorescence changes during photodynamic therapy in vivo and in vitro of hydrophilic A1(III) phthalocyanine tetrasulphonate and lipophilic Zn(II) phthalocyanine administered in liposomes. J Photochem Photobiol B. 1996;36:127–33. doi: 10.1016/s1011-1344(96)07359-9. [DOI] [PubMed] [Google Scholar]
- 14.Chen B, Pogue BW, Hasan T. Liposomal delivery of photosensitising agents. Expert Opin Drug Deliv. 2005;2:477–87. doi: 10.1517/17425247.2.3.477. [DOI] [PubMed] [Google Scholar]
- 15.Nunes SM, Sguilla FS, Tedesco AC. Photophysical studies of zinc phthalocyanine and chloroaluminum phthalocyanine incorporated into liposomes in the presence of additives. Braz J Med Biol Res. 2004;37:273–84. doi: 10.1590/s0100-879x2004000200016. [DOI] [PubMed] [Google Scholar]
- 16.Derycke AS, de Witte PA. Liposomes for photodynamic therapy. Adv Drug Deliv Rev. 2004;56:17–30. doi: 10.1016/j.addr.2003.07.014. [DOI] [PubMed] [Google Scholar]
- 17.Wöhrle D, Shopova M, Müller S, Milev AD, Mantareva VN, Krastev KK. Liposome-delivered Zn(II)-2,3-naphthalocyanines as potential sensitizers for PDT: synthesis, photochemical, pharmacokinetic and phototherapeutic studies. J Photochem Photobiol B. 1993;21:155–65. doi: 10.1016/1011-1344(93)80178-c. [DOI] [PubMed] [Google Scholar]
- 18.Rezler EM, Khan DR, Lauer-Fields J, Cudic M, Baronas-Lowell D, Fields GB. Targeted drug delivery utilizing protein-like molecular architecture. J Am Chem Soc. 2007;129:4961–72. doi: 10.1021/ja066929m. [DOI] [PMC free article] [PubMed] [Google Scholar]
- 19.Tseng YL, Liu JJ, Hong RL. Translocation of liposomes into cancer cells by cell-penetrating peptides penetratin and tat: a kinetic and efficacy study. Mol Pharmacol. 2002;62:864–72. doi: 10.1124/mol.62.4.864. [DOI] [PubMed] [Google Scholar]
- 20.Chiu GNC, Edwards LA, Kapanen AI, et al. Modulation of cancer cell survival pathways using multivalent liposomal therapeutic antibody constructs. Mol Cancer Ther. 2007;6:844–55. doi: 10.1158/1535-7163.MCT-06-0159. [DOI] [PubMed] [Google Scholar]
- 21.Huang Z, Szoka FC. Sterol-Modified Phospholipids: Cholesterol and Phospholipid Chimeras with Improved Biomembrane Properties. J Am Chem Soc. 2008;130:15702–12. doi: 10.1021/ja8065557. [DOI] [PMC free article] [PubMed] [Google Scholar]
- 22.Martina MS, Wilhelm C, Lesieur S. The effect of magnetic targeting on the uptake of magnetic-fluid-loaded liposomes by human prostatic adenocarcinoma cells. Biomaterials. 2008;29:4137–45. doi: 10.1016/j.biomaterials.2008.07.011. [DOI] [PubMed] [Google Scholar]
- 23.Li Z-C, He W, Li F-M. In situ polycondensation of amino acid modified liposomes and their properties. React Funct Polym. 1996;30:299–308. [Google Scholar]
- 24.Rezler EM, Khan DR, Tu R, Tirrell M, Fields GB. Peptide-mediated targeting of liposomes to tumor cells. Methods Mol Biol. 2007;386:269–98. doi: 10.1007/978-1-59745-430-8_10. [DOI] [PubMed] [Google Scholar]
- 25.Merzlyak A, Indrakanti S, Lee S-W. Genetically Engineered Nanofiber-Like Viruses For Tissue Regenerating Materials. Nano Lett. 2009;9:846–52. doi: 10.1021/nl8036728. [DOI] [PubMed] [Google Scholar]
- 26.Lankes HA, Zanghi CN, Santos K, Capella C, Duke CM, Dewhurst S. In vivo gene delivery and expression by bacteriophage lambda vectors. J Appl Microbiol. 2007;102:1337–49. doi: 10.1111/j.1365-2672.2006.03182.x. [DOI] [PMC free article] [PubMed] [Google Scholar]
- 27.Poul MA, Marks JD. Targeted gene delivery to mammalian cells by filamentous bacteriophage. J Mol Biol. 1999;288:203–11. doi: 10.1006/jmbi.1999.2678. [DOI] [PubMed] [Google Scholar]
- 28.Molenaar TJ, Michon I, de Haas SA, van Berkel TJ, Kuiper J, Biessen EA. Uptake and processing of modified bacteriophage M13 in mice: implications for phage display. Virology. 2002;293:182–91. doi: 10.1006/viro.2001.1254. [DOI] [PubMed] [Google Scholar]
- 29.Arap MA. Phage display technology - Applications and innovations. Genet Mol Biol. 2005;28:1–9. [Google Scholar]
- 30.Azzazy HME, Highsmith WE. Phage display technology: clinical applications and recent innovations. Clin Biochem. 2002;35:425–45. doi: 10.1016/s0009-9120(02)00343-0. [DOI] [PubMed] [Google Scholar]
- 31.Petrenko V. Evolution of phage display: from bioactive peptides to bioselective nanomaterials. Expert Opin Drug Deliv. 2008;5:825–36. doi: 10.1517/17425247.5.8.825. [DOI] [PubMed] [Google Scholar]
- 32.Sambrook J, Fritsch EF, Maniatis T. Molecular Cloning: A Laboratory Manual. 1989 [Google Scholar]
- 33.Sorokulova IB, Olsen EV, Chen IH, et al. Landscape phage probes for Salmonella typhimurium. J Microbiol Methods. 2005;63:55–72. doi: 10.1016/j.mimet.2005.02.019. [DOI] [PubMed] [Google Scholar]
- 34.Chang C-C, Yang Y-T, Yang J-C, Wu H-D, Tsai T. Absorption and emission spectral shifts of rose bengal associated with DMPC liposomes. Dyes and Pigments. 2008;79:170–5. [Google Scholar]
- 35.Eaton DF. International union of pure and applied chemistry organic chemistry division commission on photochemistry : Reference materials for fluorescence measurement. J Photochem Photobiol, B. 1988;2:523–31. doi: 10.1016/1011-1344(88)85081-4. [DOI] [PubMed] [Google Scholar]
- 36.Ogunsipe A, Chen JY, Nyokong T. Photophysical and photochemical studies of zinc(II) phthalocyanine derivatives - effects of substituents and solvents. New J Chem. 2004;28:822–7. [Google Scholar]
- 37.Tedesco AC, Oliveira DM, Lacava ZGM, Azevedo RB, Lima ECD, Morais PC. Investigation of the binding constant and stoichiometry of biocompatible cobalt ferrite-based magnetic fluids to serum albumin. J Magn Magn Mater. 2004;272-276:2404–5. [Google Scholar]
- 38.Hernandez-Caselles T, Villalain J, Gomez-Fernandez JC. Influence of liposome charge and composition on their interaction with human blood serum proteins. Mol Cell Biochem. 1993;120:119–26. doi: 10.1007/BF00926084. [DOI] [PubMed] [Google Scholar]
- 39.Ni J, Chen M, Zhang Y, Li R, Huang J, Yeh S. Vitamin E succinate inhibits human prostate cancer cell growth via modulating cell cycle regulatory machinery. Biochem Biophys Res Commun. 2003;300:357–63. doi: 10.1016/s0006-291x(02)02851-6. [DOI] [PubMed] [Google Scholar]
- 40.Yates NC, Moan J, Western A. Water-soluble metal naphthalocyanines - near-ir photosensitizers - cellular uptake, toxicity and photosensitizing properties in nhik 3025 human cancer-cells. J Photochem Photobiol B. 1990;4:379–90. doi: 10.1016/1011-1344(90)85017-q. [DOI] [PubMed] [Google Scholar]
- 41.Gitis V, Adin A, Nasser A, Gun J, Lev O. Fluorescent dye labeled bacteriophages - a new tracer for the investigation of viral transport in porous media: 1. Introduction and characterization. Water Res. 2002;36:4227–34. doi: 10.1016/s0043-1354(02)00163-x. [DOI] [PubMed] [Google Scholar]
- 42.Balasubramaniam E, Natarajan P. Photophysical properties of protoporphyrin IX and thionine covalently attached to macromolecules. J Photochem Photobiol A: Chem. 1997;103:201–11. [Google Scholar]
- 43.Rodriguez-Pulido A, Ortega F, Llorca O, Aicart E, Junquera E. A Physicochemical Characterization of the Interaction between DC-Chol/DOPE Cationic Liposomes and DNA. J Phys Chem B. 2008;112:12555–65. doi: 10.1021/jp804066t. [DOI] [PubMed] [Google Scholar]
- 44.Ford WE, Tollin G. Chlorophyll photosensitized electron-transfer in phospholipid-bilayer vesicle systems - effects of cholesterol on radical yields and kinetic-parameters. Photochemistry and Photobiology. 1984;40:249–59. [Google Scholar]
- 45.Ngweniform P, Li D, Mao CB. Self-assembly of drug-loaded liposomes on genetically engineered protein nanotubes: a potential anti-cancer drug delivery vector. Soft Matter. 2009;5:954–6. [Google Scholar]
- 46.Roslaniec M, Weitman H, Freeman D, Mazur Y, Ehrenberg B. Liposome binding constants and singlet oxygen quantum yields of hypericin, tetrahydroxy helianthrone and their derivatives: studies in organic solutions and in liposomes. J Photochem Photobiol B. 2000;57:149–58. doi: 10.1016/s1011-1344(00)00090-7. [DOI] [PubMed] [Google Scholar]
- 47.Hitz T, Iten R, Gardiner J, Namoto K, Walde P, Seebach D. Interaction of α;-and β-Oligoarginine-Acids and Amides with Anionic Lipid Vesicles:A Mechanistic and Thermodynamic Study. Biochemistry. 2006;45:5817–29. doi: 10.1021/bi060285d. [DOI] [PubMed] [Google Scholar]
- 48.Felgner PL, Gadek TR, Holm M, et al. Lipofection - a highly efficient, lipid-mediated DNA-transfection procedure. Proc Natl Acad Sci U S A. 1987;84:7413–7. doi: 10.1073/pnas.84.21.7413. [DOI] [PMC free article] [PubMed] [Google Scholar]
- 49.Raviv U, Needleman DJ, Li YL, Miller HP, Wilson L, Safinya CR. Cationic liposome-microtubule complexes: Pathways to the formation of two-state lipid-protein nanotubes with open or closed ends. Proc Natl Acad Sci U S A. 2005;102:11167–72. doi: 10.1073/pnas.0502183102. [DOI] [PMC free article] [PubMed] [Google Scholar]
- 50.Dunnick JK, McDougall IR, Aragon S, Goris ML, Kriss JP. Vesicle Interactions with Polyamino Acids and Antibody: In vitro and In vivo Studies. J Nucl Med. 1975;16:483–7. [PubMed] [Google Scholar]
- 51.Minnes R, Weitman H, You Y, Detty MR, Ehrenberg B. Dithiaporphyrin Derivatives as Photosensitizers in Membranes and Cells. J Phys Chem B. 2008;112:3268–76. doi: 10.1021/jp0768423. [DOI] [PubMed] [Google Scholar]
Associated Data
This section collects any data citations, data availability statements, or supplementary materials included in this article.


