Abstract
The impact of the urban setting on health and, in particular, health inequities has been widely documented. However, only a few countries have examined their inter- or intra-city health inequalities, and few do so regularly. Information that shows the gaps between cities or within the same city is a crucial requirement to trigger appropriate local actions to promote health equity. To generate relevant evidence and take appropriate actions to tackle health inequities, local authorities need a variety of tools. In order to facilitate a comprehensive understanding of health systems performance, these tools should: (1) adopt a multi-sectoral approach; (2) link evidence to actions; (3) be simple and user-friendly; and (4) be operationally feasible and sustainable. In this paper we have illustrated the use of one such tool, The World Health Organization’s Urban HEART, which guides users through a process to identify health inequities, focusing on health determinants and then developing actions based on the evidence generated. In a time of increasing financial constraints, there is a pressing need to allocate scarce resources more efficiently. Tools are needed to guide policy makers in their planning process to identify best-practice interventions that promote health equity in their cities.
Keywords: Urban health, Health equity, Health determinants, Tools, Indicators, Evidence-based action
Introduction
The impact of the urban environment on health and, in particular, health inequities has been widely documented.1–4 Evidence shows that even though, on average, health and health service provision in urban areas may be better than in rural areas, these averages often mask wide disparities between more and less disadvantaged populations.5–8
For example, in Glasgow, the United Kingdom of Great Britain and Northern Ireland, male life expectancy in Calton ward is 54 years in contrast to 82 years in Lenzie, a nearby ward in the same city.9 A cross-country study on child malnutrition and under-five mortality for 47 developing countries confirmed higher socioeconomic inequality in urban areas compared to rural areas.10
Regardless of the evidence, only a few countries have examined their inter- or intra-city health inequalities, and few do so regularly. Information that shows the gaps between cities or within the same city is a crucial requirement to trigger appropriate local actions to promote health equity. Furthermore, the evidence should be comprehensive enough to provide hints on key determinants, while at the same time concise enough to facilitate policy making and prioritization of interventions.
A Tool for Addressing Health Inequities in Cities
The World Health Organization (WHO) has developed a tool to help city governments and communities assess health inequities and identify appropriate responses. The tool is based on the following principles:
First, it is important to recognize that social structures and lifestyles in urban areas can magnify the risks of developing certain conditions and diseases. Evidence suggests that health services alone are insufficient to improve health.11 Hence, the tool takes into account the risk factors and interactions of multiple sectors in the urban environment as they impact on communicable and non-communicable diseases as well as violence and injuries.
Second, the evidence collected should be clearly linked to actionable interventions and policies. The tool promotes the use of disaggregated data by socioeconomic groups within a city, and by different geographical areas or neighbourhoods to develop guidance on multi-sectoral action and community participation.
Third, the tool is simple and user-friendly. A wide variety of stakeholders, including local and national government officials, civil society, and other independent agencies, can easily apply it for decision-making and impact assessment purposes.
Fourth, the implementation of the tool should be operationally feasible and sustainable. Evidence is gathered from routinely available data within existing institutional mechanisms. The response and proposed actions should be consistent with the planning cycle of local governments enabling policy makers to prioritize local resource allocation.
Urban HEART
The Urban Health Equity Assessment and Response Tool (Urban HEART) is a user-friendly guide for policy makers at local and national levels to address health inequities in cities.12 It consists of two key components:
Assessment: this section analyzes (A) health outcomes, and (B) health determinants. Health determinants are grouped into four policy domains:
Physical environment and infrastructure;
Social and human development;
Economics;
Governance.
Response: this section identifies interventions and strategies for action from a list of best-practice interventions. While interventions would be modified to address the specifics of the local contexts, the tool provides the basis for prioritizing appropriate interventions.
The key target audience for the tool includes:
Mayors and local governments;
Central government ministries, including those that oversee health, education, transport, etc.;
Community groups and civil society organizations, e.g., Healthy Cities.
Urban HEART was implemented in cities of 10 countries—Brazil, Indonesia, Islamic Republic of Iran, Kenya, Malaysia, Mexico, Mongolia, Philippines, Sri Lanka, and Vietnam—to assess its applicability in varied urban settings. Experiences from the cities led to the finalization of Urban HEART. Countries (and cities) were selected based on the following criteria:
Political will and commitment of national and/or local governments to address health inequities in their cities;
Availability of data that will enable an analysis of health inequity in the city, e.g., by geographical areas such as wards;
Interest and support from stakeholders such as local and national government authorities, academic institutions, civil society, and UN agencies including WHO.
Applying Urban HEART
The assessment of tuberculosis incidence rates across 13 cities in Japan is described below as an example of the use of the tool to assess intra-city inequities.
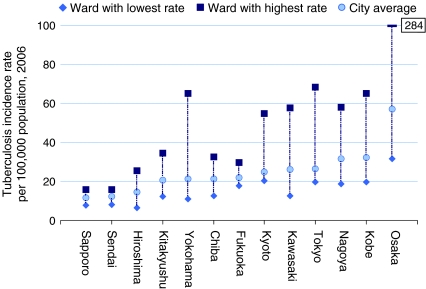
Using Urban HEART, we analyzed TB incidence rates both within and across 13 cities in Japan. Figure 1 shows intra-city rates within the 13 cities across 151 wards in 2006. Osaka has the highest inequalities in TB incidence rate within its wards while Fukuoka has the lowest inequalities (in terms of rate ratios). Among 25 wards in Osaka, TB incidence rate is 9 times greater in the ward with the highest rate compared to the ward with the lowest rate in 2006.
FIGURE 1.
Intra-city inequalities among wards in TB incidence rate per 100,000 population across 13 major cities in Japan 2006, Source: Research Institute of Tuberculosis, Kiyose, Japan.
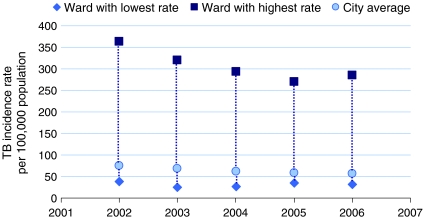
Figure 2 outlines the trends in inequalities among wards in Osaka over time. While the general trend in disease burden has declined since 2002, the inequalities in incidence rates remain high. This study demonstrates that averages mask inequalities, and that strategic actions and interventions need to be guided by more in-depth analysis of disaggregated data.
FIGURE 2.
Trends in TB incidence rate differentials between best and worst performing wards in Osaka, Source: Research Institute of Tuberculosis, Kiyose, Japan.
Core Indicators
Intra-city analysis conducted on health outcomes and health determinants in various settings resulted in the identification of a set of standardized indicators to assess inequities. Health outcome indicators include disease-specific mortality and morbidity indicators (e.g., diabetes prevalence rate) and summary indicators (e.g., infant mortality rate). Health-determinants indicators include those in four policy domains, namely physical environment and infrastructure (e.g., access to safe water), social and human development (e.g., skilled birth attendance), economics (e.g., unemployment rate), and governance (e.g., expenditure on health). Disaggregating data by population groups or geographical areas for each indicator provides the extent of inequity within the city. Based on the availability of data and the strength of the indicator to measure inequities, Urban HEART provides a list of core indicators for governments, which will allow comparisons over time, within and between cities and countries (Table 1).
Table 1.
List of Urban HEART core indicators
| # | DOMAIN / INDICATOR | DEFINITION |
|---|---|---|
| HEALTH OUTCOMES | ||
| 1. | Infant mortality | The number of infant deaths between birth and exactly one year of age, expressed as a rate per 1,000 live births |
| 2. | Diabetes prevalence and death | Diabetes prevalence and death rates per 100,000 population (age-standardized) |
| 3. | A. Tuberculosis treatment success | A. Proportion of tuberculosis cases detected and cured under directly observed treatment, short course (DOTS) |
| B. Tuberculosis prevalence and death | B. Prevalence and death rates associated with tuberculosis | |
| 4. | Road traffic injuries | Road traffic death rate per 100,000 population |
| PHYSICAL ENVIRONMENT AND INFRASTRUCTURE | ||
| 5. | Access to safe water | Percentage of population with sustainable access to an improved water source |
| 6. | Access to improved sanitation | Percentage of population with access to improved sanitation |
| SOCIAL AND HUMAN DEVELOPMENT | ||
| 7. | Completion of primary education | Completion of primary education, expressed as a percent |
| 8. | Skilled birth attendance | Proportion of births attended by skilled health personnel |
| 9. | Fully immunized children | Percentage of fully immunized children |
| 10. | Prevalence of tobacco smoking | Percentage of population who currently smoke cigarettes and other forms of tobacco products |
| ECONOMICS | ||
| 11. | Unemployment | Percentage of population who are currently unemployed |
| GOVERNANCE | ||
| 12. | Government spending on health | Percentage of local government spending allocated to health |
Source Urban HEART12
Further analysis may be conducted by including other measures of health determinants and outcomes, depending on specific needs and local contexts.12 The identification of the indicators to be analyzed should be determined by the various stakeholders who will be involved in the assessment, as well as the prioritization and implementation of the interventions to reduce health inequities.
Conclusion
The aspiration for closing the health gap in cities can be met by guiding public health policies through evidence and in-depth analysis of inequalities. In a time of increasing financial constraints, there is a pressing need to allocate scarce resources more efficiently. Tools such as Urban HEART can equip policy makers to act on promoting health equity in their cities. It is envisioned that over time, cities will institutionalize and adapt the tool to their local context, while WHO will continue providing technical assistance and platforms for international learning exchange.
References
- 1.Report to the WHO Commission on Social Determinants of Health from the Knowledge Network on Urban Settings. Our cities, our health, our future: acting on social determinants of health equity in urban settings. Kobe, Japan: World Health Organization Centre for Health Development; 2008.
- 2.Vlahov D, Freudenberg N, Proietti F, Ompad D, et al. Urban as a Determinant of Health. J Urban Health. 2007;84(1)(Supp):16-26. [DOI] [PMC free article] [PubMed]
- 3.Kjellstrom T, Mercado S. Towards action on social determinants for health equity in urban settings. Environ Urban. 2008;20(2):551–574. doi: 10.1177/0956247808096128. [DOI] [Google Scholar]
- 4.Peirce N, Johnson CW. Century of the city: no time to lose. New York, United States of America: the Rockefeller Foundation; 2008.
- 5.UN Expert Group Meeting on Population Distribution and Migration, UN Department of Economic and Social Affairs. Health and urbanization in developing countries. Santa Cruz, Bolivia: World Health Organization; 1993.
- 6.Smith LC, Ruel MT, Ndiaye A. Why is child malnutrition lower in urban than in rural areas? Evidence from 36 developing countries. World Dev. 2005;33(8):1285–1305. doi: 10.1016/j.worlddev.2005.03.002. [DOI] [Google Scholar]
- 7.Bitran R, Giedion U, Valenzuela R, Monkkonen P. Keeping health in an urban environment: public health challenges for the urban poor. In: Fay M, ed. The urban poor in Latin America. Washington, DC: World Bank Publications; 2005:179-195.
- 8.Fotso JC. Urban–rural differentials in child malnutrition: trends and socioeconomic correlates in Sub-Saharan Africa. Health Place. 2007;13:205–223. doi: 10.1016/j.healthplace.2006.01.004. [DOI] [PubMed] [Google Scholar]
- 9.Hanlon P, Walsh D, Whyte B. Let Glasgow flourish. Glasgow: Glasgow Centre for Population Health; 2006. [Google Scholar]
- 10.Poel E, O’Donnell O, Doorslaer E. Are urban children really healthier? Evidence from 47 developing countries. Soc Sci Med. 2007;65:1986–2003. doi: 10.1016/j.socscimed.2007.06.032. [DOI] [PubMed] [Google Scholar]
- 11.Jalan J, Ravallion M. Does piped water reduce diarrhea for children in rural India? Washington DC: The World Bank; 2001. Policy Research Working Paper Series 2664.
- 12.Urban Health Equity Assessment and Response Tool (Urban HEART). World Health Organization, Centre for Health Development. http://www.who.or.jp/urbanheart/. Accessed 1 Aug 2010.


