

Abstract
Caspase-8 (CASP8) and caspase-10 (CASP10) play key roles in regulating apoptosis, and functional polymorphisms of them may alter apoptosis and cancer risk. However, no reported studies have investigated the association between such polymorphisms and the risk of cutaneous melanoma (CM). In a hospital-based study of 805 non-Hispanic white patients with CM and 835 cancer-free age- sex- and ethnicity-matched controls, we genotyped three reported putatively functional polymorphisms of CASP8 and CASP10--CASP8 D302H (rs1045485:G>C), CASP8-652 6N del (rs3834129:–/CTTACT), and CASP10 I522L (rs13006529:A>T)--and assessed their associations with risk of CM and interactions with known risk factors for CM. We also calculated the false-positive-report probability (FPRP) for significant findings. CASP8 302H variant genotypes (DH: adjusted odds ratio [OR], 0.70 [95% confidence interval (CI), 0.50-0.98]; DH+HH: unadjusted OR, 0.78 [95% CI, 0.62-0.98]; FPRP, 0.79) and CASP8 -652 6N del variant genotypes (ins/del: OR, 0.74 [95% CI, 0.57-0.97]; ins/del+del/del: OR, 0.76 [95% CI, 0.61-0.95]; FPRP, 0.61) were associated with significantly lower CM risk than were the ins/ins genotypes. The CASP10 522L variant genotypes were not associated with significantly altered CM risk. Also, the D-del-I haplotype was associated with a significantly lower CM risk (OR, 0.52 [95% CI, 0.37-0.74]; FPRP, 0.116) than was the most common haplotype, D-ins-I. Furthermore, multivariate logistic regression analysis revealed that CASP8 D302H, CASP8 -652 6N del, and CASP10 I522L were independent risk factors for CM. Therefore, these CASP8 and CASP10 variant polymorphisms may be biomarkers for susceptibility to CM.
Keywords: apoptosis, death pathway, genetic susceptibility, molecular epidemiology, skin cancer
INTRODUCTION
Apoptosis occurs under a variety of physiologic and pathologic conditions mainly via the death receptor and mitochondrial pathways, leading to a cascade activation of caspases [Danial and Korsmeyer, 2004; Hengartner, 2000]. In apoptosis, caspases function as cysteine aspartyl proteases, cleaving numerous intracellular substrates and initiating cell dissolution [Hengartner, 2000]. To date, researchers have identified 13 caspases [Cryns and Yuan, 1998], all of which are involved in apoptosis. Caspase-8 (CASP8 [OMIM:601763]) and caspase-10 (CASP10 [OMIM:601762]) are the only known members of the caspase family to contain duplicated death effector domains in long prodomains in their amino termini that precede the cysteine protease catalytic domains in their carboxyl termini [Prunell, et al., 2005]. These death effector domains allow CASP8 and CASP10, whose genes are both located at chromosome 2q33-34 [Grenet, et al., 1999], to interact directly with the adaptor molecule FAS-associated death domain [Medema, et al., 1997; Yang, et al., 1998], subsequently activating downstream effectors such as caspase-3 and caspase-7 and triggering apoptosis mediated by FAS (a tumor necrosis factor receptor) and FASLG (a tumor necrosis factor-related apoptosis-inducing ligand) [Juo, et al., 1998; Kischkel, et al., 2001]. Therefore, dysfunction of CASP8 and CASP10 can result in deregulation of apoptosis and lead to diseases such as cancer [Shin, et al., 2002; Soung, et al., 2005; Takita, et al., 2000], including cutaneous melanoma (CM) [Wang and Li, 2006].
CM is responsible for approximately 90% of all skin cancer-related deaths. It is estimated that 59,940 new cases of and 7,910 deaths were caused by CM in the United States in 2007 [Jemal, et al., 2007]. The exact cause of CM remains unclear; however, ultraviolet (UV) light exposure is a major risk factor [Gilchrest, et al., 1999; Wei, et al., 2003] because it causes damage to DNA, and cells with excessive DNA damage undergo apoptosis, preventing abnormal growth [Banerjee, et al., 2005; Bohm, et al., 2005]. Studies have shown that dysregulation of apoptosis caused by polymorphisms of the genes involved in the apoptosis pathway plays a crucial role in melanocytic carcinogenesis [Li, et al., 2006]. Moreover, recent studies revealed that the CASP8 and CASP10 genes are highly polymorphic (http://egp.gs.washington.edu/data/casp10/); thus, polymorphisms of CASP8 and CASP10 that can alter the functions of these genes [MacPherson, et al., 2004; Son, et al., 2006] are likely to modulate the risk of UV light-induced CM.
Studies have also shown that CASP8 and CASP10 polymorphisms are associated with risk of cancer of the lung [Son, et al., 2006], breast [Cox, et al., 2007; Frank, et al., 2006; MacPherson, et al., 2004], and colon [Goodman, et al., 2006]. In contrast, a recent study found that the minor -652 6N del allele of CASP8 was functional and protected against several types of cancer in Chinese populations [Sun, et al., 2007]. However, to the best of our knowledge, no reported studies have investigated the role of CASP8 and CASP10 polymorphisms in the development of CM. Given that CASP8 and CASP10 play a role in carcinogenesis, we hypothesized that putatively functional polymorphisms of CASP8 and CASP10 are associated with risk of CM. We tested this hypothesis in a case-control study of 805 patients with CM and 835 cancer-free control subjects who were frequency-matched by age, sex, and ethnicity. We used genomic DNA and the polymerase chain reaction (PCR)-restriction fragment length polymorphism method to determine the presence of three putatively functional single nucleotide polymorphisms (SNPs)--CASP8 D302H, CASP8 -652 6N del, and CASP10 I522L--in the cases and controls.
MATERIALS AND METHODS
Study Subjects
Our study population was described previously [Li, et al., 2008]. Briefly, patients with newly diagnosed and untreated CM who had been referred to The University of Texas M. D. Anderson Cancer Center were recruited from May 1994 to February 2006. Patients who had no metastases, had no other cancers, and agreed to a one-time donation of a blood sample were included in the study. There were no restrictions on the patients’ age or tumor stage. The response rate among patients approached for participation was approximately 85%. The patients’ tumors were histologically classified according to the 2002 American Joint Committee on Cancer melanoma staging system [Balch, et al., 2001].
Cancer-free control subjects were recruited during the same period from among self-reported cancer-free visitors to M. D. Anderson Cancer Center; these individuals were not seeking medical care but were instead accompanying patients on outpatient clinic visits. The response rate for participation in this group was approximately 90%. The controls were not blood relatives of the patients or each other and were frequency-matched with the patients by age (± 5 years), sex, and ethnicity.
After giving their informed consent to take part in the study, each eligible participant in person to obtain data on age; sex; ethnicity; color of skin, eyes, and hair; family history of any cancer; presence of moles or dysplastic nevi; tanning ability; lifetime number of sunburns with blistering; occurrence of freckling in the sun as a child; and Fitzpatrick classification of sun-reactive skin type [Fitzpatrick, 1988]. At the end of each interview, a sample of blood (30 mL) was drawn from the participant into a heparinized tube. The research protocol for this study was approved by the M. D. Anderson Institutional Review Board.
Polymorphism Selection
The National Institute of Environmental Health Science database (http://egp.gs.washington.edu/) and related literature were searched in an effort to include all putatively functional SNPs of CASP8 and CASP10 with a minor allele frequency greater than 0.05 in European descendants. As a result, one common nonsynonymous SNP for CASP8 (D302H in exon 9; rs1045485:G>C), one SNP in the promoter region of CASP8 (-652 6N del, rs3834129:–/CTTACT), and one common nonsynonymous SNP for CASP10 (I522L in exon 8; rs13006529:A>T) were identified in the National Center for Biotechnology Information dbSNP database for CASP8 (http://www.ncbi.nlm.nih.gov/SNP/snp_ref.cgi?locusId=841&chooseRs=all) and CASP10 (http://www.ncbi.nlm.nih.gov/SNP/snp_ref.cgi?locusId=843&chooseRs=all).
Genotyping
Leukocyte cell pellets were obtained from the buffy coat of blood by centrifuging 1-2 mL of whole blood samples obtained from each of the cases and controls. Genomic DNA was extracted from the cell pellets using the Qiagen DNA blood mini kit (Valencia, CA). The purity and concentration of the extracted DNA were determined by spectrophotometric measurement of absorbance at 260 and 280 nm.
Previously described primers [Sun, et al., 2007] for the CASP8 -652 6N ins/del polymorphism (rs3834129:-/CTTACT; NM_001228.4) were used, and the following primers with mismatch bases (underlined) were designed to create new restriction sites and used to amplify the target fragments of the CASP8 codon D302H G>C (rs1045485:G>C; NM_001228.4) and CASP10 I522L (rs13006529:A>T; NM_001230.4) polymorphisms in PCR analysis: 5′-CATTTTGAGATCAAGCCCCGC-3′ (forward) and 5′-CCCTTGTCTCCATGGGAGAGGA-3′ (reverse) for CASP8 D302H and 5′-GAGTGGACAAACAGGGAACAAA-3′ (forward) and 5′-AGAACCAACAAAAACTCTCTGCAATA-3′ (reverse) for CASP10 I522L. These primers generated PCR products of 171, 132, and 122 bp that were digested by the BfaI, BstUI, and SspI restriction enzymes, respectively (New England Biolabs, Beverly, MA) to identify genotypes of the CASP8 -652 6N ins/del, CASP8 D302H G>C, and CASP10 I522L A>T genotypes, respectively (Fig. 1: a-f). Approximately 10% of the DNA samples were randomly selected for genotype confirmation, and the repeated results were 100% concordant with the original genotype data.
FIGURE 1.
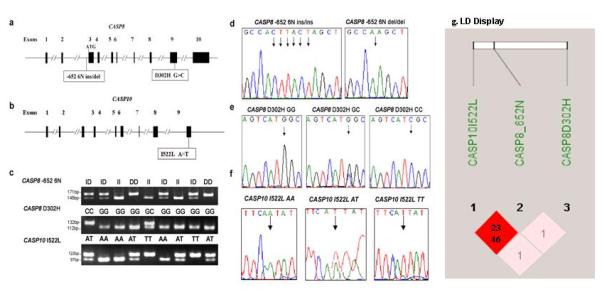
The CASP8 and CASP10 gene structure and genotypes and the CASP8 -652 6N ins/del (rs3834129:–/CTTACT), CASP8 D302H (rs1045485:G>C), and CASP10 I522L (rs13006529:A>T) sites. a: The CASP8 gene structure and locations of the -652 6N ins/del and D302H G>C variants. b: The CASP10 gene structure and locations of the I522L A>T variant. c: Genotyping of CASP8 -652 6N ins/del (ins/ins, ins/del, and del/del), CASP8 D302H G>C (GG, GC, and CC), and CASP10 I522L A>T (AA, AT, and TT) using genomic DNA. d: Direct sequencing results for the CASP8 -652 6N ins/del genotypes (del/del and ins/ins). e: Direct sequencing results for the CASP8 D302H G>C genotypes (GG, GC, and CC). f: Direct sequencing results for the CASP10 I522L A>T genotypes (AA, AT, and TT). g: LD display for CASP8 and CASP10 SNPs. The colors are based on D’ and logarithm (base 10) of odds (LOD): the shaded pink/light gray area represents D’ < 1 and LOD ≥ 2, and the bright red/dark area represents D’ = 1 and LOD ≥ 2. The numbers displayed in the diamonds are the r2*100 for pairwise SNPs: 23 for the HapMap data and 46 for the observed data in this present study.
Statistical Analysis
The chi-square test was used to evaluate differences between the cases and controls in the frequency of selected demographic variables, including the known risk factors for CM, and each allele and genotype of the selected SNPs. Their skin color was self-assessed using a screening questionnaire on a scale of 1 (light) to 10 (dark); values of 1-3, 4-6, and 7-10 were categorized as fair, brown, and dark skin, respectively, to obtain similar numbers of observations in each stratum for statistical comparison. Unconditional univariate and multivariate logistic regression analyses were performed to obtain the crude and adjusted odds ratios (ORs) and 95% confidence intervals (CIs) for CM risk. Also, testing for the homogeneity of the ORs in different strata was performed using the Cochran-Mantel-Haenszel statistic [Agresti, 2002]. In addition, multivariate logistic regression models were used to analyze interactions between each SNP and stratified variables by adjusting for all other appropriate variables, such as age; sex; ethnicity; color of skin, eyes, and hair; family history of any cancer; presence of moles or dysplastic nevi; tanning ability; lifetime number of sunburns with blistering; freckling in the sun as a child; and skin type, which were also used for variable-stratification analyses. Receiver operating characteristic curves were plotted and summary statistics of the area under the curve (AUC) were calculated [Honghu Liu, 2003] for all logistic regression models using the SAS statistical software program (SAS/STAT version 9.13; SAS Institute Inc., Cary, NC).
Haplotypes for the investigated variants on the same chromosome were reconstructed using the PHASE program (version 2) [Stephens and Scheet, 2005; Stephens, et al., 2001], which estimated an individual’s probability of having a particular haplotype pair given the individual’s unphase genotypes. Each individual was assigned a pair of haplotypes that had the highest estimated probability. Each haplotype was then treated as a binary variable coded as 0 or 1 for lacking or having this particular haplotype, respectively. Haplotypes with a frequency less than 1% were combined into one group of rare haplotypes for futher comparison. The global omnibus test for case-control differences in the frequencies of all haplotypes was performed using Pearson’s chi-square test [Jiao, et al., 2007]. The likelihood ratio test was used to compare the results of the logistic regression model with haplotypes with the results of the intercept-only model to evaluate the association between the frequencies of CASP8 and CASP10 haplotypes and risk of CM [Feigelson, et al., 2006]. To estimate these associations, ORs for CM were obtained using multivariable logistic regression models with and without adjustment for age, sex, skin color, eye color, hair color, tanning ability, lifetime number of sunburns with blistering, freckling in the sun as a child, presence of moles and dysplastic nevi, and family history of cancer for the haplotypes. The most frequent estimated haplotype was used as the reference group in all logistic regression models [Sprague, et al., 2007].
In addition, the interactions among the CASP8 and CASP10 genotypes and selected known risk factors for CM (tanning ability, lifetime number of sunburns with blistering, and freckling in the sun as a child) were assessed. An OR11 higher than OR10*OR01 suggested a more-than-multiplicative interaction [Brennan P, 2004]. To assess this evidence of a departure from a multiplicative model, the interaction terms for the pair of ariables for an interaction of interest were fitted using standard unconditional logistic regression analysis. ORs, 95% CIs, and P values for interactions and trend tests were calculated using multivariate logistic regression models in which an interactive term was created as the product of each of the dichotomized genotypes with each of the dichotomized risk factors.
To determine whether the main effect of the CASP8 and CASP10 SNPs was independent of other known risk factors, selected variables were included in the multivariate logistic regression analyses of data from only those subjects who completely answered their questionnaires [Wang, et al., 2007]. Two models were fitted. The first model included age, sex, and the three polymorphisms of interest, the aim being to control for any potential effects due to associations among the polymorphisms. The second model excluded the polymorphism that did not show a statistically significant association with CM risk in the first model but included all other known risk factors, the aim being to further assess the independent effects of the polymorphisms. P values less than or equal to 0.05 were considered statistically significant.
Finally, the false-positive-report probability (FPRP) was used to detect the false-positive association findings [Wacholder, et al., 2004]. In all of the significant statistical tests in our study using the overall study population, the high (≈0.1) and modest (≈0.01) prior probabilities of an association and an OR of 1.5 for the genotype and haplotype were chosen to calculate FPRPs. An FPRP less than 0.2 was considered a noteworthy association. All tests were two-sided and were performed using the SAS software program (version 9.13).
RESULTS
Characteristics of Study Subjects
Because less than 1% of the cases and controls were not non-Hispanic whites, we included only non-Hispanic white patients with CM (n = 805) and matched controls (n = 835) in the final analysis. Their ages ranged from 18 to 87 years. As shown previously [Li, et al., 2008], the frequency of classic phenotype traits that are known risk factors for CM (i.e., eye color, hair color, tanning ability, lifetime number of sunburns with blistering, freckling in the sun as a child, and presence of moles and dysplastic nevi) was significantly higher in the cases than in the controls after adjustment for age and sex (data not shown). Therefore, these traits appeared to be risk factors for CM risk in this study population, and we used them for adjustments in the multivariate logistic regression analyses performed to assess the main effects of the genotypes on CM risk.
Association between CASP8 and CASP10 Genotypes and CM Risk
The frequencies of variant alleles and genotypes of the three CASP8 and CASP10 SNPs are listed in Table 1. Compared with the controls, the cases had a significantly lower frequency of the CASP8 302H allele (P = 0.034) and DH+HH genotypes (P = 0.029) and of the CASP8-652 6N del allele (P = 0.092) and ins/del+del/del genotypes (P = 0.014) but an insignificantly higher frequency of the CASP10 variant 1522L allele (P = 0.206) and IL+LL genotypes (P = 0.292). However, we observed no difference in the distribution of the CASP8 -652 6N and CASP10 1522L genotypes between the cases and controls according to Clark level (P = 0.864 and 0.236, respectively) or tumor stage (P = 0.883 and 0.681, respectively) (data not shown).
TABLE 1.
Genotype and Allele Frequencies of the CASP8 and CASP10 SNPsin Non-Hispanic White Patients with CM and Control Subjects and Their Associations with Risk of CM
| Cases (n = 805) |
Controlsa (n = 835) |
Crude OR (95% CI) |
Adjusted OR (95% CI)c |
||||
|---|---|---|---|---|---|---|---|
| Variable | No. | % | No. | % | P valueb | ||
| CASP8 D302H (rs1045485:G>C) | 0.088d | ||||||
| DD | 629 | 78.1 | 615 | 73.6 | 1.00 | 1.00 | |
| DH | 168 | 20.9 | 207 | 24.8 | 0.79 (0.63-1.00) | 0.70 (0.50-0.98) | |
| HH | 8 | 1.0 | 13 | 1.6 | 0.60 (0.25-1.46) | 1.00 (0.27-3.74) | |
| DH+HH | 176 | 21.9 | 220 | 26.4 | 0.034e | 0.78 (0.62-0.98) | 0.71 (0.51-0.99) |
| H allele frequency | 0.114 | 0.140 | 0.029f | ||||
| CASP8 -652 6N | 0.042d | ||||||
| ins/ins | 243 | 30.2 | 207 | 24.8 | 1.00 | ||
| ins/del | 385 | 47.8 | 440 | 52.7 | 0.75 (0.60-0.95) | 0.74 (0.57-0.97) | |
| del/del | 177 | 22.0 | 188 | 22.5 | 0.81 (0.61-1.06) | 0.78 (0.56-1.07) | |
| ins/del+del/del | 562 | 69.8 | 628 | 75.2 | 0.014e | 0.76 (0.61-0.95) | 0.75 (0.58-0.97) |
| del allele frequency | 0.459 | 0.489 | 0.092f | ||||
| CASP10 I522L (rs13006529:A>T) | 0.439d | ||||||
| II | 206 | 25.6 | 239 | 28.6 | 1.00 | 1.00 | |
| IL | 418 | 51.9 | 415 | 49.7 | 1.17 (0.93-1.47) | 1.15 (0.88-1.50) | |
| LL | 181 | 22.5 | 181 | 21.7 | 1.16 (0.88-1.53) | 1.09 (0.79-1.50) | |
| IL+LL | 599 | 74.4 | 596 | 71.4 | 0.206e | 1.17 (0.94-1.45) | 1.13 (0.88-1.46) |
| L allele frequency | 0.484 | 0.465 | 0.292f | ||||
The observed genotype frequency in the controls was in agreement with the Hardy-Weinberg equilibrium (CASP8 D302H: χ2 = 0.880, P = 0.348; CASP8 -652 6N: χ2 = 2.474, P = 0.116; CASP10 I522L: χ2 = 0.001, P = 0.973).
Two-sided chi-square test for either genotype distribution or allele frequency.
ORs were adjusted for age, sex, skin color, eye color, hair color, tanning ability, lifetime number of sunburns with blistering, freckling in the sun as a child, presence of moles or dysplastic nevi, and family history of cancer in a logistic regression model.
Distribution of three genotypes.
Distribution of combined genotypes.
Allele distribution.
After adjustment for other selected known risk factors (skin color, eye color, hair color, tanning ability, lifetime number of sunburns with blistering, freckling in the sun as a child, presence of moles and dysplastic nevi, and family history of cancer), we found a significantly lower risk of CM associated with the CASP8 D302H DH (adjusted OR, 0.70 [95% CI, 0.50-0.98]), CASP8 D302H DH+HH (adjusted OR, 0.71 [95% CI, 0.51-0.99]), CASP8 -652 6N ins/del (adjusted OR, 0.74 [95% CI, 0.57-0.97]), and CASP8 -652 6N ins/del+del/del (adjusted OR, 0.75 [95% CI, 0.58-0.97]) genotypes than with their corresponding common DD and ins/ins genotypes, whereas we observed no association of a significantly altered risk with the CASP10 I522L genotypes (Table 1).
Association between Melanoma Risk and SNP Genotypes Stratified by the Known Risk Factors for CM and Evaluation of Possible Interactions
We further stratified the observed association between CASP8 variant genotypes and CM risk according to the known CM risk factors shown in Table 2. Although we consistently observed the significant reverse association between CM risk and variant genotypes of both CASP8 and CASP10 SNPs in a subgroup of subjects over the age of 50 years, interactions between these genotypes and other known risk factors may have occurred. For example, the CASP8 H allele carriers were more likely to have a low risk of CM associated with black or brown hair, good tanning ability, and a lack of sunburns with blistering or freckling, whereas the CASP8-652 6N del allele carriers were more likely to have a low risk associated with an eye color other than blue, poor tanning ability, and sunburns with blistering. In the CASP10 1522L SNP carriers, elevated risk of CM associated with the L allele was statistically significant only in men, subjects with dark or brown skin, and subjects with good tanning ability.
TABLE 2.
Stratification Analysis of Associations between the Genotypes of the CASP8 D302H, CASP8 -652 6N, and CASP10 I522L SNPs and CM Riska
| CASP8 D302H (cases/controls) | CASP8 -652 6N (cases/controls) | CASP10 1522L (cases/controls) | |||||||
|---|---|---|---|---|---|---|---|---|---|
| Variable | DD | DH+HH | Adjusted ORb (95% CI) |
ins/del | ins/ins +del/del |
Adjusted ORb (95% CI) |
II | IL+LL | Adjusted ORb (95% CI) |
| Age | |||||||||
| ≤ 50 | 240/237 | 84/68 | 1.08 (0.70-1.67) | 96/84 | 228/221 | 0.88 (0.59-1.32) | 79/98 | 245/207 | 1.49 (0.99-2.26) |
| > 50 | 388/378 | 93/152 | 0.59 (0.42-0.83) | 147/123 | 334/407 | 0.67 (0.48-0.92)x | 129/141 | 352/389 | 0.96 (0.69-1.32) |
| Interaction P value | 0.019 | 0.320 | 0.117 | ||||||
| Sex | |||||||||
| Male | 396/417 | 112/144 | 0.76 (0.54-1.06) | 140/131 | 368/430 | 0.78 (0.56-1.09) | 120/164 | 388/397 | 1.42 (1.02-1.97) |
| Female | 232/198 | 65/76 | 0.66 (0.42-1.02) | 103/76 | 194/198 | 0.67 (0.45-1.01) | 88/75 | 209/199 | 0.88 (0.61-1.26) |
| Interaction P value | 0.710 | 0.561 | 0.025 | ||||||
| Hair color | |||||||||
| Black or brown | 259/251 | 68/93 | 0.69 (0.50-0.93) | 97/84 | 230/260 | 0.76 (0.57-1.02) | 77/102 | 250/242 | 1.12 (0.84-1.51) |
| Blonde or red | 313/277 | 92/97 | 0.89 (0.53-1.49) | 119/88 | 286/286 | 0.62 (0.36-1.06) | 107/99 | 298/275 | 1.01 (0.60-1.69) |
| Interaction P value | 0.391 | 0.828 | 0.950 | ||||||
| Eye color | |||||||||
| Other | 331/391 | 94/139 | 0.74 (0.54-1.03) | 129/132 | 296/398 | 0.74 (0.57-0.95) | 101/152 | 324/378 | 1.30 (0.95-1.78) |
| Blue | 240/135 | 66/50 | 0.69 (0.44-1.10) | 86/39 | 20/146 | 2.46 (0.24-24.8) | 82/48 | 224/137 | 0.86 (0.55-1.35) |
| Interaction P value | 0.868 | 0.592 | 0.153 | ||||||
| Skin color | |||||||||
| Dark or brown | 384/425 | 102/152 | 0.68 (0.46-1.00) | 148/141 | 338/436 | 0.83 (0.57-1.19) | 123/160 | 363/417 | 1.42 (1.02-1.97) |
| Fair | 188/99 | 58/37 | 0.82(0.56-1.19) | 68/29 | 178/107 | 0.64 (0.44-0.92) | 61/38 | 185/98 | 0.88 (0.61-1.26) |
| Interaction P value | 0.483 | 0.366 | 0.053 | ||||||
| Tanning ability | |||||||||
| Good (high) | 160/231 | 35/94 | 0.66 (0.49-0.93) | 56/84 | 139/241 | 0.88 (0.64-1.22) | 50/96 | 145/229 | 1.44 (1.04-1.99) |
| Poor (low) | 410/296 | 125/94 | 0.94 (0.61-1.46) | 159/187 | 376/303 | 0.54 (0.35-0.84) | 133/103 | 402/287 | 0.74 (0.48-1.14) |
| Interaction P value | 0.270 | 0.117 | 0.021 | ||||||
| Lifetime sunburns with blistering | |||||||||
| None | 271/306 | 66/112 | 0.61 (0.38-0.97) | 90/99 | 247/319 | 0.88 (0.57-1.35) | 76/125 | 261/293 | 1.35 (0.87-2.08) |
| ≥ 1 | 297/220 | 94/77 | 0.90 (0.65-1.25) | 125/71 | 266/226 | 0.69 (0.50-0.95) | 108/75 | 283/222 | 1.08 (0.78-1.48) |
| Interaction P value | 0.056 | 0.320 | 0.556 | ||||||
| Freckling in the sun as a child | |||||||||
| No | 357/323 | 92/117 | 0.65 (0.45-0.94) | 127/116 | 322/324 | 0.79 (0.55-1.12) | 102/137 | 347/303 | 1.40 (0.98-1.99) |
| Yes | 215/204 | 68/72 | 0.85 (0.58-1.24) | 89/56 | 194/220 | 0.71 (0.49-1.02) | 82/64 | 201/212 | 0.88 (0.61-1.29) |
| Interaction P value | 0.378 | 0.485 | 0.066 | ||||||
| Moles | |||||||||
| No | 137/217 | 36/71 | 0.85 (0.53-.138) | 51/64 | 122/224 | 0.67 (0.42-1.07) | 48/75 | 125/213 | 0.84 (0.53-1.33) |
| Yes | 491/398 | 141/149 | 0.69 (0.50-0.95) | 192/143 | 440/404 | 0.78 (0.58-1.06) | 160/164 | 472/383 | 1.30 (0.96-1.76) |
| Interaction P value | 0.461 | 0.763 | 0.146 | ||||||
| Dysplastic nevi | |||||||||
| No | 579/612 | 160/214 | 0.77 (0.59-1.00) | 227/204 | 512/622 | 0.78 (0.58-1.07) | 196/236 | 543/590 | 1.12 (0.87-1.44) |
| Yes | 49/3 | 17/6 | 0.30 (0.03-2.94) | 16/3 | 50/6 | 0.63 (0.40-1.00) | 12/3 | 54/6 | 2.85 (0.22-37.4) |
| Interaction P value | 0.060 | 0.404 | 0.498 | ||||||
| First-degree relatives with any cancer | |||||||||
| No | 262/315 | 82/112 | 0.75 (0.50-1.14) | 97/104 | 247/323 | 0.76 (0.50-1.14) | 93/119 | 251/308 | 0.93 (0.62-1.39) |
| Yes | 366/300 | 95/108 | 0.71 (0.50-1.00) | 146/103 | 315/305 | 0.76 (0.58-1.04) | 115/120 | 346/288 | 1.31 (0.94-1.81) |
| Interaction P value | 0.813 | 0.962 | 0.198 | ||||||
The numbers of subjects in some of the strata were less than the total number of subjects because some subjects did not provide information.
ORs were adjusted for age, sex, skin color, eye color, hair color, tanning ability, lifetime number of sunburns with blistering, freckling in the sun as a child, presence of moles and dysplastic nevi, and family history of cancer in a multivariate logistic regression model.
The apparent differences in some of stratum-specific ORs in Table 2 show that CASP8 D302H and CASP8 -652 6N may interact with the stratifying variables differently as evidenced by the homogeneity tests without adjustment for other covariates (data not shown). In contrast, we did not observe any obvious difference in stratum-specific ORs for CASP10 I522L. Further statistical testing identified some statistical evidence of an interaction of CASP8 D302H genotypes with age (P = 0.019) and an interaction of CASP10 522L genotypes with sex (P = 0.025) and tanning ability (P = 0.021), after adjustment for other covariates (Table 2).
Association between CASP8 and CASP10 Haplotypes and CM Risk
Because the CASP8 and CASP10 genes are both located on chromosome 2, we performed an LD analysis and inferred haplotype using the expectation-maximization algorithm. We found that minor alleles of the three SNPs were in incomplete LD (CASP8 D302H and CASP8 -652 6N: D’ = 0.27, r2 = 0.012, P < 0.001; CASP8 D302H and CASP10 I522L: D’ = 0.30, r2 = 0.015, P < 0.001; CASP8 -652 6N and CASP10 I522L: D’ = 0.69, r2 = 0.460, P < 0.001) (Fig. 1: g). We inferred eight haplotypes of the CASP8 and CASP10 genes, five of which had a frequency greater than 0.05, in both cases and controls using the observed genotypes of the three SNPs (Table 3). The overall distributions of the CASP8 and CASP10 haplotypes in the cases and controls were significantly different (P = 0.0003). Using the most common haplotype, D-ins-I, as the reference, we found that all haplotypes containing the del allele were associated with a reduced risk of CM but that only the D-del-I haplotype was associated with a significantly reduced risk of CM (adjusted OR, 0.52 [95% CI, 0.37-0.74]). Three haplotypes (H-ins-I, H-ins-L, and H-del-I) had frequencies of less than 5%, so we combined them into a single “minor haplotype allele” category, which was also associated with a reduced risk of CM (adjusted OR, 0.50 [95% CI, 0.31-0.80]) (Table 3). These data suggest that the CASP8 -652 6N del allele was the major allele that contributed to reverse association between the CASP8 and CASP10 haplotypes and CM risk.
TABLE 3.
ORs and 95% CIs for Risk of CM with Haplotypes and the Combined Genotypes of CASP8 D302H (rs1045485:G>C), CASP8 -652 6N (rs3834129:-/CTTACT), and CASP10 I522L (rs13006529:A>T) in Non-Hispanic White Patients with CM and Controls
| Cases (n = 1610) | Controls (n = 1670) | Crude OR (95% CI) |
Adjusted OR (95% CI)a |
|||
|---|---|---|---|---|---|---|
| Haplotype | No. | % | No. | % | ||
| D-ins-I | 690 | 42.84 | 662 | 39.66 | Reference | Reference |
| D-del-L | 537 | 33.36 | 527 | 31.57 | 0.95 (0.80-1.13) | 0.93 (0.75-1.17) |
| H-del-L | 107 | 6.65 | 124 | 7.44 | 0.85 (0.61-1.17) | 0.96 (0.63-1.47) |
| D-del-I | 82 | 5.12 | 144 | 8.61 | 0.58 (0.44-0.78) | 0.52 (0.37-0.74) |
| D-ins-L | 116 | 7.17 | 103 | 6.14 | 1.05 (0.79-1.39) | 0.96 (0.68-1.35) |
| All minor haplotypesb | 78 | 4.83 | 110 | 6.56 | 0.64 (0.44-0.93) | 0.50 (0.31-0.80) |
ORs were adjusted for age, sex, skin color, eye color, hair color, tanning ability, lifetime number of sunburns with blistering, freckling in the sun as a child, presence of moles or dysplastic nevi, and family history of cancer in a logistic regression model. The χ2 for haplotype frequency distribution in the cases and controls was 23.64 with five degrees of freedom (P = 0.0003).
Incluidng three haplotypes, each with a frequency < 0.05.
Multivariate Analysis of the Association between the CASP8 and CASP10 Genotypes/Haplotypes and CM Risk
We fit five separate multivariable logistic regression models to identify independent effects of the CASP8 and CASP10 SNPs and haplotypes on the risk of CM (Table 4). We separately added each of the SNPs and the combined genotypes of all SNPs and haplotypes to the model that included other covariates, such as age, sex, skin color, eye color, hair color, tanning ability, lifetime number of sunburns with blistering, freckling in the sun as a child, presence of moles and dysplastic nevi, and family history of cancer. The AUC was the greatest for the model that included haplotypes (AUC = 0.745; P = 0.003), which was a slight improvement over the model that included the combined genotypes of all SNPs (AUC = 0.743; P = 0.011). Therefore, we chose the haplotypes over the SNPs in the final multivariate logistic regression model.
TABLE 4.
Comparison of Logistic Regression Models with and without Genotypes or Haplotypes for CASP8 D302H (rs1045485:G>C), CASP8 -652 6N (rs3834129:-/CTTACT), and CASP10 I522L (rs13006529:A>T)
| Model | Dfa | -2 Log Lb | LRTc | Dfd | P valuee | AUC |
|---|---|---|---|---|---|---|
| Constantf | -- | 2273.0 | -- | -- | -- | -- |
| Constant + covariatesg | 11 | 1477.5 | 795.44 | 11 | < 0.001 | 0.738 |
| Constant + covariates + CASP8 D302H genotypes | 13 | 1473.4 | 4.16 | 2 | 0.125 | 0.739 |
| Constant + covariates + CASP8 -652 6N genotypes | 13 | 1474.2 | 3.33 | 2 | 0.189 | 0.739 |
| Constant + covariates + CASP10 I522L genotypes | 13 | 1475.3 | 2.20 | 2 | 0.333 | 0.739 |
| Constant + covariates + all SNP genotypes | 17 | 1461.0 | 16.51 | 6 | 0.011 | 0.743 |
| Constant + covariates + haplotypes | 16 | 1459.5 | 17.99 | 5 | 0.003 | 0.745 |
Number of variables in the logistic regression model.
-2Log likelihood value for the logistic regression model.
Likelihood ratio test for evaluating the fit of the model.
Difference in the number of variables when comparing two models.
P value for the likelihood ratio test to compare two models.
Model with constant only.
Model with constant and covariates such as age, sex, skin color, eye color, hair color, tanning ability, lifetime number of sunburns with blistering, freckling in the sun as a child, presence of moles and dysplastic nevi, and family history of cancer.
Finally, the FPRP values for a prior probability of 0.01 for the CASP8 SNPs and CASP8-652N were 0.79 and 0.61, respectively, assuming that the OR for the specific genotype was 0.67, with a post-hoc statistical power of 0.90 and 0.89, respectively. The association of the haplotype D-del-I with CM risk yielded an FPRP value of 0.04 for a prior probability of 0.01, assuming that the OR for CM risk was 0.67 and had a statistical power of 0.106, which was a noteworthy finding (Table 5).
TABLE 5.
FPRP Values for Associations Between CM Risk and Frequencies of Genotypes and Haplotypes of CASP8 D302H (rs1045485:G>C), CASP8 -652 6N (rs3834129:-/CTTACT), and CASP10 I522L (rs13006529:A>T)
| Statistical | Prior probability |
|||||||
|---|---|---|---|---|---|---|---|---|
| Genotype/ haplotype | ORa (95% CI) | P valueb | powerc | 0.2500 | 0.1000 | 0.0100 | 0.0010 | 0.0001 |
|
CASP8 D302H DH + HH versus DD |
0.78 (0.62-0.98) | 0.0340 | 0.900 | 0.10 | 0.25 | 0.79 | 0.97 | 1.00 |
|
CASP8 -652 6N Ins/del+del/del vs. Ins/ins |
0.76 (0.61-0.95) | 0.0140 | 0.890 | 0.04 | 0.12 | 0.61 | 0.94 | 0.99 |
| D-del-I versus D-ins-I | 0.58 (0.44-0.78) | < 0.0001 | 0.106 | < 0.01 | < 0.01 | 0.04 | 0.29 | 0.80 |
DISCUSSION
In this hospital-based case-control study of CM, we found that the CASP8 D302H (DH/DH+HH) genotypes were associated with a lower CM risk than the CASP8 DD genotype was and that the CASP8 -652 6N (ins/del+del/del) genotypes were associated with a lower CM risk than the CASP8 -652 6N ins/ins genotype was. In addition, the D-del-I haplotype was associated with a significantly lower CM risk than was the most common haplotype, D-ins-I. Furthermore, the combined CASP8 and CASP10 genotypes seemed to be independent of other risk factors that modulated CM risk. To the best of our knowledge, this is the first study of the association of CASP8 and CASP10 SNPs with risk of CM.
The CASP8 302 aspartate lies on the surface of the CASP8 protein, and the residual amino acid change may alter CASP8’s interactions with antiapoptotic molecules and the autoprocessing of procaspase 8 molecules [Frank, et al., 2005; MacPherson, et al., 2004]. Although reports of four studies of associations between the CASP8 D302H polymorphism and different cancers have been published, they had inconsistent results. The earliest study, which was conducted in the United Kingdom using 3191 patients with breast cancer and 3258 cancer-free controls, found that CASP8 302H variant genotypes were associated with a significantly reduced breast cancer risk [MacPherson, et al., 2004], which is consistent with our findings for CM. A later, small study conducted in the United States using 216 patients with colon cancer and 255 cancer-free controls found an association between colon cancer risk and the combined CASP8 302H and glutathione S-transferase T1-null genotypes but not the CASP8 D302H polymorphism alone [Goodman, et al., 2006]. Also, a German study of 511 patients with familial breast cancer and 547 cancer-free controls found an association between breast cancer risk and the combined CASP8 D302H and CASP10 V410I genotypes but not the CASP8 D302H polymorphism alone [Frank, et al., 2006], whereas a study from Korea found that the CASP8 -678del (a typographical error for -652del) and IVS12-19G→A genotypes were not associated with lung cancer risk [Son, et al., 2006]. However, these three most recent and relatively small studies may not have had enough statistical power to detect the main effect of the CASP8 D302H or -652 6N del polymorphisms. One even more recent large study, which included pooling analyses of 14 studies in the Breast Cancer Surveillance Consortium, confirmed a main effect of CASP8 D302H on breast cancer risk [Cox, et al., 2007].
The CASP8 promoter -652 6N del allele has been found to destroy a binding element for stimulatory protein 1 and to reduce the expression of CASP8, thus resulting in a reduction in the apoptosis reactivity of T lymphocytes upon stimulation by cancer cells or phytohemagglutinin in an ex vivo model [Sun, et al., 2007]. Also, UV light exposure can induce immunosuppression [Schwarz, 2005]. Therefore, one possible mechanism underlying the observed reverse association with CM risk in our study is that the CASP8 -652 6N del variant may have caused reduced apoptosis in the T lymphocytes and led to decreased escape of transformed cells from the antitumor immune response, resulting in protection against CM[Sun, et al., 2007]; alternatively, reduced apoptosis of the cells involved in the immune process may have led to protection against CM. For example, T-lymphocyte apoptosis can be induced by activation-induced cell death through tumor-specific antigens, resulting in interrupted immune homeostasis and surveillance [Green, et al., 2003]. With this in mind, our results of a reverse association between the CASP8 -652 6N del variant and CM risk in our non-Hispanic white population are consistent with results of the study of a Chinese population by Sun and colleagues [Sun, et al., 2007].
The function of CASP10, the closest homologue of CASP8, is almost completely unknown. A recent study revealed that despite having functions that overlap some CASP8 functions, CASP10 had selective substrate cleavage specificity and thus may have nonredundant roles in apoptosis signaling [Fischer, et al., 2006]. In particular, the 522I>L involves the last amino acid of the CASP10 protein and is not thought to be directly associated with cancer risk; indeed, prediction of protein functions using the Sorting Intolerant From Tolerant program did not provide a definitive result of the CASP10 protein functions for this nonsynonymous polymorphism (http://egp.gs.washington.edu/data/casp10/cas10.pph-sift.txt). However, the CASP10 I522L SNP may be in LD with unknown functional SNPs or haplotypes associated with CM risk. The German study of 511 familial breast cancer cases and 547 controls by Frank and colleagues described above found an association of reduced breast cancer risk with the combined CASP8 D302H and CASP10 V410I genotypes, suggesting a joint effect of CASP8 and CASP10 genotypes. In our study, however, we did not include the CASP10 V410I polymorphism in ous study, because the frequency of this variant allele is reportedly less than 0.05 in European descendants (http://egp.gs.washington.edu/data/casp10/). Nevertheless, we found that the D-del-I haplotype was associated with a lower CM risk.
In addition, we observed some statistical evidence of gene-environment interactions between CASP8 D302H and sunburn with blistering and between CASP10 I522L and sex and tanning ability. However, because of our study’s limited sample size and the current uncertainty about the biological mechanisms underlying such interactions, these findings are only suggestive. Indeed, in our multivariate logistic regression analysis, these SNPs appeared to be independent of other risk factors and associated with CM risk. Larger population-based studies and additional mechanistic studies are needed to validate these interactions.
In summary, we found that the CASP8 D302H and CASP8 -652 6N variant genotypes are associated with the risk of CM in a single locus analysis and that the combined variant genotypes of the CASP8 D302H, CASP8 -652 6N, and CASP10 I522L SNPs and their haplotypes had an effect on the risk of CM in multivariate analysis. Even though our study was relatively large, our sample size apparently was not large enough to identify significant associations in some subgroups. Also, we used common putatively functional SNPs rather than tagging SNPs; the selected SNPs may be functional but may not have represented all genetic variations within the genes or may have been in LD with other causal alleles that were not included in this study. Because ours was a hospital-based case-control study, the control subjects may not have been representative of the general population. Finally, the control subjects were not evaluated for skin lesions as rigorously as the patients were, and the risk factors for CM were self-reported, introducing the possibility of misclassification of risk factors. These limitations can only be overcome in future large, well-designed prospective studies including all tagging SNPs.
ACKNOWLEDGMENTS
We thank Margaret Lung, Cesar A. Maldonado, and Amanda Franco for assistance in recruiting the subjects; Zhaozheng Guo, Yawei Qiao, Jianzhong He, and Kejing Xu for laboratory assistance; Monica Domingue for manuscript preparation; Ann Sutton, Angelique Siy and Donald R. Norwood for scientific editing; and the M. D. Anderson Informatics, Tissue Resource, and Pathology Core. This work was supported by National Institutes of Health, National Cancer Institute grants R01 CA100264 (to Q.W.), P50 CA093459 (E.A.G.), and P30 CA16672 (M. D. Anderson) and partly by National Institute of Environmental Health Sciences grant R01 ES11740 (Q.W.).
Grant sponsors: National Institutes of Health, National Cancer Institute; Grant numbers: R01 CA100264, P50 CA093459, and P30 CA16672; Grant sponsor: National Institute of Environmental Health Sciences; Grant number: R01 ES11740.
REFERENCES
- Agresti A. Categorical Data Analysis. Wiley-Interscience; New York: 2002. [Google Scholar]
- Balch CM, Buzaid AC, Soong SJ, Atkins MB, Cascinelli N, Coit DG, Fleming ID, Gershenwald JE, Houghton A, Jr., Kirkwood JM. Final version of the American Joint Committee on Cancer staging system for cutaneous melanoma. J Clin Oncol. 2001;19(16):3635–48. doi: 10.1200/JCO.2001.19.16.3635. others. [DOI] [PubMed] [Google Scholar]
- Banerjee G, Gupta N, Kapoor A, Raman G. UV induced bystander signaling leading to apoptosis. Cancer Lett. 2005;223(2):275–84. doi: 10.1016/j.canlet.2004.09.035. [DOI] [PubMed] [Google Scholar]
- Bohm M, Wolff I, Scholzen TE, Robinson SJ, Healy E, Luger TA, Schwarz T, Schwarz A. alpha-Melanocyte-stimulating hormone protects from ultraviolet radiation-induced apoptosis and DNA damage. J Biol Chem. 2005;280(7):5795–802. doi: 10.1074/jbc.M406334200. [DOI] [PubMed] [Google Scholar]
- Brennan P LS, Hashibe M, et al. Pooled analysis of alcohol dehydrogenase genotypes and head and neck cancer: a HuGE review. Am J Epidemiol. 2004;159(1):1–16. doi: 10.1093/aje/kwh003. [DOI] [PubMed] [Google Scholar]
- Cox A, Dunning AM, Garcia-Closas M, Balasubramanian S, Reed MW, Pooley KA, Scollen S, Baynes C, Ponder BA, Chanock S. A common coding variant in CASP8 is associated with breast cancer risk. Nat Genet. 2007;39(3):352–8. doi: 10.1038/ng1981. others. [DOI] [PubMed] [Google Scholar]
- Cryns V, Yuan J. Proteases to die for. Genes Dev. 1998;12(11):1551–70. doi: 10.1101/gad.12.11.1551. [DOI] [PubMed] [Google Scholar]
- Danial NN, Korsmeyer SJ. Cell death: critical control points. Cell. 2004;116(2):205–19. doi: 10.1016/s0092-8674(04)00046-7. [DOI] [PubMed] [Google Scholar]
- Feigelson HS, Cox DG, Cann HM, Wacholder S, Kaaks R, Henderson BE, Albanes D, Altshuler D, Berglund G, Berrino F. Haplotype analysis of the HSD17B1 gene and risk of breast cancer: a comprehensive approach to multicenter analyses of prospective cohort studies. Cancer Res. 2006;66(4):2468–75. doi: 10.1158/0008-5472.CAN-05-3574. others. [DOI] [PubMed] [Google Scholar]
- Fischer U, Stroh C, Schulze-Osthoff K. Unique and overlapping substrate specificities of caspase-8 and caspase-10. Oncogene. 2006;25(1):152–9. doi: 10.1038/sj.onc.1209015. [DOI] [PubMed] [Google Scholar]
- Fitzpatrick TB. The validity and practicality of sun-reactive skin types I through VI. Arch Dermatol. 1988;124(6):869–71. doi: 10.1001/archderm.124.6.869. [DOI] [PubMed] [Google Scholar]
- Frank B, Bermejo JL, Hemminki K, Klaes R, Bugert P, Wappenschmidt B, Schmutzler RK, Burwinkel B. Re: Association of a common variant of the CASP8 gene with reduced risk of breast cancer. J Natl Cancer Inst. 2005;97(13):1012. doi: 10.1093/jnci/dji178. author reply 1012-3. [DOI] [PubMed] [Google Scholar]
- Frank B, Hemminki K, Wappenschmidt B, Meindl A, Klaes R, Schmutzler RK, Bugert P, Untch M, Bartram CR, Burwinkel B. Association of the CASP10 V410I variant with reduced familial breast cancer risk and interaction with the CASP8 D302H variant. Carcinogenesis. 2006;27(3):606–9. doi: 10.1093/carcin/bgi248. [DOI] [PubMed] [Google Scholar]
- Gilchrest BA, Eller MS, Geller AC, Yaar M. The pathogenesis of melanoma induced by ultraviolet radiation. N Engl J Med. 1999;340(17):1341–8. doi: 10.1056/NEJM199904293401707. [DOI] [PubMed] [Google Scholar]
- Goodman JE, Mechanic LE, Luke BT, Ambs S, Chanock S, Harris CC. Exploring SNP-SNP interactions and colon cancer risk using polymorphism interaction analysis. Int J Cancer. 2006;118(7):1790–7. doi: 10.1002/ijc.21523. [DOI] [PMC free article] [PubMed] [Google Scholar]
- Green DR, Droin N, Pinkoski M. Activation-induced cell death in T cells. Immunol Rev. 2003;193:70–81. doi: 10.1034/j.1600-065x.2003.00051.x. [DOI] [PubMed] [Google Scholar]
- Grenet J, Teitz T, Wei T, Valentine V, Kidd VJ. Structure and chromosome localization of the human CASP8 gene. Gene. 1999;226(2):225–32. doi: 10.1016/s0378-1119(98)00565-4. [DOI] [PubMed] [Google Scholar]
- Hengartner MO. The biochemistry of apoptosis. Nature. 2000;407(6805):770–6. doi: 10.1038/35037710. [DOI] [PubMed] [Google Scholar]
- Honghu Liu TW. Estimating the Area under a Receiver Operating Characteristic Curve For Repeated Measures Design. Journal of Statistical Software. 2003;8(12):1–18. [Google Scholar]
- Jemal A, Siegel R, Ward E, Murray T, Xu J, Thun MJ. Cancer statistics, 2007. CA Cancer J Clin. 2007;57(1):43–66. doi: 10.3322/canjclin.57.1.43. [DOI] [PubMed] [Google Scholar]
- Jiao L, Hassan MM, Bondy ML, Abbruzzese JL, Evans DB, Li D. The XPD Asp312Asn and Lys751Gln polymorphisms, corresponding haplotype, and pancreatic cancer risk. Cancer Lett. 2007;245(1-2):61–8. doi: 10.1016/j.canlet.2005.12.026. [DOI] [PMC free article] [PubMed] [Google Scholar]
- Juo P, Kuo CJ, Yuan J, Blenis J. Essential requirement for caspase-8/FLICE in the initiation of the Fas-induced apoptotic cascade. Curr Biol. 1998;8(18):1001–8. doi: 10.1016/s0960-9822(07)00420-4. [DOI] [PubMed] [Google Scholar]
- Kischkel FC, Lawrence DA, Tinel A, LeBlanc H, Virmani A, Schow P, Gazdar A, Blenis J, Arnott D, Ashkenazi A. Death receptor recruitment of endogenous caspase-10 and apoptosis initiation in the absence of caspase-8. J Biol Chem. 2001;276(49):46639–46. doi: 10.1074/jbc.M105102200. [DOI] [PubMed] [Google Scholar]
- Li C, Larson D, Zhang Z, Liu Z, Strom SS, Gershenwald JE, Prieto VG, Lee JE, Ross MI, Mansfield PF. Polymorphisms of the FAS and FAS ligand genes associated with risk of cutaneous malignant melanoma. Pharmacogenet Genomics. 2006;16(4):253–63. doi: 10.1097/01.fpc.0000199501.54466.de. others. [DOI] [PubMed] [Google Scholar]
- Li C, Liu Z, Wang LE, Gershenwald JE, Lee JE, Prieto VG, Duvic M, Grimm EA, Wei Q. Haplotype and genotypes of the VDR gene and cutaneous melanoma risk in non-Hispanic whites in Texas: A case-control study. Int J Cancer. 2008 doi: 10.1002/ijc.23357. [DOI] [PMC free article] [PubMed] [Google Scholar]
- MacPherson G, Healey CS, Teare MD, Balasubramanian SP, Reed MW, Pharoah PD, Ponder BA, Meuth M, Bhattacharyya NP, Cox A. Association of a common variant of the CASP8 gene with reduced risk of breast cancer. J Natl Cancer Inst. 2004;96(24):1866–9. doi: 10.1093/jnci/dji001. [DOI] [PubMed] [Google Scholar]
- Medema JP, Scaffidi C, Kischkel FC, Shevchenko A, Mann M, Krammer PH, Peter ME. FLICE is activated by association with the CD95 death-inducing signaling complex (DISC) Embo J. 1997;16(10):2794–804. doi: 10.1093/emboj/16.10.2794. [DOI] [PMC free article] [PubMed] [Google Scholar]
- Prunell GF, Arboleda VA, Troy CM. Caspase function in neuronal death: delineation of the role of caspases in ischemia. Curr Drug Targets CNS Neurol Disord. 2005;4(1):51–61. doi: 10.2174/1568007053005082. [DOI] [PubMed] [Google Scholar]
- Schwarz T. Mechanisms of UV-induced immunosuppression. Keio J Med. 2005;54(4):165–71. doi: 10.2302/kjm.54.165. [DOI] [PubMed] [Google Scholar]
- Shin MS, Kim HS, Kang CS, Park WS, Kim SY, Lee SN, Lee JH, Park JY, Jang JJ, Kim CW. Inactivating mutations of CASP10 gene in non-Hodgkin lymphomas. Blood. 2002;99(11):4094–9. doi: 10.1182/blood.v99.11.4094. others. [DOI] [PubMed] [Google Scholar]
- Son JW, Kang HK, Chae MH, Choi JE, Park JM, Lee WK, Kim CH, Kim DS, Kam S, Kang YM. Polymorphisms in the caspase-8 gene and the risk of lung cancer. Cancer Genet Cytogenet. 2006;169(2):121–7. doi: 10.1016/j.cancergencyto.2006.04.001. others. [DOI] [PubMed] [Google Scholar]
- Soung YH, Lee JW, Kim SY, Sung YJ, Park WS, Nam SW, Kim SH, Lee JY, Yoo NJ, Lee SH. Caspase-8 gene is frequently inactivated by the frameshift somatic mutation 1225_1226delTG in hepatocellular carcinomas. Oncogene. 2005;24(1):141–7. doi: 10.1038/sj.onc.1208244. [DOI] [PubMed] [Google Scholar]
- Sprague BL, Trentham-Dietz A, Garcia-Closas M, Newcomb PA, Titus-Ernstoff L, Hampton JM, Chanock SJ, Haines JL, Egan KM. Genetic variation in TP53 and risk of breast cancer in a population-based case control study. Carcinogenesis. 2007;28(8):1680–6. doi: 10.1093/carcin/bgm097. [DOI] [PubMed] [Google Scholar]
- Stephens M, Scheet P. Accounting for decay of linkage disequilibrium in haplotype inference and missing-data imputation. Am J Hum Genet. 2005;76(3):449–62. doi: 10.1086/428594. [DOI] [PMC free article] [PubMed] [Google Scholar]
- Stephens M, Smith NJ, Donnelly P. A new statistical method for haplotype reconstruction from population data. Am J Hum Genet. 2001;68(4):978–89. doi: 10.1086/319501. [DOI] [PMC free article] [PubMed] [Google Scholar]
- Sun T, Gao Y, Tan W, Ma S, Shi Y, Yao J, Guo Y, Yang M, Zhang X, Zhang Q. A six-nucleotide insertion-deletion polymorphism in the CASP8 promoter is associated with susceptibility to multiple cancers. Nat Genet. 2007;39(5):605–13. doi: 10.1038/ng2030. others. [DOI] [PubMed] [Google Scholar]
- Takita J, Yang HW, Bessho F, Hanada R, Yamamoto K, Kidd V, Teitz T, Wei T, Hayashi Y. Absent or reduced expression of the caspase 8 gene occurs frequently in neuroblastoma, but not commonly in Ewing sarcoma or rhabdomyosarcoma. Med Pediatr Oncol. 2000;35(6):541–3. doi: 10.1002/1096-911x(20001201)35:6<541::aid-mpo9>3.0.co;2-t. [DOI] [PubMed] [Google Scholar]
- Wacholder S, Chanock S, Garcia-Closas M, El Ghormli L, Rothman N. Assessing the probability that a positive report is false: an approach for molecular epidemiology studies. J Natl Cancer Inst. 2004;96(6):434–42. doi: 10.1093/jnci/djh075. [DOI] [PMC free article] [PubMed] [Google Scholar]
- Wang LE, Hsu TC, Xiong P, Strom SS, Duvic M, Clayman GL, Weber RS, Lippman SM, Goldberg LH, Wei Q. 4-Nitroquinoline-1-oxide-induced mutagen sensitivity and risk of nonmelanoma skin cancer: a case-control analysis. J Invest Dermatol. 2007;127(1):196–205. doi: 10.1038/sj.jid.5700481. [DOI] [PubMed] [Google Scholar]
- Wang Y, Li G. ING3 promotes UV-induced apoptosis via Fas/caspase-8 pathway in melanoma cells. J Biol Chem. 2006;281(17):11887–93. doi: 10.1074/jbc.M511309200. [DOI] [PubMed] [Google Scholar]
- Wei Q, Lee JE, Gershenwald JE, Ross MI, Mansfield PF, Strom SS, Wang LE, Guo Z, Qiao Y, Amos CI. Repair of UV light-induced DNA damage and risk of cutaneous malignant melanoma. J Natl Cancer Inst. 2003;95(4):308–15. doi: 10.1093/jnci/95.4.308. others. [DOI] [PubMed] [Google Scholar]
- Yang X, Chang HY, Baltimore D. Autoproteolytic activation of pro-caspases by oligomerization. Mol Cell. 1998;1(2):319–25. doi: 10.1016/s1097-2765(00)80032-5. [DOI] [PubMed] [Google Scholar]