Abstract
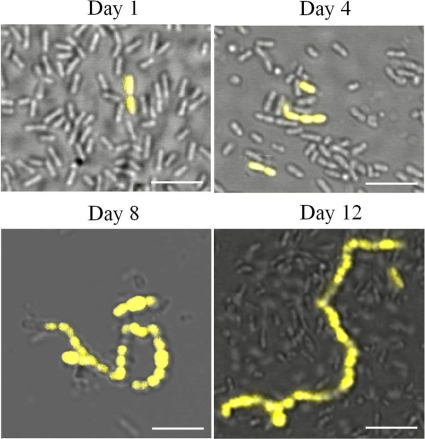
Streptococcus mutans is a facultative member of the oral plaque and is associated with dental caries. It is able to survive long periods of sugar starvation. We show here that inactivation of pdhD, putatively encoding a subunit of the pyruvate dehydrogenase complex, impairs survival of both batch cultures and biofilms. We show that pdhD and the downstream genes pdhA, pdhB, and pdhC form an operon that is predominantly transcribed in stationary phase. Analysis with fluorescent reporters revealed a bimodal expression pattern for the pdh promoter, with less than 1% of stationary-phase populations expressing pdh. When it was first detected, after 1 day of sugar starvation in batch culture, expression was mostly in individual bacteria. At later times, expressing bacteria were often in chains. The lengths of the chains increased with time. We infer that the pdh-expressing subpopulation is able grow and divide and to persist for extended times in stationary phase.
Streptococcus mutans is a facultative inhabitant of the oral plaque, the microbial pellicle that covers the tooth surface. It can use a variety of sugars present in the environment and metabolize them by glycolysis (2, 6). As a result, organic acids, predominantly lactic acid, are produced. Acid accumulation can decrease the pH of the oral plaque and lead to demineralization of the enamel, making S. mutans the main etiological agent of dental caries (15).
Between meals, bacteria in the oral plaque are subjected to short-term nutrient starvation. Longer-term nutrient starvation conditions may be encountered in crevices in the enamel, in gingival pockets, or deep in thick biofilms, where there may be significant competition for nutrients. S. mutans is highly adapted to intervals of starvation, and a subpopulation of bacteria can survive for long periods after the sugar has been depleted from a chemically defined medium (1, 22). Sugar metabolism is central to the survival of S. mutans (2, 6). Carbohydrates from the environment are transported in the cell and metabolized through the glycolytic/Embden-Meyerhof-Parnas pathway to pyruvate. When the glucose concentration is high, the concentration of an intermediate metabolite, fructose 1,6-biphosphate, is also high; this metabolite induces formation of lactate dehydrogenase, which converts pyruvate to lactic acid (homofermentation), with the concomitant oxidation of NADH to NAD (16, 27, 28). However, when the sugar concentration is low, lactate dehydrogenase is not induced. Under these conditions, the subsequent metabolism of pyruvate depends on the availability of oxygen. In the absence of oxygen, pyruvate can be converted by pyruvate formate lyase (PFL) to acetyl coenzyme A (acetyl-CoA) and formate. In the presence of oxygen PFL is inactive, and pyruvate can be converted by the pyruvate dehydrogenase complex (PDH) to acetyl-CoA and CO2, with the concomitant generation of NADH. Acetyl-CoA can then be metabolized to acetate, with the production of one molecule of ATP (4).
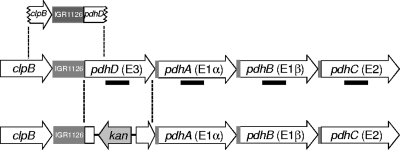
We found that four adjacent genes putatively encoding the components of the PDH complex (SMU.1421 to SMU.1424; http://www.ncbi.nlm.nih.gov/gene/) were upregulated early in stationary phase. The PDH complex is composed of three enzymes: pyruvate dehydrogense (E1), dihydrolipoyl transacetylase (E2), and dihydrolipoyl dehydrogenase (E3). E1 of Gram-positive bacteria is composed of two subunits, E1α and E1β, so that the complex in Gram-positive bacteria consists of four proteins, E1α, E1β, E2, and E3. The number of these protein subunits in the complex varies between species. The complex also contains four coenzymes: thiamine pyrophosphate (TPP), flavin adenine dinucleotide (FAD), nicotinaminde adenine dinucleotide (NAD), and lipoate (8, 11, 17, 24). In S. mutans, the order of the genes putatively encoding the components of the PDH complex is pdhD-pdhA-pdhB-pdhC (Fig. 1), with pdhD (SMU.1424), pdhA (SMU.1423), pdhB (SMU.1422), and pdhC (SMU.1421), encoding E3, E1α, E1β, and E2, respectively.
FIG. 1.
Schematic representation of the pdh region of the S. mutans genome. Genes are indicated with arrows. IGR indicates an intergenic region. The putative promoter region used for promoter studies is shown at the top of the figure. The region of pdhD replaced with a kan cassette is indicated at the bottom of the figure. The regions used as probes for Northern blots are shown as thick lines.
In the present study, the pdh genes were shown to be transcribed as an operon, and transcription was detected only in stationary phase. In sugar-starved stationary phase, only a small subpopulation of bacteria expressed the pdh operon, as visualized with gfp and yfp promoter probes. This subpopulation appeared to be able to grow and divide even after several days of sugar starvation. Inactivation of the pdh operon eliminated this population and impaired survival in sugar-starved batch cultures and static biofilms. Our results suggest that the PDH complex has an important role during survival of S. mutans.
MATERIALS AND METHODS
Bacterial strains and growth conditions.
The parental strain was S. mutans UA159. The strains tested are listed in Table 1. Strains were stored in 15% glycerol at −76°C and revived by growth overnight at 37°C in 5% CO2 in Todd-Hewitt (TH) broth (Difco, Detroit, MI) in chemically defined medium (CDM) (25) or on TH agar. The CDM was supplemented with glucose or sucrose, as specified in the text. When appropriate, S. mutans was grown in the presence of the following antibiotics at the indicated concentrations: kanamycin, 300 μg/ml; erythromycin, 25 μg/ml. All the cloning procedures were carried out with Escherichia coli DH5α, which was grown in Luria-Bertani lysogeny broth (LB) or on LB agar. The antibiotics and their concentrations used for E. coli were kanamycin at 50 μg/ml and erythromycin at 300 μg/ml.
TABLE 1.
S. mutans strains used
| Straina | Relevant genotype |
|---|---|
| SL13419 | UA159 with pMC19 (yfp*) |
| SL13603 | UA159 with pMC31 (Ppdh-yfp*) |
| SL14043 | ΔpdhD::kan |
| SL14918 | UA159 with pJAR2 (gfp-mut3b*) |
| SL15013 | UA159 with pMC49 (Ppdh-gfp-mut3b*) |
All strains were constructed in the S. mutans UA159 background and were developed for this study.
Batch culture growth and survival.
Overnight cultures grown in CDM with 24 mM glucose were diluted 25-fold into fresh CDM containing a limiting concentration of glucose (6 mM) or sucrose (3 mM). Cultures were incubated in stationary culture tubes in a 5% CO2 incubator at 37°C, and growth was monitored with a BioMate 3 spectrophotometer (Thermo Electron Scientific Instrument Corporation) to measure the optical density (OD) at 675 nm (OD675). For determination of survival, samples were removed, serial dilutions were made in phosphate-buffered saline (PBS; 137 mM NaCl, 2.7 mM KCl, 4.3 mM Na2HPO4, 1.4 mM KH2PO4), and samples were plated onto TH agar.
Static biofilm growth and survival.
Static biofilms of S. mutans were established in 24-well plates containing 12-mm-diameter sterile coverslips (Fisherbrand; Fisher Scientific, Pittsburgh, PA). S. mutans was inoculated in 5 ml CDM containing 24 mM glucose and incubated overnight at 37°C in a 5% CO2 incubator. These cultures were diluted 25-fold into fresh CDM containing 24 mM glucose and incubated for 4 to 6 h. The bacteria were harvested by centrifugation, washed twice with 5 ml PBS, and then diluted to an estimated OD675 of 0.001 in CDM containing 3 mM sucrose or 6 mM glucose. Each well was inoculated with 2 ml of culture, and the plates were incubated at 37°C in a 5% CO2 incubator (1).
To monitor biofilm survival, supernatant was removed and the well was washed twice with 1 ml PBS to remove planktonic bacteria. The biofilm-covered coverslip was taken from the chamber with sterile forceps and placed in 5 ml PBS in a 15-ml conical tube, which was kept on ice. To disperse bacteria from the biofilm, the coverslip was sonicated using a cell disrupter (Sonic Dismembrator, model 500; Fisher Scientific) with a microtip for 20 s at a voltage amplitude of approximately 60%. The suspension was serially diluted in PBS and plated on TH agar. The results were recorded as the numbers of CFU per well.
RNA isolation from batch cultures.
Strains were grown overnight in 5 ml CDM containing 24 mM glucose with 5% CO2 at 37°C. Cultures were diluted 25-fold in two 50-ml tubes containing CDM supplemented with 6 mM glucose. One culture was allowed to reach mid-exponential phase (OD675, ∼0.2), whereas the other culture was incubated for 24 h. The total RNA was extracted from both cultures using the hot phenol-chloroform method (modified from the methods of Shaw and Clewell, 1985 [23]). Briefly, cell pellets were collected by centrifugation and resuspended in 1.4 ml lysis buffer (20 mM Tris, pH 8.0, 3 mM EDTA, 200 mM NaCl, 0.5% SDS in diethyl pyrocarbonate [DEPC]-treated water). The mixtures were added to tubes containing 1.6 g of zirconia silica beads (Bio Spec Products Inc.) and shaken at 4,800 rpm for four periods of 1 min each (Mini BeadBeater; Bio Spec Products Inc.). The lysates were extracted three times with an equal volume of 65°C acid phenol (Fisher Scientific). An equal volume of hot phenol was added and the tubes were incubated for 3 min at 65°C, followed by 5 min at 4°C, and then the phases were separated by centrifugation at 15,000 rpm at 4°C. The hot phenol treatment was repeated twice. The aqueous layer was extracted with an equal volume of chloroform-isoamyl alcohol (24:1) and nucleic acids were precipitated with 0.1 volumes of 3 M sodium acetate, pH 5.2, and 98% ice-cold ethanol (2:1, vol/vol). The samples were incubated at −20°C for 1 to 2 h and centrifuged at 15,000 rpm for 20 min at 4°C to harvest the RNA. The RNA pellet was washed twice with ice-cold 70% ethanol in DEPC-treated water and treated with DNase for 30 min at 37°C. The enzyme was then heat inactivated at 55°C for 15 min, and the RNA was stored at −76°C.
Northern blotting.
RNA (10 μg of total RNA, as estimated from the OD260) was fractionated by denaturing agarose gel electrophoresis, and Northern blotting was performed as described previously (20). Digoxigenin (DIG)-dUTP-labeled probes for the genes of interest were generated by PCR using the primer pairs listed in Table 2. Hybridization of the probes was visualized using the chemiluminescent substrate disodium-3-(4-methoxyspiro{1,2-dioxetane-3,2′-(5-chloro)tricyclo[3.3.1.23,7]decan}-4-yl)phenyl phosphate (CSPD; Roche, Indianapolis, IN) and autoradiography.
TABLE 2.
Primers used in this study
| Region | Primera | Sequence (5′-3′) |
|---|---|---|
| 3′ pdhD | 3 pdhD Fw. 1 | GCATCCATGGGTGAAGAGGAGGCTAAAGAA |
| 3 pdhD Rev. 2 | GCTCATATGCATGCTTATACATATCTTTAG | |
| 5′ pdhD | Ppdh Fw. 1 | TGAAGCTTATGCCGTATTTGTTAGC |
| Ppdh Rev. 2 | GATGGTCGACAGTTAGAAAACCCTTTG | |
| pdhA Northern blot probe | pdhA Fw. 1 | ACGGCAAAGAGATCTTTCCCATTAA |
| pdhA Rev. 2 | GCATGATGGCTGAAATTTTTGGCAAG | |
| pdhB Northern blot probe | pdhB Fw. 1 | CAACTGTTCTAAGATCAATGACTTCA |
| pdhB Rev. 2 | GGTGGCAAGGCAAAAGTGCCGATGA | |
| pdhC Northern blot probe | pdhC Fw. 1 | AGGAACGACCAAACCATCACTCAAA |
| pdhC Rev. 2 | CAGCTTTAAGTGCTCCAACAAATGT | |
| pdhD Northern blot probe | pdhD Fw. 1 | TAGCATATAACTTTCCGTCAAGTCAC |
| pdhD rev. 2 | GGTTATCATTGGTGGGGGTGTTATT | |
| Ppdh | PpdhFw. 5 PvuI | GCTCCGATCGCAGTTAGAAAACCCTTTGGCT |
| Ppdh Rev. 4 BglII | CCAGAGATCTATGCCGTATTTGTTAGC |
Fw., forward; Rev., reverse.
Transformation of S. mutans.
S. mutans was transformed using the method of Lindler and Macrina (14). Briefly, a 5-ml culture of S. mutans UA159 was grown overnight in CDM containing 24 mM glucose or in TH broth at 37°C in 5% CO2. The overnight culture was diluted 25-fold into fresh TH broth or CDM containing 10% glucose and 10% heat-inactivated horse serum (MP Biomedicals, Inc.) (18). The bacteria were incubated at 37°C for up to 3.5 h, a time reported to give the optimal transformation of S. mutans (14). A 0.5-ml volume of this culture was transferred to a 13-ml culture tube, DNA was added (to 0.5 to 10 μg/ml), and the mixture was incubated at 37°C for 2 h. Transformants were selected on TH agar containing the appropriate antibiotic; transformant colonies were generally obtained after 2 days incubation at 37°C in 5% CO2.
Inactivation of pdhD.
The pdhD gene (SMU.1424; http://www.ncbi.nlm.nih.gov/gene/) was inactivated by replacing an 831-bp internal fragment with a kanamycin resistance cassette by double-crossover recombination (Fig. 1). The vector pMC29 was derived from pFW5 (21) by replacing aad9 (spectinomycin resistance) with kan (kanamycin resistance). Upstream (540 bp) and downstream (470 bp) fragments of pdhD were PCR amplified using the primers listed in Table 2. The fragments were cloned into pMC29, yielding pMC44. The structure of the resulting plasmid was confirmed by restriction enzyme digestion. To transform S. mutans, 0.5 μg of pMC44 was linearized with AhdI and added to competent bacteria. Transformants were selected on TH agar containing kanamycin and incubated at 37°C for 2 days. Transformants were checked for the inactivation of pdhD by PCR using the appropriate primers and by Northern blot analysis.
Construction of plasmids encoding fluorescent reporters.
A fragment containing the putative pdh promoter was cloned into the promoterless reporter plasmid pJAR2. The cloned region extended from the 3′ end of the upstream clpB genes (110 bp), through the intergenic region (230 bp) and into the pdhD gene (210 bp) (Fig. 1). The region was amplified by PCR using specific primers (Table 2). It was cloned as a BglII-PvuI fragment into the shuttle plasmid pJAR2, containing gfp-mut3b* (hereafter referred to as gfp and encoding green fluorescent protein [GFP]) (5), to yield pMC49. The same PCR product was cloned as a blunt fragment at the SmaI site in the shuttle plasmid pMC19, containing eyfp, to yield pMC31. pMC19 was derived from pJAR2 by replacing gfp with the gene for the enhanced yellow fluorescent protein (EYFP). The plasmid was passaged and yielded a yfp* gene (hereafter referred to as the yfp gene and encoding yellow fluorescent protein [YFP]) with a spontaneous mutation, A to G at position 521 from the beginning of the open reading frame (ORF), that resulted in a D174G mutation in the protein and enhanced YFP fluorescence.
Confocal microscopy.
To assess the expression of the pdh promoter by using fluorescent reporters in batch cultures, S. mutans was grown in 50-ml Falcon tubes under the specified conditions. At different times, samples were removed from the cultures, concentrated by centrifugation, placed on a glass slide, and covered with a glass coverslip (Fisher Scientific). Bacteria were visualized with a Leica DM IRE2 confocal microscope with a TCS SL system. For GFP visualization, the excitation wavelength was 488 nm and emission was captured at wavelengths between 475 and 575 nm; YFP was excited at 488 nm, and emission was captured at wavelengths between 500 and 625 nm.
Static biofilms of S. mutans containing fluorescent promoter probes were grown on glass coverslips in microtiter plates as described above. At specified times, the supernatants from selected wells were removed and the wells were washed once with 1 ml PBS. The biofilm-covered glass coverslip was removed from the well, placed face down on a 10-well multitest slide (ICN Biomedicals, Inc.), and secured to the slide with hot paraffin. The biofilm was imaged using the Leica DM IRE2 microscope.
RESULTS
Transcription of the pdh genes is induced during stationary phase.
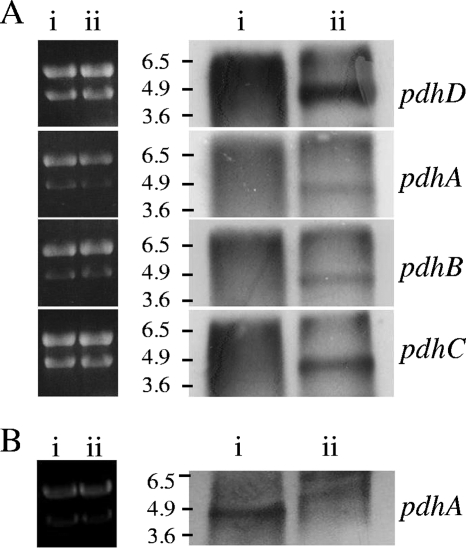
Our attempts at microarray analysis of the genes expressed in stationary phase were generally unsatisfactory, but they did suggest that the four genes of the putative pdh operon were upregulated in stationary phase. We pursued this suggestion by Northern blot analysis. The genes are thought to encode the components of the PDH complex in S. mutans (Fig. 1). We used Northern blots to characterize their transcription. RNA was harvested from mid-exponential and 20-h stationary-phase S. mutans batch cultures. PCR-generated probes for each of the four genes (Fig. 1; Table 2) hybridized to a 4.9-kb band (Fig. 2 A), consistent with the genes forming an operon. This band was detected in extracts from stationary phase but not from exponential phase. The gene at the 5′ end of the group, pdhD, is preceded by an intergenic region (IGR1126) of 230 bp (Fig. 1); the size of the band is consistent with the promoter being contained in this fragment (see below). We saw no evidence of additional internal promoters within the operon on Northern blots from the parental strain, nor was mRNA for any of the genes detected in RNA extracts from a mutant in which pdhD had been replaced by a kan cassette (pdhA probe shown; Fig. 2B).
FIG. 2.
Northern blot analysis of pdh expression. Analysis of RNA isolated from batch cultures. (A) RNA isolated from S. mutans UA159 during exponential growth (lanes i) and 20 h into stationary phase (lanes ii). Ten micrograms of RNA was loaded for each sample. Ethidium bromide staining (left side) was used to confirm equal loading of the genes. The blots (right side) are on a different scale. The probes used for each blot were for internal portions of the pdh operon genes (Fig. 1) and are indicated to the right of each blot. A probe for an exponential-phase gene bound to the RNA prepared from the parental strain confirmed the quality of the RNA (data not shown). (B) Comparison of RNA isolated from 20-h stationary-phase cultures of strain UA159 (i) and ΔpdhD mutant SL14043 (ii) and probed for pdhA. The positions of size markers (in kb) are indicated on the left side of the Northern blots.
The pdh promoter is expressed only in a subpopulation of bacteria in stationary phase.
To analyze expression of the pdh operon further, reporters that encoded derivatives of green fluorescent protein (gfp) and yellow fluorescent protein (yfp) were used. The region immediately upstream of the pdh operon (Fig. 1) was cloned into the shuttle plasmids upstream of either gfp or yfp. In no case did strains with the promoterless plasmid display any GFP or YFP fluorescence, although weak autofluorescence from S. mutans was detected. In addition to revealing specific expression of the pdh operon, the fluorescent reporter system was also valuable in confirming that the region of DNA indeed harbored a promoter.
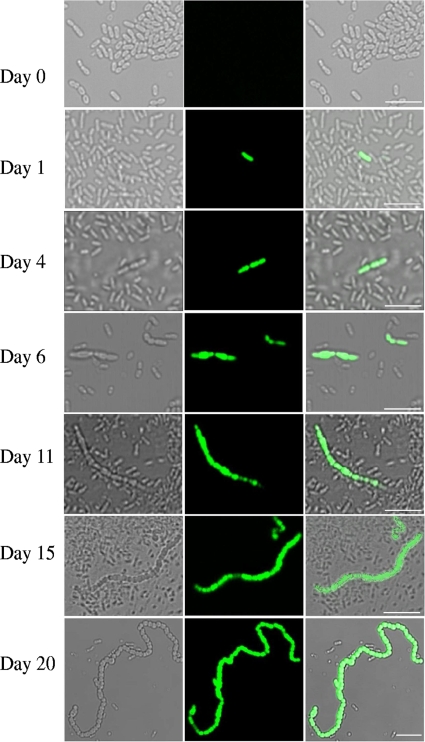
We did not detect a fluorescent signal from the pdh promoter in any field screened (>20,000 cells) when the bacteria were growing exponentially in batch cultures in CDM with 6 mM glucose. However, about 24 h after sugar depletion, expression of Ppdh-gfp became evident in a small subpopulation (about 0.5%) in the S. mutans cultures (Fig. 3; Table 3), and those bacteria exhibited strong fluorescence. At this time, the viable plate count was approximately the same as that at the end of exponential growth (∼109/ml), so that most bacteria were viable but were not expressing GFP. The proportion of bacteria expressing GFP remained at about 0.1 to 1.0% of the population for at least 30 days of starvation (Table 3). The presence of the few pdh-expressing bacteria could potentially be the consequence either of mutation or of bimodal pdh expression within a genetically homogeneous population. To distinguish between these possibilities, we used four colonies derived from survivors from two different 10-day cultures to inoculate fresh batch medium. The bacteria recovered from the 10-day cultures behaved in the same way as those in the original cultures: no pdh expression was detected during exponential growth, and in stationary phase, 0.1 to 1% of the population displayed Ppdh-gfp activity, extending at least for 10 days. Thus, there was no evidence of mutation to a high level of pdh promoter activity. Rather, the population displayed bimodal pdh expression: most of the population displayed no activity, with a few bacteria displaying strong activity (Fig. 3); however, we cannot exclude the possibility that some weakly expressing bacteria were missed, particularly when expression was first detected. The realization that few bacteria expressed pdh helps explain why a large amount of RNA and long exposure times (greatly in excess of what was needed to detect the vegetatively expressed rpsT locus; data not shown) had to be used for the Northern blots.
FIG. 3.
Expression of gfp from the pdh promoter is limited to a subpopulation in sugar-starved batch cultures. Strain SL15013 was grown in CDM with 6 mM glucose at 37°C in a 5% CO2 incubator. Samples were removed at the time indicated to the left, given as days in stationary phase. (Left) Differential interference contrast image; (center) GFP fluorescence; (right) merged image. Bars, 5 μm.
TABLE 3.
Expression of GFP from Ppdh-gfp in sugar-starved stationary-phase batch culturesa
| Day in stationary phase | Total no. of bacteria counted | No. of bacteria expressing GFP | % bacteria expressing GFP |
|---|---|---|---|
| 1 | 33,006 | 14 | 0.04 |
| 2 | 19,821 | 27 | 0.14 |
| 4 | 16,287 | 32 | 0.19 |
| 6 | 29,428 | 148 | 0.50 |
| 8 | 6,544 | 52 | 0.79 |
| 11 | 24,407 | 152 | 0.62 |
| 15 | 9,469 | 39 | 0.41 |
| 30 | 17,632 | 35 | 0.19 |
Strain SL15013 was inoculated in CDM with 6 mM glucose and incubated at 37°C. On different days, 3-μl samples of the culture were removed, placed on a glass slide, and imaged using a confocal microscope. Images of the samples were randomly captured, and the number of fluorescent bacteria was determined as a portion of the total number of bacteria using the Adobe Photoshop analyzing tool.
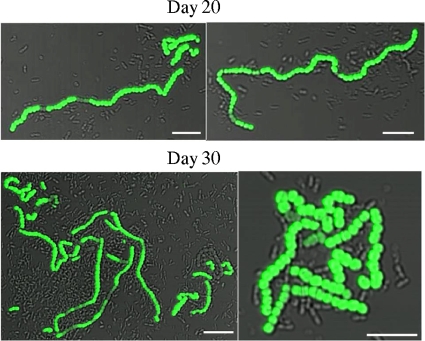
When GFP-expressing bacteria were first detected, after 1 day of starvation, the bacteria were found to be isolated organisms or were found to occur in pairs. However, with increasing times of starvation, the GFP-expressing bacteria were observed in progressively longer chains (Fig. 3; Table 4). By day 6, some of the bacteria expressing the pdh promoter were in chains of six or more. Substantially longer chains were apparent at day 15 (Fig. 3; Table 4). Indeed, from day 15 onwards, some very long chains of GFP-expressing bacteria were observed (Fig. 4; the examples shown are from different experiments). Similar behavior was exhibited by a strain containing a different reporter, Ppdh-yfp (Fig. 5). In the later samples, the individual GFP- and YFP-expressing bacteria (strains SL15013 and SL13603, respectively) appeared to be larger than the nonexpressing bacteria (Fig. 3 to 5).
TABLE 4.
Distribution of chain lengths of bacteria expressing GFP from Ppdh-gfp at different times during stationary phasea
| Day in stationary phase | No. of chains of the indicated cell lengthb |
|||||||||
|---|---|---|---|---|---|---|---|---|---|---|
| 1 | 2 | 3 | 4 | 5 | 6 | 7 | 8 | 9 | 10+ | |
| 1 | 77 | 34 | ||||||||
| 2 | 80 | 40 | 2 | 2 | ||||||
| 4 | 11 | 5 | 6 | 0 | 0 | 0 | 1 | |||
| 6 | 30 | 28 | 6 | 7 | 6 | 2 | 1 | 0 | 3 | |
| 8 | 40 | 67 | 29 | 27 | 8 | 3 | 0 | 0 | 1 | |
| 11 | 147 | 46 | 15 | 12 | 4 | 2 | 2 | 2 | 0 | 4 |
| 15 | 23 | 15 | 11 | 13 | 12 | 8 | 3 | 5 | 5 | 5 |
| 30 | 24 | 34 | 15 | 10 | 7 | 3 | 3 | 2 | 1 | 10 |
Strain SL15013 was inoculated in CDM containing 6 mM glucose. On the indicated days, 500- to 700-μl samples of the culture were removed and centrifuged at 5,000 rpm for 3 min. The supernatant was discarded; and the pellet was gently loosened, placed on a glass slide, and imaged using a confocal microscope. Pilot experiments indicated that this treatment did not affect the chain length (data not shown). Images of the bacteria were collected and analyzed.
The GFP-expressing bacteria were counted and are organized in the table on the basis of the chain length of the expressing bacteria.
FIG. 4.
Bacteria expressing pdh in older cultures are often present in long chains. Representative images of strain SL15103 taken from cultures that have been in stationary phase for 20 or 30 days are shown. An overlay of GFP fluorescence on differential interference contrast images is shown. Note that the images have different magnifications. Bars, 5 μm.
FIG. 5.
Expression of yfp from the pdh promoter is limited to a subpopulation in sugar-starved batch cultures. Strain SL13603 was grown in CDM with 6 mM glucose at 37°C in a 5% CO2 incubator. Samples were removed at the time indicated at the top of each panel, given as days in stationary phase. An overlay of YFP fluorescence on differential interference contrast images is shown. Bars, 5 μm.
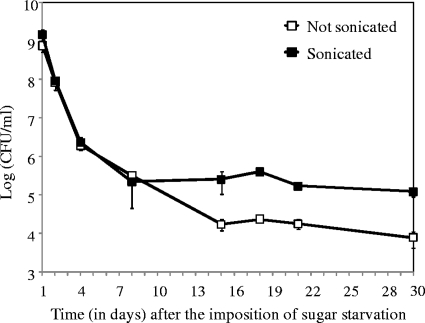
At later times in stationary phase, the viable plate count had declined to about 104/ml (Fig. 6). This count increased to about 105/ml following mild sonication, consistent with viable bacteria being in chains. In contrast, mild sonication had little effect at earlier times (Fig. 6), when GFP-expressing bacteria were predominantly single or in pairs. The increasing lengths of the chains with time in stationary phase are suggestive of cell growth and division during stationary-phase survival. However, there was no corresponding increase in the viable plate count over time (Fig. 6, sonicated samples), so that any growth and division of some bacteria were presumably balanced by the death of others.
FIG. 6.
Effect of mild sonication on the culturable count of batch cultures of strain SL15103 after different times in sugar-starved stationary phase. At the indicated times in stationary phase, bacteria were diluted and plated on TH agar. Three parallel cultures were followed, and samples were removed from each culture and plated in duplicate. Bars represent standard deviations.
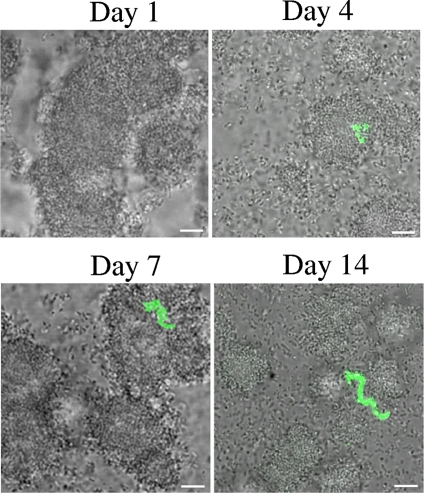
Bacteria in static biofilms displayed behavior similar to those in batch cultures, except that expression of the pdh reporter was first detected at a later time after imposition of sugar starvation. The static biofilms were established in CDM with 3 mM sucrose. GFP expression was first detected 4 days after inoculation in chains of bacteria of various lengths (between 3 and 10 bacteria/chain) (Fig. 7). This pattern remained for as long as the biofilms were maintained (14 days). The chains appeared within biofilm microcolonies or on microcolony surfaces and were not removed by washing the biofilm. Only a minority of bacteria displayed the signal, but quantitation was difficult and we did not obtain an accurate count of the proportion. The lengths of the chains appeared to increase gradually over time (from ∼5 to 10 bacteria/chain on day 4 to more than 10 bacteria/chain by day 14; Fig. 7).
FIG. 7.
Expression of gfp from the pdh promoter in biofilms. Representative images of static biofilms of S. mutans SL15013 established with CDM containing 3 mM sucrose are shown. Cultures were inoculated in 24-well plates containing sterile 12-mm-diameter glass coverslips. The plates were incubated at 37°C in 5% CO2. At the indicated times, the coverslips were washed with PBS and imaged. An overlay of GFP fluorescence on differential interference contrast images is shown. Bars, 5 μm.
Inactivation of pdhD impaired survival.
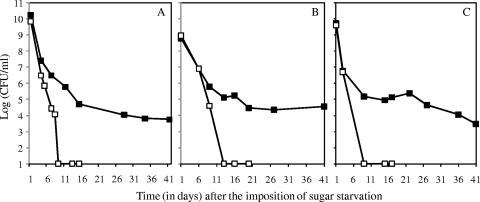
To test for a role of the PDH complex in S. mutans survival, we deleted the first gene of the pdh operon, pdhD, and replaced it with a kanamycin resistance cassette (Fig. 1). Mutant colonies were indistinguishable from those of the parental strain, and the pdhD mutant was not impaired in growth in different liquid media. The Ppdh-gfp fusion, which was located on a plasmid, was not expressed in the pdh mutant (data not shown), suggesting feedback regulation of Ppdh expression. The pdhD mutation impaired survival in batch cultures grown in CDM with 6 mM glucose. The results of a representative experiment are shown in Fig. 8 A, in which the mutant survived for only 6 days, whereas the parental strain survived for at least 41 days. The mutant also survived poorly with 3 mM sucrose as the source of carbohydrate. The results of a representative experiment, in which the pdhD mutant survived for less than 13 days, whereas the parental strain survived for over 41 days, are shown in Fig. 8B. In static biofilms, the pdhD mutation also severely compromised survival. Biofilms were established in CDM with 3 mM sucrose. The parental strain maintained viability for over 41 days, whereas the pdhD mutant was not viable beyond 10 days (Fig. 8C). The starting pH of the medium for the experiments described above was 6.5. In various experiments under the different conditions, including those whose results are shown in Fig. 8, the pH fell to between 5.5 and 6.0 by 20 h in stationary phase. Thereafter, it remained in the range of 5.5 to 6.0 for the duration of the experiments for both the pdhD mutant (to 10 to 15 days) and the parental strain (to 30 to 41 days).
FIG. 8.
Effect of a ΔpdhD mutation on the survival of S. mutans. (A) Batch cultures grown in CDM plus 6 mM glucose; (B) batch cultures grown in CDM plus 3 mM sucrose; (C) static biofilms grown in CDM plus 3 mM sucrose. At the indicated times in stationary phase, bacteria were diluted and plated on TH agar. The limit of detection was 10 CFU/ml; samples with counts below that limit of detection are arbitrarily indicated as having a log number of CFU/ml of 1. Filled squares, S. mutans UA159; open squares, Δpdh mutant SL14043. In each case, the results of a representative experiment of at least three experiments are shown.
PDH is a central enzyme of metabolism that can allow the fermentation of pyruvate to acetate with the production of ATP. The effect of the pdh mutation on acetate formation was determined. The standard CDM contains 72.8 mM acetate, which would swamp any acetate potentially produced by S. mutans metabolizing 6 mM glucose. Consequently, a modified form of CDM that lacked acetate was used. We saw no evidence of increased pdh expression in the medium that lacked acetate (unpublished data). The pdh mutant remained compromised in its survival in CDM lacking acetate. However, no difference in the amount of acetate or formate produced was detected between the parental strain and the pdh mutant (data not shown). The failure to detect any difference most likely reflects the fact that less than 1% of the bacteria expressed pdh in stationary phase rather than the possibility that pdh does not encode the PDH complex or that the complex was not enzymatically active. Given the various roles of the PDH complex (8), we also cannot exclude the possibility that it is some regulatory function of the complex, rather than its enzymatic activity, that is important for the persistence of S. mutans in stationary phase.
DISCUSSION
S. mutans is adapted to a lifestyle that involves frequent and, under some circumstances, long periods of starvation (2, 3). Since carbohydrates are central to the metabolism of S. mutans, it may have mechanisms that cope with the lack of a carbon source. By identifying the genes that are expressed after the imposition of sugar starvation, we wished to uncover and characterize those mechanisms. We report here on our investigation of the role in stationary phase of the pdh genes, which putatively encode the PDH complex. Our principal findings are, first, that the pdh genes form an operon that is expressed only in stationary phase; second, that the pdh operon is important for survival; third, that pdh is expressed only in a small subpopulation of bacteria; and fourth, that the subpopulation appears to be able to grow and divide even after several days of starvation for sugar. We are not aware of a comparable study indicating division of long-term-persisting bacteria.
The genes thought to encode the PDH complex are arranged contiguously on the S. mutans genome in the order pdhD-pdhA-pdhB-pdhC, encoding the E3, E1α, E1β, and E2 subunits, respectively (http://www.ncbi.nlm.nih.gov/sites/entrez). Probes for each of the four genes hybridized to a 4.9-kb band in Northern blots, which agrees well with the size of the putative four-gene operon (Fig. 2A). Consistent with transcription as an operon, deletion of the first gene, pdhD, abolished expression of all four genes, indicating that there were no internal promoters in the operon. The operon was expressed only during stationary phase. Our results agree with and extend those of Korithoski et al. (12), who investigated the role of PdhA in acid tolerance. They reported a dramatic increase in the level of transcription of pdhA in stationary phase (12).
Deletion of pdhD led to a substantial decrease in the rate of survival of S. mutans under various conditions of sugar starvation (Fig. 8). Interestingly, Korithoski et al. reported that inactivation of pdhA, the second gene in the operon, resulted in an acid-sensitive phenotype (12). They found that acidification induced expression of pdhA and that the mutant grew poorly at pH 5.0. However, at neutral pH, the growth rate of the mutant was the same as that of the parental strain, as we have found for the pdhD mutant. S. mutans uses glycolysis, which generates ATP and pyruvate, as the main pathway of sugar metabolism. For a long time, it was considered to be a homofermenter, converting pyruvate mainly to lactic acid. However, under sugar-limited conditions, it is a heterofermenter, with acetate, formate, and ethanol also being produced (4). PDH converts pyruvate to acetyl-CoA. Acetyl-CoA can be converted to acetyl phosphate and then to acetate with the production of ATP. Under sugar-limited conditions, this pathway could clearly benefit the bacteria, since it produces ATP. PDH also produces NADH, so that an additional and/or alternative benefit of PDH action might be the maintenance of redox balance. Probably because the pdh operon is expressed in less than 1% of the population, we detected no clear distinction in the metabolic products between cultures of UA159 and those of the pdhD mutant. Because of the lack of biochemical data associated with the low proportion of expressers, we cannot be certain that the pdh operon indeed encodes the PDH complex, although sequence similarity suggests that it does. Our results demonstrate an important role for the pdh operon in the persistence of S. mutans in stationary phase in both batch cultures and static biofilms; the PDH complex putatively fulfills that important role.
We used gfp and yfp reporters to observe expression of the pdh promoter under various conditions. We found the promoter to be in the region from positions −350 to +218 relative to the translation start of the pdhD ORF (Fig. 1). Promoter activity was detected in stationary-phase bacteria in both batch cultures and biofilms, but not in bacteria growing exponentially. The proportion of stationary-phase bacteria displaying Ppdh activity in batch cultures remained at about 0.1 to 1.0% of the population for the duration of the experiments; in some cases, this extended to 30 days. During this time, the viable count declined to about 105/ml. However, there was comparatively little lysis of dead cells, so that at later time points, the fluorescent cells may well account for a high proportion of the viable cells, suggesting that pdh expression conferred a selective advantage in long-term survival. Indeed, the pdhD mutant did not survive beyond about 10 days in stationary phase in either batch cultures or static biofilms (Fig. 8). The pdh-expressing bacteria were mostly individual bacteria in cultures 24 h after the entry into stationary phase. Progressively longer chains of expressing bacteria were observed with time (Table 4), suggesting that the pdh-expressing subpopulation was slowly growing.
Stationary phase has traditionally been used to describe the state after exponential phase growth. Studies on stationary phase in various bacterial species suggest that “stationary phase” encompasses a number of physiologic states, ranging from a slow death of the culture to dormant cells, metabolically active cells, and slowly growing cells (10, 13). The observation of an increased chain length of a subpopulation expressing an operon important for survival strongly suggests the slow growth of S. mutans during stationary phase. Under the conditions employed, bacteria entered stationary phase because the exogenous sugar has been used up (22). Consequently, the pdh-expressing and, apparently, dividing bacteria within the population are presumably using other energy sources such as amino acids, the autolysis products of dead siblings (9), or previously secreted metabolites.
Bacteria from colonies recovered from 10-day cultures behaved in the same way as the original strain: they yielded about 0.1 to 1% GFP-expressing bacteria in stationary phase in cultures maintained for up to 10 days. These experiments indicate that the few expressing cells were probably not the result of mutants arising in the population but rather indicate a bistable distribution of expression within a genetically homogeneous population. The expression pattern of the pdh promoter in static biofilms also indicated bistability, with only a minority expressing GFP. We detected no Ppdh-gfp expression in a pdh mutant, suggestive of a feedback loop regulating pdh expression. Such loops are integral to bistable gene expression (7, 26), but the nature of any regulatory circuit for pdh here remains speculative. Perry et al. have recently reported another example of bistability in S. mutans, in the expression of the CSP-ComDE circuit (19). A number of examples of bistable behavior in other species have been reported (7, 26). Such behavior has been termed “bet hedging.” Under the conditions employed here, we infer that the pdh expressers win the bet, surviving long periods of starvation, and the nonexpressers lose. Because of the periodic influx of nutrients, long-term starvation is not generally associated with oral bacteria. However, bacteria embedded deep in crevices within the dental plaque may not see those nutrients because of competition from bacteria nearer the plaque surface and may indeed be subject to long-term starvation. Nevertheless, in the typical feast-or-famine lifestyle of most oral microorganisms, the periods of starvation are likely to be relatively short. Under those conditions, the pdh nonexpressers may be better able to respond than their expressing siblings to nutrient restoration after short periods of starvation; the nonexpressers would win the bet. Thus, the bistable behavior would indeed be bet hedging and could have a selective advantage. The ability to directly observe the surviving population by increases in chain length may provide a valuable research tool for understanding the continued metabolism and growth of surviving S. mutans populations and, more generally, the behavior of persisting bacteria.
Acknowledgments
This work was supported by Public Health Service grant DE014604 to P.J.P. from the National Institutes of Health. Microarrays were obtained through NIH's Pathogen Functional Resource Center, through NIDCR.
We thank Jim Burns for helpful discussions.
Footnotes
Published ahead of print on 25 June 2010.
REFERENCES
- 1.Busuioc, M., K. Mackiewicz, B. A. Buttaro, and P. J. Piggot. 2009. Role of intracellular polysaccharide in persistence of Streptococcus mutans. J. Bacteriol. 191:7315-7322. [DOI] [PMC free article] [PubMed] [Google Scholar]
- 2.Carlsson, J. 1997. Bacterial metabolism in dental biofilms. Adv. Dent. Res. 11:75-80. [DOI] [PubMed] [Google Scholar]
- 3.Carlsson, J. 1970. Nutritional requirements of Streptococcus mutans. Caries Res. 4:305-320. [DOI] [PubMed] [Google Scholar]
- 4.Carlsson, J., U. Kujala, and M. B. Edlund. 1985. Pyruvate dehydrogenase activity in Streptococcus mutans. Infect. Immun. 49:674-678. [DOI] [PMC free article] [PubMed] [Google Scholar]
- 5.Chary, V. K., M. Busuioc, J. A. Renye, Jr., and P. J. Piggot. 2005. Vectors that facilitate the replacement of transcriptional lacZ fusions in Streptococcus mutans and Bacillus subtilis with fusions to gfp or gusA. FEMS Microbiol. Lett. 247:171-176. [DOI] [PubMed] [Google Scholar]
- 6.Colby, S. M., and R. R. Russell. 1997. Sugar metabolism by mutans streptococci. Soc. Appl. Bacteriol. Symp. Ser. 26:80S-88S. [PubMed] [Google Scholar]
- 7.Dubnau, D., and R. Losick. 2006. Bistability in bacteria. Mol. Microbiol. 61:564-572. [DOI] [PubMed] [Google Scholar]
- 8.Gao, H., X. Jiang, K. Pogliano, and A. I. Aronson. 2002. The E1beta and E2 subunits of the Bacillus subtilis pyruvate dehydrogenase complex are involved in regulation of sporulation. J. Bacteriol. 184:2780-2788. [DOI] [PMC free article] [PubMed] [Google Scholar]
- 9.Gonzalez-Pastor, J. E., E. C. Hobbs, and R. Losick. 2003. Cannibalism by sporulating bacteria. Science 301:510-513. [DOI] [PubMed] [Google Scholar]
- 10.Hayes, C. S., and D. A. Low. 2009. Signals of growth regulation in bacteria. Curr. Opin. Microbiol. 12:667-673. [DOI] [PMC free article] [PubMed] [Google Scholar]
- 11.Henderson, C. E., and R. N. Perham. 1980. Purification of the pyruvate dehydrogenase multienzyme complex of Bacillus stearothermophilus and resolution of its four component polypeptides. Biochem. J. 189:161-172. [DOI] [PMC free article] [PubMed] [Google Scholar]
- 12.Korithoski, B., C. M. Levesque, and D. G. Cvitkovitch. 2008. The involvement of the pyruvate dehydrogenase E1alpha subunit, in Streptococcus mutans acid tolerance. FEMS Microbiol. Lett. 289:13-19. [DOI] [PubMed] [Google Scholar]
- 13.Lewis, K. 2007. Persister cells, dormancy and infectious disease. Nat. Rev. Microbiol. 5:48-56. [DOI] [PubMed] [Google Scholar]
- 14.Lindler, L. E., and F. L. Macrina. 1986. Characterization of genetic transformation in Streptococcus mutans by using a novel high-efficiency plasmid marker rescue system. J. Bacteriol. 166:658-665. [DOI] [PMC free article] [PubMed] [Google Scholar]
- 15.Loesche, W. J. 1986. Role of Streptococcus mutans in human dental decay. Microbiol. Rev. 50:353-380. [DOI] [PMC free article] [PubMed] [Google Scholar]
- 16.Neijssel, O. M., J. L. Snoep, and M. J. Teixeira de Mattos. 1997. Regulation of energy source metabolism in streptococci. Soc. Appl. Bacteriol. Symp. Ser. 26:12S-19S. [PubMed] [Google Scholar]
- 17.Neveling, U., S. Bringer-Meyer, and H. Sahm. 1998. Gene and subunit organization of bacterial pyruvate dehydrogenase complexes. Biochim. Biophys. Acta 1385:367-372. [DOI] [PubMed] [Google Scholar]
- 18.Perry, D., and H. K. Kuramitsu. 1981. Genetic transformation of Streptococcus mutans. Infect. Immun. 32:1295-1297. [DOI] [PMC free article] [PubMed] [Google Scholar]
- 19.Perry, J. A., D. G. Cvitkovitch, and C. M. Levesque. 2009. Cell death in Streptococcus mutans biofilms: a link between CSP and extracellular DNA. FEMS Microbiol. Lett. 299:261-266. [DOI] [PMC free article] [PubMed] [Google Scholar]
- 20.Podbielski, A., A. Flosdorff, and J. Weber-Heynemann. 1995. The group A streptococcal virR49 gene controls expression of four structural vir regulon genes. Infect. Immun. 63:9-20. [DOI] [PMC free article] [PubMed] [Google Scholar]
- 21.Podbielski, A., B. Spellerberg, M. Woischnik, B. Pohl, and R. Lutticken. 1996. Novel series of plasmid vectors for gene inactivation and expression analysis in group A streptococci (GAS). Gene 177:137-147. [DOI] [PubMed] [Google Scholar]
- 22.Renye, J. A., Jr., P. J. Piggot, L. Daneo-Moore, and B. A. Buttaro. 2004. Persistence of Streptococcus mutans in stationary-phase batch cultures and biofilms. Appl. Environ. Microbiol. 70:6181-6187. [DOI] [PMC free article] [PubMed] [Google Scholar]
- 23.Shaw, J. H., and D. B. Clewell. 1985. Complete nucleotide sequence of macrolide-lincosamide-streptogramin B-resistance transposon Tn917 in Streptococcus faecalis. J. Bacteriol. 164:782-796. [DOI] [PMC free article] [PubMed] [Google Scholar]
- 24.Snoep, J. L., M. J. Teixeira de Mattos, M. J. Starrenburg, and J. Hugenholtz. 1992. Isolation, characterization, and physiological role of the pyruvate dehydrogenase complex and alpha-acetolactate synthase of Lactococcus lactis subsp. lactis bv. diacetylactis. J. Bacteriol. 174:4838-4841. [DOI] [PMC free article] [PubMed] [Google Scholar]
- 25.Terleckyj, B., N. P. Willett, and G. D. Shockman. 1975. Growth of several cariogenic strains of oral streptococci in a chemically defined medium. Infect. Immun. 11:649-655. [DOI] [PMC free article] [PubMed] [Google Scholar]
- 26.Veening, J. W., W. K. Smits, and O. P. Kuipers. 2008. Bistability, epigenetics, and bet-hedging in bacteria. Annu. Rev. Microbiol. 62:193-210. [DOI] [PubMed] [Google Scholar]
- 27.Wolin, M. J. 1964. Fructose-1,6-diphosphate requirement of streptococcal lactic dehydrogenases. Science 146:775-777. [DOI] [PubMed] [Google Scholar]
- 28.Yamada, T., and J. Carlsson. 1975. Regulation of lactate dehydrogenase and change of fermentation products in streptococci. J. Bacteriol. 124:55-61. [DOI] [PMC free article] [PubMed] [Google Scholar]


