

Abstract
To study whether cerebral mycobacterial infection induces granuloma and protective immunity similar to systemic infection, we intracerebrally infected mice with Mycobacterium bovis bacilli Calmette-Guerin. Granuloma and IFN-γ+CD4+ T cell responses are induced in the central nervous system (CNS) similar to periphery, but the presence of IFN-γIL-17 double-positive CD4+ T cells is unique to the CNS. The major CNS source of TNF-α is microglia, with modest production by CD4+ T cells and macrophage. Protective immunity is accompanied by accumulation of Foxp3+CD4+ T cells and PD-L2+ dendritic cells, suggesting that both inflammatory and anti-inflammatory responses develop in the CNS following mycobacterial infection.
Keywords: Mycobacterial infection, CNS, BCG, IL-17, IFN-γ, regulatory T cells, dendritic cells and microglia
1. INTRODUCTION
Mycobacterium tuberculosis (Mtb) has become the most common intracellular bacterium to infect the central nervous system (CNS) (Drevets et al., 2004). Despite the serious consequences following mycobacterial infection of the CNS, our understanding of the neuro- and immunopathogenesis of cerebral mycobacterial infection is limited.
Current knowledge of the immune response elicited by mycobacterial infection has come mainly from studies with respiratory or non-respiratory mycobacterial infection models (Flynn, 2006; Gupta and Katoch, 2005). Since these infection models do not express evident pathology in the CNS, an intracerebral infection model is needed to study the immune response against mycobacterial infection in the CNS. Previously, a rabbit model of intracisternal acute mycobacterial infection demonstrated prominent mononuclear cell infiltration, extended perivascular inflammation, and high TNF-α levels in the cerebrospinal fluid (CSF) (Tsenova et al., 1999; Tsenova et al., 1998). However, the cell-mediated immune responses that accompany this have not been fully characterized due to the rapid course of disease. In mice, infiltration of mononuclear cells and activation of microglia were observed in parallel with mycobacterial growth in the CSF following intracerebral (i.c.) inoculation with Mycobacterium bovis bacilli Calmette-Guerin (BCG) (Mazzolla et al., 2002). I.c. inoculation of FVBN mice with Mtb H37Rv resulted in granuloma formation and robust lymphocytic infiltration in the CNS (Rock et al., 2008). While all these models contribute to the understanding of mycobacterial pathogenesis in the CNS, further studies are needed to gain a better understanding of cell-mediated immune responses and bacterial containment in the CNS.
In the present study we investigated cell-mediated immune responses during i.c. BCG infection with emphasis on the difference between CNS and peripheral immunity. To do so, we infected C57BL/6 mice i.c. with live BCG and studied the cellular composition and distribution of infiltrating cells into the CNS. The protective immune responses in the brain during the course of i.c. BCG infection were characterized by assessing mycobacterial growth, evaluating the phenotype of infiltrating lymphocytes, and quantifying the production of inflammatory cytokines, including TNF-α, IFN-γ, and IL-17. We demonstrate that CNS infiltrating CD4+ T cells produced IFN-γ or IL-17. Additionally, approximately half of the IL-17-producing cells also produced IFN-γ. TNF-α was produced by CD4+ T cells, macrophages, and microglia. Development of protective immune responses was accompanied by increased accumulation of regulatory Foxp3+CD4+ T cells and PD-L2+ dendritic cells (DCs). Taken together, these data demonstrate that cerebral BCG infection induces protective immunity, potentially contributing to the development of therapies against cerebral mycobacterial infections.
2. METERIALS AND METHODS
Mice
Female C57BL/6 mice were purchased from The Jackson Laboratory (Bar Harbor, ME) and maintained at the Animal Care Facility at the University of Wisconsin, Madison. All experiments were carried out in accordance with guidelines of the National Institutes of Health and the University of Wisconsin Medical School Animal Care and Use Committee.
Bacteria
Frozen stocks were grown and prepared for infection as previously described (Hogan et al., 2001). The Pasteur strain of BCG (Staten Serum Institute, Denmark), kanamycin-resistant GFP-expressing BCG, or kanamycin-resistant dsRed-expressing BCG were grown in Middlebrook 7H9 supplemented with 0.05% Tween 80 and 10% oleic acid-dextrose-catalase supplement (Difco, Detroit, MI) in the presence or absence of kanamycin (50 μg/mL) and stored in frozen aliquots at -80°C. For infections, ampoules were thawed, the inoculum was diluted in PBS, and briefly exposed to sonic oscillations to obtain a single-cell suspension. BCG Pasteur was transformed with an Hsp60 promoter-driven GFP construct containing the kanamycin resistance gene (a gift from Dr. Glen Fennelly, Albert Einstein University, New York). Kanamycin-resistant dsRed-expressing BCG was a gift from Dr. Lalita Ramakrishnan (University of Washington, WA).
Injection
Intracerebral injection was performed as previously described (Lee et al., 2008; Ling et al., 2003). 1×10⁵ CFU of BCG in 30 μl of PBS or PBS alone was injected into the ventral-posterior region of the right frontal lobe of mice at a depth of 1.5 mm from the surface of the skull using an insulin syringe (28 and ½G) via a penetrating depth controller.
In some experiments, 1 × 10⁷ CFU of BCG in 100 μl of PBS was intraperitoneally (i.p.) injected.
Organ load
At 3 and 5 weeks post kanamycin-resistant recombinant dsRed-expressing BCG infection, bacterial organ load was determined by plating serial dilutions of organ homogenates on Middlebrook 7H10 agar plates (Difco, Franklin Lakes, NJ) supplemented with 10% OADC (Difco, Franklin Lakes, NJ) and 50 μg/mL kanamycin. Colonies were counted after 3 weeks of incubation at 37°C. Data are presented as total CFU per gram tissue for individual mice after log10 transformation.
Mononuclear cell isolation and flow cytometry
Mononuclear cells from the CNS were isolated and stained for flow cytometry as previously described (Karman et al., 2004; Lee et al., 2008; Ling et al., 2003). Mice were anesthetized with a ketamine and xylazine mixture and perfused transcardially with cold PBS. Organs were removed, weighed, and put on ice in Hank’s buffered salt solution (HBSS) (Mediatech Inc., Herndon, VA). Spleen and cervical lymph nodes (CLN) were homogenized between frosted glass slides, and the resultant cell suspension was pelleted by centrifugation. Spleen red blood cells were lysed in lysis buffer, and the remaining cells were washed 3 times with HBSS and counted. To isolate mononuclear cells from the CNS, brains and spinal cords were removed from perfused animals, weighed, minced, transferred to Medicon inserts, and ground in a MediMachine (Becton Dickinson, Mountain View, CA) for 20~30 s. The cell suspension was washed with HBSS, and cells were resuspended in 70% Percoll (Pharmacia, Piscataway, NY), and overlaid with 30% Percoll. The gradient was centrifuged at 2,250g for 30 min at 4°C. The interface was removed and washed once for further analysis. Absolute numbers were calculated based on the percentage of specific T cells from the total cell population acquired as determined using flow cytometric analysis and the weight of tissues.
For intracellular cytokine staining, single-cell suspensions from various tissues were cultured at 37°C in complete RPMI 1640 supplemented with GolgiStop (BD Biosciences, San Jose, CA) in the presence of either 20 μg/mL MOG35-55 peptide or 5 μg/mL anti-CD3 (145-2C11) antibody for 5 h. After surface staining with anti-CD4 (RM4-5) and anti-LFA-1 (2D7) antibodies cell suspensions were fixed and permeabilized by Cytofix/Cytoperm solution (BD Biosciences, San Jose, CA) followed by staining with anti-IFN-γ (XMG1.2), anti-TNF-α (MP6-XT22), and anti-IL-17 (TC11-18H10) antibodies. Fluorochrome-labeled antibodies against CD4, CD8, LFA-1, CD45, CD11c, CD40, MHCII, IFN-γ, TNF-α, IL-17, and appropriate isotype controls were purchased from BD Biosciences (San Jose, CA). Fluorochrome-labeled antibody against PD-L2 was purchased from ebioscience (San Diego, CA). Anti-CD3 and anti-CD11b antibodies were produced from hybridomas. Stained cells were collected using a dual–laser FACSCalibur (Becton Dicknson, Franklin Lakes, NJ) and analyzed with FlowJo software (TreeStar, Ashland, OR). For Foxp3+ staining, anti-Foxp3 (FJK-16s) antibody (eBioscience, San Diego, CA) was used according to the manufacturer’s protocol.
Tissue section preparation
Brains were removed from infected mice, fixed in 10% formalin, and embedded in paraffin. 10 μm sections were cut and processed for hematoxylin and eosin (H&E) or Ziehl-Neelsen (ZN) staining to detect infiltrating cells or acid fast bacilli, respectively.
Fluorescent microscopy
Frozen sections were prepared for fluorescent microscopy as previously described (Lee et al., 2008). Mice were perfused with 50 mL of PBS, followed by perfusion with 50 mL of 3% paraformaldehyde in PBS. In the case of frozen sections, spinal cord was removed and postfixed in 3% paraformadehyde/25% sucrose solution in PBS before freezing in Tissue-Tek OCT compound (Sakura Finetek, Torrance, CA) on dry ice. Sections (5 μm) were stored at −80°C until further use. Frozen sections were thawed for 10 min at room temperature and blocked with 1% BSA solution in PBS for 15 min. Sections were stained with antibodies for CD4-, CD11b-, or CD11c-conjugated with allophycocyanin, PE, and allophycocyanin, respectively, for 1 h at room temperature, followed by extensive washes with PBS. Images were acquired with a camera (Optronics Inc., Goleta, CA) mounted on a fluorescence microscope (Olympus BX41, Olympus) at 100× and 400× magnification. PictureFrame software (Optronics Inc., Goleta, CA) TIF images were exported to Adobe Photoshop CS (Adobe Systems Inc., San Jose, CA) for adjustment.
Statistical analysis
All data are presented as mean ± SEM. The one-tailed Student t test was used for comparisons of two groups. In all cases, p < 0.05 was considered statistically significant.
3. RESULTS
I.c. BCG infection leads to accumulation of mononuclear cells in the CNS and induces persistent inflammatory lesions
Granuloma formation is the hallmark of protective host immune responses against mycobacterial infection (Russell, 2007). To investigate whether BCG infection of the CNS can induce persistent granulomatous lesions in the brain, C57BL/6 mice were infected i.c. with 1×10⁵ CFU of live BCG. To track live BCG localization in the CNS, some mice were infected with rBCG expressing the GFP tracer. Histopathology was evaluated 3 and 5 weeks post i.c. infection by assessing infiltrating mononuclear cells in H&E stained brain sections. In the infected mice, infiltrating mononuclear cells were found in the perivascular areas, ventricles, and parenchyma (Fig. 1A). The injection sites were recognizable by localized infiltration of mononuclear cells (arrowheads). The presence of infiltrating mononuclear cells in the periventricular regions and well-organized bacteria-containing inflammatory lesions contralateral to the site of injection suggest dissemination of BCG throughout the brain.
FIGURE 1.
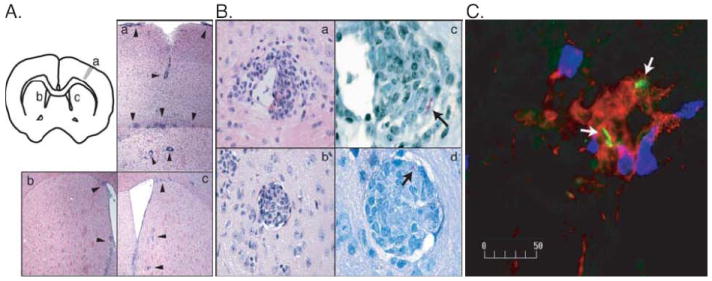
Intracerebral injection of live BCG results in the infiltration of mononuclear inflammatory cells into the brain. A, The schema in the upper left corner shows the site of BCG injection. H&E staining shows inflammatory infiltrates (arrow heads) adjacent to the injection site (a) and to the ventricles in the left (b) and right (c) hemisphere at 5 weeks post infection. Images were taken at 100x magnification. B, H&E staining shows inflammatory lesions within the perivascular space at 3 weeks (a) and parenchyma at 5 weeks (b) post i.c. injection of WT BCG. ZN staining shows the localization of the bacilli (arrow) in the lesions formed in the perivascular space (c) and parenchyma (d). Images were taken at 400x (a, b) or 1000x (c, d) magnification. C, Fluorescent immunohistochemistry shows that CD11b+ (red) and CD4+ (blue) cells accumulate and co-localize with GFP-expressing recombinant BCG (green, white arrows) in inflammatory lesions. Image was taken at 400x magnification. Representative images are shown from two independent experiments.
To evaluate the cellular composition of the inflammatory lesions containing bacilli, we examined the morphology of the cells in H&E stained brain sections and performed immunohistochemistry (IHC) on frozen brain sections. The inflammatory lesions comprised various cell types, including CD4+ T lymphocytes, CD11b+, and CD11c+ cells. Some inflammatory lesions in the brain were organized like granulomas observed in the periphery during systemic BCG infection (Fig. 1, B-b). At 3 weeks post infection, CD11b+ cells predominated in the bacilli-containing lesions of the brain while few CD4+ T cells were observed. The major cerebral phagocytic populations appeared to be CD11b+ (macrophage and microglia) (Fig. 1C) or CD11b+CD11c+ cells (inflammatory DCs) (data not shown). The presence of inflammatory lesions in the brain containing bacilli indicates that live BCG infection induces protective immunity in the brain similar to that induced by peripheral/systemic infection.
Bacterial growth is controlled in the brain
To verify protective immunity induced against BCG infection, we tested whether or not live BCG can be controlled in the CNS by examining the temporal change of the bacterial load. Mice were infected i.c. with 1×10⁵ CFU of BCG and bacterial load was determined in various tissues from the CNS and the periphery. At 3 and 5 weeks post i.c. infection, BCG bacilli were detected not only in the CNS but also at a low level in the periphery, which suggests systemic dissemination of BCG (Fig. 2). The bacterial load declined from 3 to 5 weeks post infection in all tissues tested, but the reduction was most significant in the brain and the lymph nodes draining the CNS. The significant decline in the number of CFU in the brain demonstrates that immunity within the CNS is as efficient at controlling bacterial growth as it is in the periphery.
FIGURE 2.
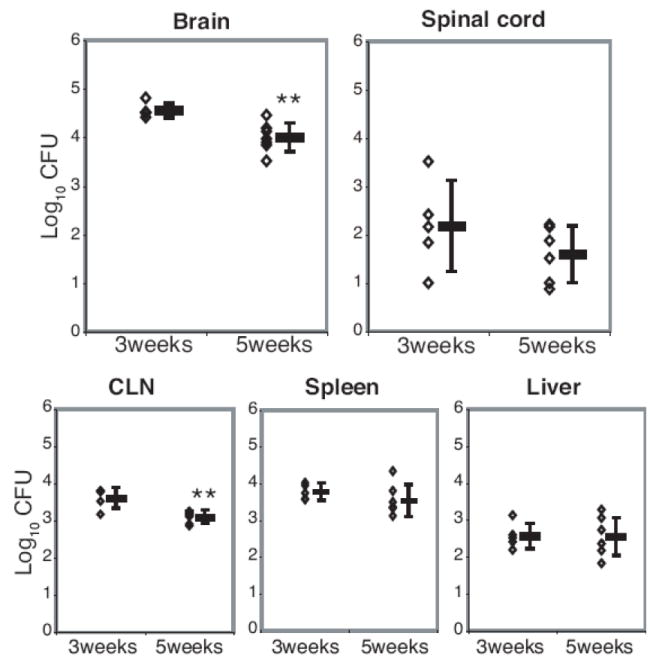
Bacterial loads expressed as log10 CFU show bacteria persisting in the CNS and a low level of dissemination to the CLN, spleen, and liver. Serial dilutions of brain, spinal cord, CLN, spleen, and liver homogenates from BCG-infected animals were plated on 7H10 agar plates to determine the CFU/organ 3 and 5 weeks after i.c. infection with BCG. Colonies were counted after 21 days of incubation at 37°C. Each dot represents one animal. Error bars represent standard deviation. N=7 per time point; data are from two independent experiments. (**, p<0.01)
CD4+ T lymphocytes, CD11b+, and CD11c+ cells infiltrate into the CNS upon i.c. BCG infection
To analyze the change in cellular composition in BCG-infected brains and spinal cords over time, the number of infiltrating mononuclear cells in the CNS was quantified at 3 and 5 weeks post i.c. BCG infection using flow cytometry. Intracerebral BCG infection led to the accumulation of mononuclear cells in the brain and spinal cord, and approximately twice as many mononuclear cells per gram of tissue were isolated at 3 weeks post infection compared to 5 weeks (Fig. 3A). The frequency of CD4+ T lymphocytes significantly increased at 3 weeks post i.c. BCG infection compared to control with no further substantial change observed at 5 weeks, while the frequency of CD8+ T lymphocytes significantly increased from 3 to 5 weeks post infection (Fig. 3B). The percentage of CD45highCD11b+ and CD45highCD11c+ cells also significantly increased upon i.c. BCG infection (Fig. 3B). However, the relative proportion of CD45highCD11b+ cells slightly decreased at 5 weeks post infection compared to that at 3 weeks, while the proportion of CD4+ and CD8+ lymphocytes stayed steady or increased, respectively. These data suggest that during the course of mycobacterial infection, the cellular composition of cells accumulating within the brain is changing.
FIGURE 3.
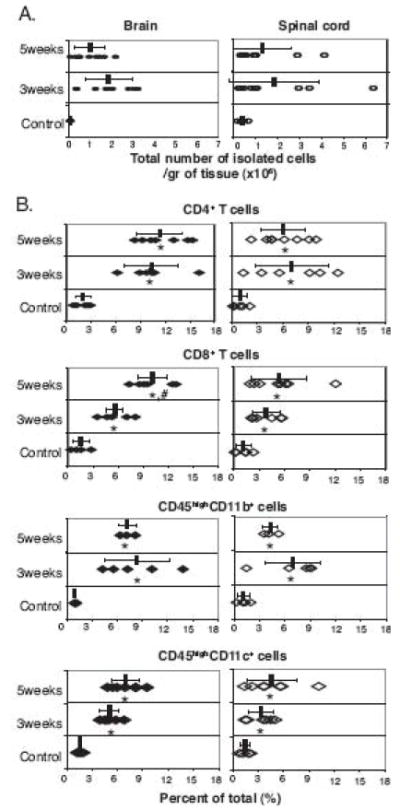
Intracerebral live BCG infection induces infiltration of CD4+ T lymphocytes, CD8+ T lymphocytes, CD11b+CD45high (macrophage), and CD11c+CD45high (DC) cells. C57BL/6 mice were infected by i.c. injection with BCG. Control mice were i.c. injected with PBS. At 3 and 5 weeks post infection, single cell suspensions were prepared and stained with anti-CD4, anti-CD8, anti-CD11b, anti-CD11c, and anti-CD45 antibodies and analyzed by flow cytometry. A, The absolute number of mononuclear cells recovered from the brain (filled circles) and spinal cord (open circles) shows accumulation of infiltrating mononuclear cells in the CNS at the indicated times after i.c. BCG infection. B, Percentage of CD4+ T lymphocytes, CD8+ T lymphocytes, CD45highCD11b+, and CD45highCD11c+ cells among the total isolated cells from brain (filled diamonds) and spinal cord (open diamonds). For all graphs, each symbol represents one animal. Error bars represent standard deviation. There are five to eight mice per group. Data are from at least two independent experiments. (*, p<0.05, control versus 3 or 5 weeks post infection; #, p<0.05, 3 weeks versus 5 weeks post infection)
To study the distribution of CD4+ T lymphocytes, CD11b+, and CD11c+ cells in the BCG-infected brain, fluorescent immunohistochemical staining was performed on frozen brain sections. Consistent with the H&E-stained sections, infiltration of CD4+ T lymphocytes, CD11b+, and CD11c+ cells was evident in the meninges (Fig. 4). CD4+ T lymphocytes were found within a lesion juxtaposed to CD11b+ cells (Fig. 4C-a, inset), but were largely scattered on the edge of the heavily CD11b+-enriched region, defining the inflammatory area (Figs. 4, C-a and D-a). CD11c+ and CD11b+CD11c+ double-positive cells were mostly found in the center of the lesions formed in the brain (Figs. 4, C-b, inset and D-b).
FIGURE 4.
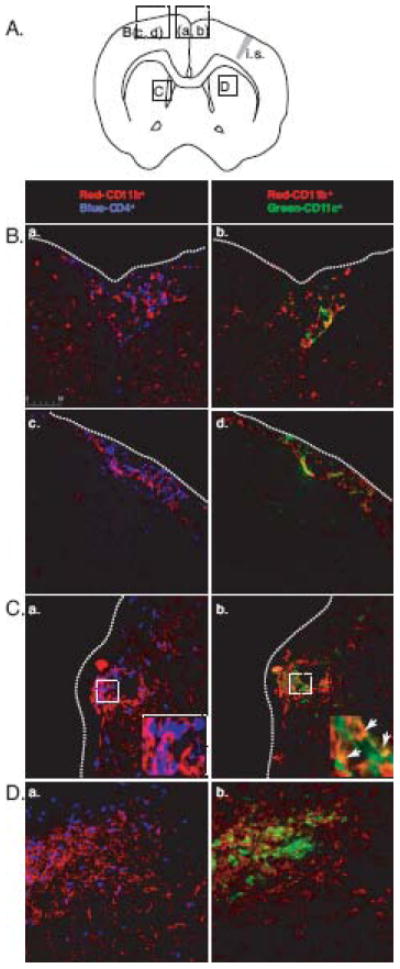
Infiltrating CD4+ T lymphocytes and CD11c+ cells, along with CD11b+ cells, localize to the inflammatory lesions formed in the brain. A, A diagram that shows the location of indicated images. (i.s. = injection site) B, Fluorescent immunohistochemistry images show that CD4+ T lymphocytes (blue; a, c) localize with CD11b+ cells (red) or CD11c+ cells (green; b, d) localize with CD11b+ cells (red) under the meninges at 3 weeks (a, b) and 5 weeks (c, d) post infection. Dotted lines indicate meninges. C, Fluorescent images show CD4+ T lymphocytes (blue) and CD11b+ cells (red) in inflammatory lesions extending from the perivascular regions. Inset shows juxtaposed CD4+ lymphocytes and CD11b+ cells in the inflammatory lesion (a). The adjacent section shows the presence of CD11b+ and CD11c+ cells in the inflammatory lesion. Inset shows CD11b+CD11c+ double-positive cells in the inflammatory lesion (b). D, Fluorescent images show CD4+ T lymphocytes (blue) forming a cuff around CD11b+ cells (red) in inflammatory lesions formed in brain parenchyma (a). The adjacent section shows CD11c+ cells colocalized with CD11b+ cells at the center of inflammatory lesion (b). All images were taken at 400x magnification.
I.c. BCG infection induces IFN-γ, TNF-α, and IL-17 production in the CNS
Systemic protective immunity against mycobacteria depends on a Th1-mediated response characterized by the production of IFN-γ and TNF-α, which are important in controlling mycobacterial infection and directing effector cells to the site of infection (Co et al., 2004). It has been shown that IL-17-producing Th17 cells may contribute to the protective immune response in the pulmonary model of mycobacterial infection (Umemura et al., 2007). Whether IFN-γ, TNF-α, and IL-17 cytokines contribute to protective immune responses in mycobacterial infection of the CNS has not been elucidated. In order to characterize the role of IFN-γ, TNF-α, and IL-17 in CD4+ T cell responses during i.c. BCG infection, we compared the frequency of IFN-γ, TNF-α, and IL-17-producing CD4+ T cells in the CNS and periphery at 3 and 5 weeks post infection. Three weeks post i.c. BCG infection, infiltration of activated CD4+ T cells was evident in the brain and 24 ± 5.5 % and 2 ± 0.5 % of the infiltrating activated CD4+ T cells produced IFN-γ and TNF-α, respectively (Figs. 5, A and B); this frequency remained unchanged at 5 weeks post infection (22 ± 5 % for IFN-γ and 3 ± 0.4 % for TNF-α among CD4+ T cells), showing sustained Th1 responses in the brain (Figs 5, A and B). We also detected IL-17+-producing CD4+ T cells, but the frequency of these cells was only one sixth and one third of the IFN-γ+-producing CD4+ T cells at 3 and 5 weeks post infection, respectively (Fig 5C). The frequency of IFN-γ+, TNF-α, and IL-17+-producing CD4+ T cells in the spinal cord was similar to those in the brain (Figs. 5, second row).
FIGURE 5.
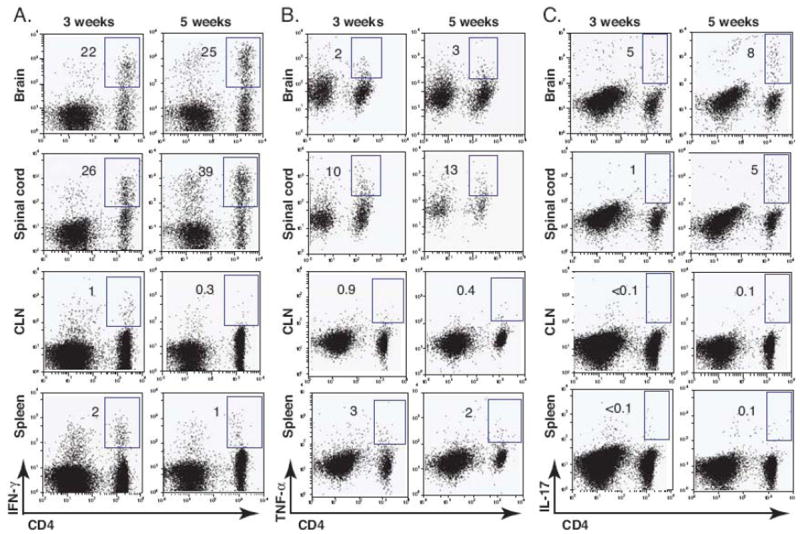
Intracerebral BCG infection induces IFN-γ, TNF-α, and IL-17 production in the CNS. C57BL/6 mice were i.c. injected with BCG or PBS. After 3 and 5 weeks mice were perfused and their organs were removed. Single cell suspensions were prepared from the brain, spinal cord, CLN, and spleen and were re-stimulated with anti-CD3 antibody in the presence of GolgiStop. The frequency of IFN-γ, TNF-α, or IL-17-producing cell was measured by intracellular cytokine staining. A-C, Representative dot plots show IFN-γ+ (A), TNF-α+ (B), or IL-17+-producing cells (C) from a lymphocyte (FSClow, SSClow) gate from brain, spinal cord , CLN, and spleen at 3 and 5 weeks post infection. Numbers represent the frequency of the boxed population among CD4+ T cells. Three to six mice were used per group.
In the CLN and spleen (Figs 5, third and fourth row), much lower IFN-γ and TNF-α responses were detected, which correlated with the lower CFU data showed in Figure 2. This suggests that bacterial dissemination may result in protective immune responses observed in the periphery. Interestingly, the frequency of IL-17+CD4+ T cells was not higher than in the background medium control (Fig 5C). It is also noteworthy that IFN-γ and TNF-α responses further decreased by 5 weeks post infection in the periphery. Altogether, these results suggest that i.c. BCG infection-induced cytokine responses are predominantly localized and sustained within the CNS.
IFN-γ+IL-17+ double-positive cells predominate in the CNS
Although the presence of IFN-γ+IL-17+ double-positive CD4+ T cells has been observed (Mangan et al., 2006), Th1 and Th17 cells almost exclusively develop as independent lineages from naïve T cells depending on the cytokine milieu (Harrington et al., 2005). Furthermore, Th1 and Th17 cells antagonize the development of each other in vitro and in vivo. In order to better understand the interrelationship between Th1 and Th17 cells during the course of BCG infection in the CNS and periphery, we analyzed the IFN-γ and IL-17-produing CD4+ T cells that were LFA-1high in the brain and spleen (Fig 6). During the course of the study, the frequency of IFN-γ−IL-17+ T cells slightly increased with similar kinetics in the CNS and periphery and the frequency IFN-γ+IL-17− T cells remained unchanged in both sites. However, the frequency of IFN-γ+IL-17+ double-positive CD4+ T cells increased by about two-fold in the CNS 5 weeks post infection compared with 3 weeks post infection (Fig 6A); approximately half of the IL-17-producing cells also produced IFN-γ 5 weeks post infection (Fig 6B). In the spleen, this IFN-γ+IL-17+ double-positive CD4+ T cell population was rarely observed 3 or 5 weeks post i.c. infection (Fig 6) and 3 or 6 weeks post intraperitoneal infection (data not shown). These data indicate that IFN-γ+IL-17+ double-positive CD4+ T cells might preferentially accumulate in the CNS.
FIGURE 6.
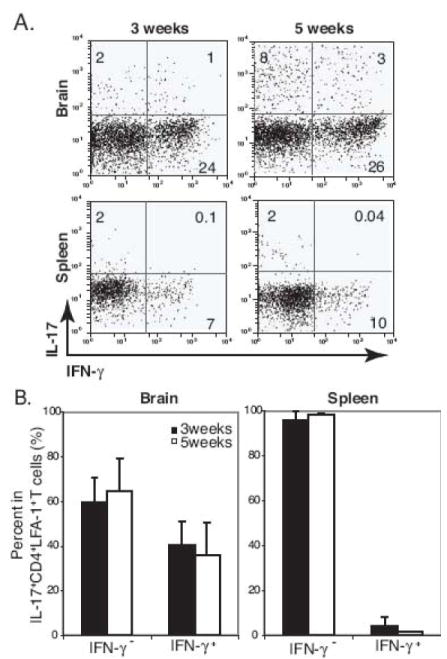
High frequency of IFN-γ+IL-17+ double-positive cells is detected in the brain during the course of i.c. BCG infection. A, Representative dot plots show IFN-γ+ and IL-17+-producing cells from a CD4+LFA-1high T cell gate from the brain and spleen at 3 and 5 weeks post i.c. BCG infection. Numbers represent the frequency of each quadrant among CD4+LFA-1high T cell cells. B, Summary graphs show the proportion of IFN-γ−IL-17+ and IFN-γ+IL-17+ cells in CD4+LFA-1highIL-17+ T cells from the brain and spleen at 3 and 5 weeks post i.c. BCG infection. Three to six mice were used per group.
Foxp3+CD4+ T cells accumulate in the CNS upon i.c. BCG infection
The expansion of Foxp3+CD4+ regulatory T cells upon mycobacterial infection has been shown in animal models and tuberculosis patients (Chen et al., 2007; Guyot-Revol et al., 2006; Scott-Browne et al., 2007). To investigate the temporal change of Foxp3+CD4+ T cells during i.c. BCG infection, the frequency and distribution of Foxp3+CD4+ T cells were determined in the CNS and periphery by flow cytometry. The frequency of Foxp3+CD4+ T cells significantly increased in the CNS upon i.c. BCG infection, while it remained unchanged in the periphery (Fig. 7). Additionally, the frequency of Foxp3+CD4+ T cells increased by about two- and six-fold in the brain and spinal cord, respectively, 5 weeks post infection compared with 3 weeks post infection, demonstrating an incremental accumulation of Foxp3+CD4+ T cells in the CNS during the course of BCG infection.
FIGURE 7.
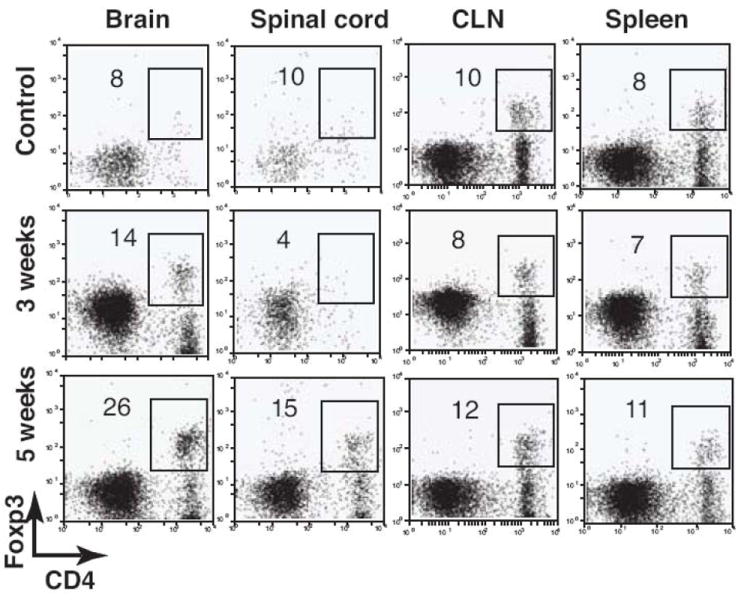
The frequency of Foxp3+CD4+ T cells proportionally increases in the CNS during the course of i.c. BCG infection. C57BL/6 mice were i.c. infected with BCG. Control mice were i.c. injected with PBS. After 3 and 5 weeks mice were perfused, and their organs were removed. Single cell suspensions were prepared from the brain, spinal cord, CLN, and spleen and stained with anti-CD4 and anti-Foxp3 antibodies. Dot plots show Foxp3+CD4+ T cells from a lymphocyte gate from the indicated organs. Numbers represent the frequency of the boxed population among CD4+ T cells. All plots are representative of three to four animals.
I.c. BCG infection results in not only accumulation of CD45highCD11b+ (macrophage) and CD45highCD11c+ (DC) cells, but also an increase of CD45intCD11b+ cells (microglia)
Upon systemic mycobacterial infections, macrophages were shown to be the major effector cell population that is responsible for killing mycobacteria (Hope et al., 2004). DCs can be also host cells for these intracellular bacteria and act as key modulators of subsequent immune responses (Giacomini et al., 2001; Hickman et al., 2002; Jiao et al., 2002). Additionally, microglia appear to play an important role in various neuroinflammatory responses, including those during the course of bacterial infections (Peterson et al., 1995; Puliti et al., 1999; Rock et al., 2005). In order to define the role of these three APC populations during i.c. BCG infection, we analyzed the temporal change of microglia (CD45intCD11b+), macrophage (CD45highCD11b+), and DC (CD45highCD11c+) populations in the CNS using flow cytometry. Microglia are distinguished from peripheral macrophages by their intermediate expression of CD45 (Sedgwick et al., 1991). In the brain and spinal cord of naïve mice, CD45int cells were predominant amongst CD11b+ cells (Fig 8). However, the percent of infiltrating CD45highCD11b+ cells was twice as high as CD45intCD11b+ cells during the course of i.c. BCG infection (Fig. 8A). CD45highCD11c+ cells also accumulated in the CNS, but a CD45intCD11c+ population was not detected in the CNS (Fig. 8B), suggesting recruitment of CD11c+ cells from the periphery upon BCG infection rather than differentiation or expansion of brain-resident cells. The absolute number of CD45highCD11b+ cells per gram of tissue increased by 142 times 3 weeks post infection compared to control brains and showed the highest increase among the three APCs (data not shown).
FIGURE 8.
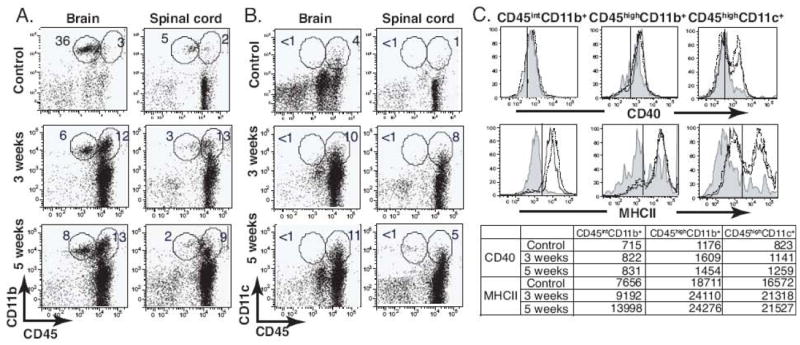
Intracerebral BCG infection results in the recruitment of CD45highCD11b+ and CD45highCD11c+cells and an increase of CD45intCD11b+ cells in the CNS. C57BL/6 mice were i.c. infected with BCG, and control mice were i.c. injected with PBS. After 3 and 5 weeks, single cell suspensions prepared from the brain and spinal cord were stained with anti-CD45, anti-CD11b, and anti-CD11c antibodies to identify APC populations. A-B, Representative dot plots show expression of CD11b and CD45 (A) and CD11c and CD45 (B) molecules on cells from the brain and spinal cord. C, Histograms indicate MHCII and CD40 expression on the indicated cell population, and values in the table below represent the MFI for MHCII or CD40 staining. Shaded line, control; solid line, 3 week infection; dotted line, 5 week infection. All plots and histograms are representative of at least three independent experiments.
In order to evaluate the activation status of these APCs, we next examined the phenotype of each APC population based on the expression of MHCII and CD40 (Fig. 8C). As shown histograms, MHCII expression was upregulated in all three populations 3 and 5 weeks post infection. CD45highCD11b+ macrophages had the highest expression of MHCII based on mean fluorescent intensity (MFI) (Fig. 8C). CD40 expression was upregulated on the CD45highCD11c+ DCs, but not on CD45intCD11b+ microglia and CD45highCD11b+ macrophages 3 and 5 weeks post infection.
CD11b is commonly expressed on the inflammatory DC subset (Bailey et al., 2007) and PD-L2 has been shown to down-regulate effector T cell responses upon interacting with its ligand expressed on activated T cells (Jurado et al., 2008; Keir et al., 2008; Sharpe et al., 2007). To analyze whether DCs possessed regulatory phenotypes, we examined the phenotype of CD11c+ cells isolated from the brain based on their co-expression of CD11b and the expression of PD-L2 in each subset. As demonstrated using IHC (Fig. 4), the increase of CD11b+CD11c+ double-positive DC populations was evident in the i.c. BCG-infected brain (Fig. 9A). The ratio of CD11c+ to CD11b+CD11c+ double-positive cells decreased in the infected mice due to the increased proportion of CD11c+ cells in the brain. In both populations, the expression of PD-L2 increased (Fig. 9B). Along with previous data showing an increased proportion of Foxp3+CD4+ T cells in the CNS 5 weeks post infection (Fig. 7), these data suggest the accumulation of an anti-inflammatory subpopulation in the brain. Altogether, these data show that mycobacterial infection in the brain results in the recruitment of activated peripheral APCs, such as macrophages and DCs, and also an increase in microglia, an endogenous brain APC.
FIGURE 9.
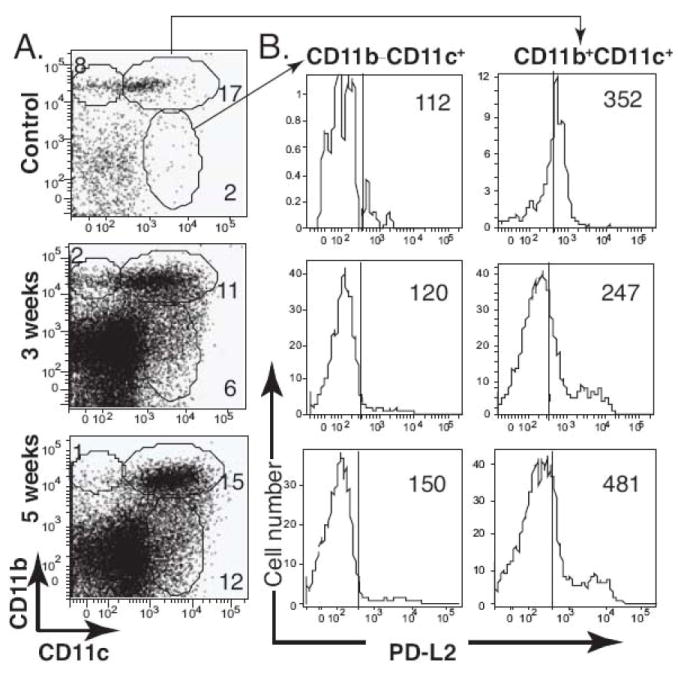
PD-L2 expression is upregulated on DCs following i.c. BCG infection. C57BL/6 mice were i.c. injected with BCG or PBS. After 3 and 5 weeks, single cell suspensions were prepared from the brain, and the isolated cells were stained with anti-CD11b and anti-CD11c antibodies to identify DC subsets. A, Representative dot plots show surface staining for CD11b and CD11c on cells from the brain. B, Histograms represent PD-L2 expression on the indicated cell population, and values are the MFI for the PD-L2 staining. Data represent the average from three to seven animals per group; all plots and histograms are representative of at least three independent experiments.
I.c. BCG infection results in robust TNF-α production by CD45intCD11b+ cells
TNF-α is a key cytokine in host protective immunity against mycobacterial infection. Therefore, we investigated which APCs produce TNF-α after BCG infection in the brain. In order to analyze the TNF-α response in three distinct APC populations, the frequency of TNF-α-producing cells was determined in CD45intCD11b+, CD45highCD11b+, and CD11c+ cells. Intracerebral BCG infection resulted in sustained TNF-α responses in all three APC populations 3 and 5 weeks post infection (Figs. 10, A and B). Of the isolated CD45intCD11b+ cells, 26 percent produced TNF-α at 3 weeks post infection (Fig. 10). These data show that CD45intCD11b+ microglia are the major sources of TNF-α during i.c. BCG infection, and recruited DCs produce little TNF-α in the brain.
FIGURE 10.
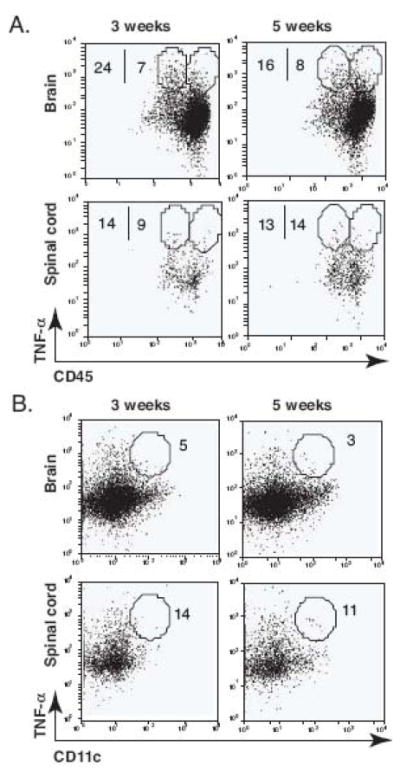
Intracerebral BCG infection results in a robust TNF-α production by CD45intCD11b+ cells. Single cell suspensions were prepared from the brain and spinal cord of i.c. BCG-infected mice at 3 and 5 weeks post infection, and the frequency of TNF-α-producing cells in three different populations was measured by intracellular cytokine staining. A, Representative dot plots show the frequency of TNF-α-producing CD11b+CD45int (microglia) and CD11b+CD45high (macrophage) cells from the brain and spinal cord. Numbers represent the frequency of the circled population among CD45intCD11b+ or CD45highCD11b+ cell populations. B, Representative dot plots show the frequency of TNF-α-producing CD11c+ cells from the brain and spinal cord at 3 and 5 weeks post infection. Numbers represent the frequency of the circled population among CD11c+ cells. Three to four mice were used per group. The TNF-α positive population was defined based on isotype control staining (not shown).
4. DISCUSSION
In this study we have shown that, similar to mycobacterial infection in non-CNS organs, BCG infection of the CNS induced granuloma formation in the CNS. Protective immune responses in the CNS and in the periphery shared some qualities, but they were not exactly identical. Immune responses were dominated by IFN-γ-producing CD4+ T cells in both tissue compartments, however, the presence of IFN-γ- and IL-17-producing double-positive CD4+ T cells was unique to the CNS. Additionally, in the CNS, microglia were the major source of TNF-α following mycobacterial infection, in contrast to the periphery, where mostly macrophages produced this cytokine. Similar to that in the periphery, protective immunity developed in the CNS that resulted in decreased bacterial load. The accumulation of regulatory cells, such as Foxp3+CD4+ T cells and PD-L2+ dendritic cells indicates the development of a regulatory environment presumably controls pro-inflammatory responses in the nervous tissue.
In humans, CNS infection with Mtb results in inflammatory granulomatous responses in the meninges or brain parenchyma (Jinkins, 1991; Molavi and LeFrock, 1985; Wilson and Castillo, 1994). In the case of tuberculosis meningitis, the subarachnoid space is filled with inflammatory cells and fibroblasts, and granulomas can also be found along the cerebral blood vessels (Molavi and LeFrock, 1985). Parenchymal disease is observed with or without meningitis and is presented as a tuberculoma (Jinkins, 1991). Similarly, in our i.c. BCG infection model, we observed meningeal infiltration of mononuclear cells and lesions extending from the perivascular and ventricular regions (Figs 1 and 4). Although the inflammatory lesions observed in the brain were loosely structured, the organized pattern of each cell population was similar to that seen in typical peripheral granulomas (Co et al., 2004; Russell, 2007). CD11b+ cells (macrophage and microglia) appear to be the most abundant mononuclear cell population in the inflammatory lesions. The distribution of CD11c+ cells, especially CD11b+CD11c+ cells that characterize inflammatory DCs, appeared to be more localized in the center of the lesions (Fig. 4, C-b and D-b). CD4+ T lymphocytes were scattered on the outer edge in a cuff-like shape around the inflammatory lesions. Similar to systemic immunity, the formation of CD11b+ cell-enriched, bacilli-containing granulomas, along with a decline in bacterial load from 3 to 5 weeks post infection, provides clear evidence of protective immune responses in the brain against mycobacterial infection.
Although CD4+ T cell responses against mycobacterial infection have been extensively characterized in various peripheral infection models, the change in distribution and kinetics of Th1/Th17/Foxp3+ T cells following mycobacterial infection of the CNS has not been studied. In the periphery, both inflammatory cytokines IFN-γ and IL-17 contribute to protective immunity against mycobacterial infection (Co et al., 2004; Umemura et al., 2007), while Foxp3+ regulatory T cells dampen protective inflammatory responses in order to reduce tissue damage (Chen et al., 2007; Guyot-Revol et al., 2006; Scott-Browne et al., 2007). Recent studies have shown that these three populations regulate each other not only during their effector phase, but also during their initial differentiation phase. IFN-γ, the signature cytokine of Th1 cells, can antagonize the differentiation of Th17 cells and vice versa (Harrington et al., 2005). Moreover, Th17 cells reciprocally develop with Foxp3+ regulatory T cells (Bettelli et al., 2006; Mucida et al., 2007; Zhou et al., 2008). Since the interaction of these three effector T cell populations shapes and determines the outcome of immune responses, it is important to understand the distribution and temporal change of Th1/Th17/Foxp3+ T cells together during the course of mycobacterial infection. Here we demonstrate that i.c. BCG infection leads to a Th1-dominant inflammatory response in the CNS similar to that induced in the periphery during systemic infection. Despite persistent Th1 responses, Th17 responses appeared to increase slightly in the CNS 5 weeks post infection. Our data suggest that the interaction of IFN-γ and IL-17 might not be linear but rather more complex, involving multiple regulatory mechanisms ongoing in a cytokine network during mycobacterial infection. Indeed, IL-17 appears to contribute to anti-mycobacterial host responses by enhancing Th1 cells, as evidenced by reduced IFN-γ production and impaired granuloma formation in IL-17-deficient mice during mycobacterial infection (Umemura et al., 2007). The dynamic inter-regulation between IFN-γ and IL-17 might also vary depending on the time point and tissue environment.
The observation that approximately half of IL-17-producing cells also produced IFN-γ within the BCG-infected brain is important to note (Fig. 6). Despite current knowledge showing exclusive differentiation of Th1 and Th17 lineages from naïve T cells, the presence of IFN-γ+IL-17+ double-positive T cells has been observed in different inflammatory contexts has been observed (Mangan et al., 2006). However, whether this population is correlated with such factors as cytokine milieu and tissue specificity has not been investigated. Our data suggest that a tissue-specific environment may favor the induction of IFN-γ+IL-17+ double-positive T cells. Since the expression of IL-12, IL-6, TGF-β, IL-23, IL-21 (Korn et al., 2007; Nurieva et al., 2007; Zhou et al., 2007), and IL-27 (Awasthi et al., 2007; Stumhofer et al., 2007) were shown to play an important role in Th1 versus Th17 lineage differentiation, amplification, maintenance, and inhibition (Bettelli et al., 2008), it would be important to define the role of these molecules in the localization of IFN-γ+IL-17+ double-positive cells within the CNS.
A substantial increase in Foxp3+CD4+ T cells was observed in the CNS but not in the periphery (Fig. 7), implying specific recruitment and enrichment of Foxp3+CD4+ T cells at the effector site of inflammation rather than in the draining lymph nodes. In conjunction with the increasing accumulation of DCs with high PD-L2 expression in the brain (Fig. 9B), these data suggest that both protective and regulatory mechanisms are developed in the CNS during i.c. mycobacterial infection. Regulatory T cells suppress effector immune responses against M. tuberculosis, thus preventing clearance of tubercle bacilli and facilitating the establishment of persistent infection (Kursar et al., 2007; Li and Wu, 2008; Scott-Browne et al., 2007). Additionally, the importance of PD-L1/2 inhibitory signaling to suppress T cell functions has been implicated during tuberculosis (Jurado et al., 2008). Therefore, further studies about the direct correlation between the accumulation of Foxp3+CD4+ T cells and PD-L2 up-regulation on DCs would help us elucidate the dynamic equilibrium of protective vs. regulatory mechanisms during mycobacterial infection.
TNF-α plays an essential role in mycobactericidal control by inducing reactive radicals, which are a major bactericidal mediator of macrophage (Chan et al., 1992; Flesch and Kaufmann, 1990). In synergy with IFN-γ, TNF-α directs effector cell migration to the site of infection by altering their expression of adhesion molecules and chemokines, and thus maintains the integrity of the granuloma structure (Flynn et al., 1995). Given the fact that granulomas provide a physical barrier that prevents dissemination of mycobacteria and are the site of bactericidal activity, TNF-α is central to host protective immune mechanisms. On the other hand, TNF-α within the CNS is central to pathogenesis (Tsenova et al., 1999) and can lead to irreversible brain damage by causing permeabilization of the blood-brain barrier and inducing mononuclear cell infiltration (Ramilo et al., 1990; Sharief et al., 1992). Therefore, from a clinical perspective, elucidating the dynamics of TNF-α responses during mycobacterial infection in the CNS is of considerable interest in order to therapeutically maintain a balance between the pathological and protective effects of TNF-α. Previously, Puliti and colleagues showed that microglia efficiently produce TNF-α and IL-12 in response to in vitro mycobacterial infection, which suggests that microglia can act as potential mediators of innate immunity in the CNS (Puliti et al., 1999). Additionally, others have shown that microglia from swine generate multinucleated giant cells, one of the phenotypic features of a granuloma, after in vitro Mtb infection in a TNF-α-dependent manner (Peterson et al., 1996). Immediate uptake of mycobacteria and the subsequent cytokine production by microglia derived from mice after in vitro Mtb infection appear to be consistent with microglia derived from humans (Peterson et al., 1995; Rock et al., 2005). In accordance with these in vitro data, our in vivo results demonstrate that microglia participate in granuloma formation (Fig. 4D-a) and cytokine production (Fig. 10A), which are two major components of host protective immunity against mycobacterial infection in mice. Our results suggest that the function of CNS-resident microglia is as important as that of infiltrating macrophage against mycobacterial infection. The immediate and initial interactions of microglia with mycobacteria might have more impact on the resulting adaptive immune responses than other peripheral APCs. Furthermore, the highly robust TNF-α response by CD45intCD11b+ cells during the course of BCG infection in the CNS suggests that blocking mononuclear cell infiltration might not be enough to decrease pathology due to the TNF-α production by CNS endogenous cells. Therefore, further characterization of microglial responses during acute and chronic mycobacterial infection in the CNS would substantially help us understand host-mycobacteria interactions and would be useful for developing clinical applications.
In this study we show that immune responses against mycobacterial infection in the CNS share similar characteristics with peripheral immune responses but also have distinct features, possibly owing to the unique immunological microenvironment. Taken together, this study helps elucidate the characteristics of mycobacterial infection within the brain. Having a better understanding of this local inflammation is key to improving treatment of CNS mycobacterial infection.
Acknowledgments
We thank Khen Macvilay for technical assistance, Toshi Kinoshita for expert histopathology services, and members of our laboratory for helpful discussions and constructive criticisms of this work.
Abbrevations used in this paper
- BCG
Mycobacterium bovis bacille Calmette-Guerin
- CLN
cervical lymph node
- CNS
central nervous system
- CFU
colony forming unit
- CSF
cerebrospinal fluid
- DC
dendritic cell
- i.c.
intracerebral
- IHC
immunohistochemistry
- MFI
mean fluorescence intensity
- Mtb
Mycobacterium tuberculosis
Footnotes
This work was supported by U.S. Public Health Service National Institutes of Health Research Grant NS-37570 and NMSS grant PP 1429 to Z.F.
Publisher's Disclaimer: This is a PDF file of an unedited manuscript that has been accepted for publication. As a service to our customers we are providing this early version of the manuscript. The manuscript will undergo copyediting, typesetting, and review of the resulting proof before it is published in its final citable form. Please note that during the production process errors may be discovered which could affect the content, and all legal disclaimers that apply to the journal pertain.
References
- Awasthi A, Carrier Y, Peron JP, Bettelli E, Kamanaka M, Flavell RA, Kuchroo VK, Oukka M, Weiner HL. A dominant function for interleukin 27 in generating interleukin 10-producing anti-inflammatory T cells. Nat Immunol. 2007;8:1380–1389. doi: 10.1038/ni1541. [DOI] [PubMed] [Google Scholar]
- Bailey SL, Schreiner B, McMahon EJ, Miller SD. CNS myeloid DCs presenting endogenous myelin peptides ‘preferentially’ polarize CD4+ T(H)-17 cells in relapsing EAE. Nat Immunol. 2007;8:172–180. doi: 10.1038/ni1430. [DOI] [PubMed] [Google Scholar]
- Bettelli E, Carrier Y, Gao W, Korn T, Strom TB, Oukka M, Weiner HL, Kuchroo VK. Reciprocal developmental pathways for the generation of pathogenic effector TH17 and regulatory T cells. Nature. 2006;441:235–238. doi: 10.1038/nature04753. [DOI] [PubMed] [Google Scholar]
- Bettelli E, Korn T, Oukka M, Kuchroo VK. Induction and effector functions of T(H)17 cells. Nature. 2008;453:1051–1057. doi: 10.1038/nature07036. [DOI] [PMC free article] [PubMed] [Google Scholar]
- Chan J, Xing Y, Magliozzo RS, Bloom BR. Killing of virulent Mycobacterium tuberculosis by reactive nitrogen intermediates produced by activated murine macrophages. J Exp Med. 1992;175:1111–1122. doi: 10.1084/jem.175.4.1111. [DOI] [PMC free article] [PubMed] [Google Scholar]
- Chen X, Zhou B, Li M, Deng Q, Wu X, Le X, Wu C, Larmonier N, Zhang W, Zhang H, Wang H, Katsanis E. CD4(+)CD25(+)FoxP3(+) regulatory T cells suppress Mycobacterium tuberculosis immunity in patients with active disease. Clin Immunol. 2007;123:50–59. doi: 10.1016/j.clim.2006.11.009. [DOI] [PubMed] [Google Scholar]
- Co DO, Hogan LH, Kim SI, Sandor M. Mycobacterial granulomas: keys to a long-lasting host-pathogen relationship. Clin Immunol. 2004;113:130–136. doi: 10.1016/j.clim.2004.08.012. [DOI] [PubMed] [Google Scholar]
- Drevets DA, Leenen PJ, Greenfield RA. Invasion of the central nervous system by intracellular bacteria. Clin Microbiol Rev. 2004;17:323–347. doi: 10.1128/CMR.17.2.323-347.2004. [DOI] [PMC free article] [PubMed] [Google Scholar]
- Flesch IE, Kaufmann SH. Activation of tuberculostatic macrophage functions by gamma interferon, interleukin-4, and tumor necrosis factor. Infect Immun. 1990;58:2675–2677. doi: 10.1128/iai.58.8.2675-2677.1990. [DOI] [PMC free article] [PubMed] [Google Scholar]
- Flynn JL. Lessons from experimental Mycobacterium tuberculosis infections. Microbes Infect. 2006;8:1179–1188. doi: 10.1016/j.micinf.2005.10.033. [DOI] [PubMed] [Google Scholar]
- Flynn JL, Goldstein MM, Chan J, Triebold KJ, Pfeffer K, Lowenstein CJ, Schreiber R, Mak TW, Bloom BR. Tumor necrosis factor-alpha is required in the protective immune response against Mycobacterium tuberculosis in mice. Immunity. 1995;2:561–572. doi: 10.1016/1074-7613(95)90001-2. [DOI] [PubMed] [Google Scholar]
- Giacomini E, Iona E, Ferroni L, Miettinen M, Fattorini L, Orefici G, Julkunen I, Coccia EM. Infection of human macrophages and dendritic cells with Mycobacterium tuberculosis induces a differential cytokine gene expression that modulates T cell response. J Immunol. 2001;166:7033–7041. doi: 10.4049/jimmunol.166.12.7033. [DOI] [PubMed] [Google Scholar]
- Gupta UD, Katoch VM. Animal models of tuberculosis. Tuberculosis (Edinb) 2005;85:277–293. doi: 10.1016/j.tube.2005.08.008. [DOI] [PubMed] [Google Scholar]
- Guyot-Revol V, Innes JA, Hackforth S, Hinks T, Lalvani A. Regulatory T cells are expanded in blood and disease sites in patients with tuberculosis. Am J Respir Crit Care Med. 2006;173:803–810. doi: 10.1164/rccm.200508-1294OC. [DOI] [PubMed] [Google Scholar]
- Harrington LE, Hatton RD, Mangan PR, Turner H, Murphy TL, Murphy KM, Weaver CT. Interleukin 17-producing CD4+ effector T cells develop via a lineage distinct from the T helper type 1 and 2 lineages. Nat Immunol. 2005;6:1123–1132. doi: 10.1038/ni1254. [DOI] [PubMed] [Google Scholar]
- Hickman SP, Chan J, Salgame P. Mycobacterium tuberculosis induces differential cytokine production from dendritic cells and macrophages with divergent effects on naive T cell polarization. J Immunol. 2002;168:4636–4642. doi: 10.4049/jimmunol.168.9.4636. [DOI] [PubMed] [Google Scholar]
- Hogan LH, Macvilay K, Barger B, Co D, Malkovska I, Fennelly G, Sandor M. Mycobacterium bovis strain bacillus Calmette-Guerin-induced liver granulomas contain a diverse TCR repertoire, but a monoclonal T cell population is sufficient for protective granuloma formation. J Immunol. 2001;166:6367–6375. doi: 10.4049/jimmunol.166.10.6367. [DOI] [PubMed] [Google Scholar]
- Hope JC, Thom ML, McCormick PA, Howard CJ. Interaction of antigen presenting cells with mycobacteria. Vet Immunol Immunopathol. 2004;100:187–195. doi: 10.1016/j.vetimm.2004.04.007. [DOI] [PubMed] [Google Scholar]
- Jiao X, Lo-Man R, Guermonprez P, Fiette L, Deriaud E, Burgaud S, Gicquel B, Winter N, Leclerc C. Dendritic cells are host cells for mycobacteria in vivo that trigger innate and acquired immunity. J Immunol. 2002;168:1294–1301. doi: 10.4049/jimmunol.168.3.1294. [DOI] [PubMed] [Google Scholar]
- Jinkins JR. Computed tomography of intracranial tuberculosis. Neuroradiology. 1991;33:126–135. doi: 10.1007/BF00588250. [DOI] [PubMed] [Google Scholar]
- Jurado JO, Alvarez IB, Pasquinelli V, Martinez GJ, Quiroga MF, Abbate E, Musella RM, Chuluyan HE, Garcia VE. Programmed death (PD)-1:PD-ligand 1/PD-ligand 2 pathway inhibits T cell effector functions during human tuberculosis. J Immunol. 2008;181:116–125. doi: 10.4049/jimmunol.181.1.116. [DOI] [PubMed] [Google Scholar]
- Karman J, Ling C, Sandor M, Fabry Z. Initiation of immune responses in brain is promoted by local dendritic cells. J Immunol. 2004;173:2353–2361. doi: 10.4049/jimmunol.173.4.2353. [DOI] [PubMed] [Google Scholar]
- Keir ME, Butte MJ, Freeman GJ, Sharpe AH. PD-1 and its ligands in tolerance and immunity. Annu Rev Immunol. 2008;26:677–704. doi: 10.1146/annurev.immunol.26.021607.090331. [DOI] [PMC free article] [PubMed] [Google Scholar]
- Korn T, Bettelli E, Gao W, Awasthi A, Jager A, Strom TB, Oukka M, Kuchroo VK. IL-21 initiates an alternative pathway to induce proinflammatory T(H)17 cells. Nature. 2007;448:484–487. doi: 10.1038/nature05970. [DOI] [PMC free article] [PubMed] [Google Scholar]
- Kursar M, Koch M, Mittrucker HW, Nouailles G, Bonhagen K, Kamradt T, Kaufmann SH. Cutting Edge: Regulatory T cells prevent efficient clearance of Mycobacterium tuberculosis. J Immunol. 2007;178:2661–2665. doi: 10.4049/jimmunol.178.5.2661. [DOI] [PubMed] [Google Scholar]
- Lee J, Reinke EK, Zozulya AL, Sandor M, Fabry Z. Mycobacterium bovis bacille Calmette-Guerin infection in the CNS suppresses experimental autoimmune encephalomyelitis and Th17 responses in an IFN-gamma-independent manner. J Immunol. 2008;181:6201–6212. doi: 10.4049/jimmunol.181.9.6201. [DOI] [PMC free article] [PubMed] [Google Scholar]
- Li L, Wu CY. CD4+ CD25+ Treg cells inhibit human memory gammadelta T cells to produce IFN-gamma in response to M tuberculosis antigen ESAT-6. Blood. 2008;111:5629–5636. doi: 10.1182/blood-2008-02-139899. [DOI] [PubMed] [Google Scholar]
- Ling C, Sandor M, Fabry Z. In situ processing and distribution of intracerebrally injected OVA in the CNS. J Neuroimmunol. 2003;141:90–98. doi: 10.1016/s0165-5728(03)00249-2. [DOI] [PubMed] [Google Scholar]
- Mangan PR, Harrington LE, O’Quinn DB, Helms WS, Bullard DC, Elson CO, Hatton RD, Wahl SM, Schoeb TR, Weaver CT. Transforming growth factor-beta induces development of the T(H)17 lineage. Nature. 2006;441:231–234. doi: 10.1038/nature04754. [DOI] [PubMed] [Google Scholar]
- Mazzolla R, Puliti M, Barluzzi R, Neglia R, Bistoni F, Barbolini G, Blasi E. Differential microbial clearance and immunoresponse of Balb/c (Nramp1 susceptible) and DBA2 (Nramp1 resistant) mice intracerebrally infected with Mycobacterium bovis BCG (BCG) FEMS Immunol Med Microbiol. 2002;32:149–158. doi: 10.1111/j.1574-695X.2002.tb00547.x. [DOI] [PubMed] [Google Scholar]
- Molavi A, LeFrock JL. Tuberculous meningitis. Med Clin North Am. 1985;69:315–331. doi: 10.1016/s0025-7125(16)31045-8. [DOI] [PubMed] [Google Scholar]
- Mucida D, Park Y, Kim G, Turovskaya O, Scott I, Kronenberg M, Cheroutre H. Reciprocal TH17 and regulatory T cell differentiation mediated by retinoic acid. Science. 2007;317:256–260. doi: 10.1126/science.1145697. [DOI] [PubMed] [Google Scholar]
- Nurieva R, Yang XO, Martinez G, Zhang Y, Panopoulos AD, Ma L, Schluns K, Tian Q, Watowich SS, Jetten AM, Dong C. Essential autocrine regulation by IL-21 in the generation of inflammatory T cells. Nature. 2007;448:480–483. doi: 10.1038/nature05969. [DOI] [PubMed] [Google Scholar]
- Peterson PK, Gekker G, Hu S, Anderson WB, Teichert M, Chao CC, Molitor TW. Multinucleated giant cell formation of swine microglia induced by Mycobacterium bovis. J Infect Dis. 1996;173:1194–1201. doi: 10.1093/infdis/173.5.1194. [DOI] [PubMed] [Google Scholar]
- Peterson PK, Gekker G, Hu S, Sheng WS, Anderson WR, Ulevitch RJ, Tobias PS, Gustafson KV, Molitor TW, Chao CC. CD14 receptor-mediated uptake of nonopsonized Mycobacterium tuberculosis by human microglia. Infect Immun. 1995;63:1598–1602. doi: 10.1128/iai.63.4.1598-1602.1995. [DOI] [PMC free article] [PubMed] [Google Scholar]
- Puliti M, Mazzolla R, Brozzetti A, Neglia R, Radzioch D, Bistoni F, Blasi E. Differential effector and secretory functions of microglial cell lines derived from BCGresistant and -susceptible congenic mouse strains. J Neuroimmunol. 1999;101:27–33. doi: 10.1016/s0165-5728(99)00127-7. [DOI] [PubMed] [Google Scholar]
- Ramilo O, Saez-Llorens X, Mertsola J, Jafari H, Olsen KD, Hansen EJ, Yoshinaga M, Ohkawara S, Nariuchi H, McCracken GH., Jr Tumor necrosis factor alpha/cachectin and interleukin 1 beta initiate meningeal inflammation. J Exp Med. 1990;172:497–507. doi: 10.1084/jem.172.2.497. [DOI] [PMC free article] [PubMed] [Google Scholar]
- Rock RB, Hu S, Gekker G, Sheng WS, May B, Kapur V, Peterson PK. Mycobacterium tuberculosis-induced cytokine and chemokine expression by human microglia and astrocytes: effects of dexamethasone. J Infect Dis. 2005;192:2054–2058. doi: 10.1086/498165. [DOI] [PubMed] [Google Scholar]
- Rock RB, Olin M, Baker CA, Molitor TW, Peterson PK. Central nervous system tuberculosis: pathogenesis and clinical aspects. Clin Microbiol Rev. 2008;21:243–261. doi: 10.1128/CMR.00042-07. table of contents. [DOI] [PMC free article] [PubMed] [Google Scholar]
- Russell DG. Who puts the tubercle in tuberculosis? Nat Rev Microbiol. 2007;5:39–47. doi: 10.1038/nrmicro1538. [DOI] [PubMed] [Google Scholar]
- Scott-Browne JP, Shafiani S, Tucker-Heard G, Ishida-Tsubota K, Fontenot JD, Rudensky AY, Bevan MJ, Urdahl KB. Expansion and function of Foxp3-expressing T regulatory cells during tuberculosis. J Exp Med. 2007;204:2159–2169. doi: 10.1084/jem.20062105. [DOI] [PMC free article] [PubMed] [Google Scholar]
- Sedgwick JD, Schwender S, Imrich H, Dorries R, Butcher GW, ter Meulen V. Isolation and direct characterization of resident microglial cells from the normal and inflamed central nervous system. Proc Natl Acad Sci U S A. 1991;88:7438–7442. doi: 10.1073/pnas.88.16.7438. [DOI] [PMC free article] [PubMed] [Google Scholar]
- Sharief MK, Ciardi M, Thompson EJ. Blood-brain barrier damage in patients with bacterial meningitis: association with tumor necrosis factor-alpha but not interleukin-1 beta. J Infect Dis. 1992;166:350–358. doi: 10.1093/infdis/166.2.350. [DOI] [PubMed] [Google Scholar]
- Sharpe AH, Wherry EJ, Ahmed R, Freeman GJ. The function of programmed cell death 1 and its ligands in regulating autoimmunity and infection. Nat Immunol. 2007;8:239–245. doi: 10.1038/ni1443. [DOI] [PubMed] [Google Scholar]
- Stumhofer JS, Silver JS, Laurence A, Porrett PM, Harris TH, Turka LA, Ernst M, Saris CJ, O’Shea JJ, Hunter CA. Interleukins 27 and 6 induce STAT3-mediated T cell production of interleukin 10. Nat Immunol. 2007;8:1363–1371. doi: 10.1038/ni1537. [DOI] [PubMed] [Google Scholar]
- Tsenova L, Bergtold A, Freedman VH, Young RA, Kaplan G. Tumor necrosis factor alpha is a determinant of pathogenesis and disease progression in mycobacterial infection in the central nervous system. Proc Natl Acad Sci U S A. 1999;96:5657–5662. doi: 10.1073/pnas.96.10.5657. [DOI] [PMC free article] [PubMed] [Google Scholar]
- Tsenova L, Sokol K, Freedman VH, Kaplan G. A combination of thalidomide plus antibiotics protects rabbits from mycobacterial meningitis-associated death. J Infect Dis. 1998;177:1563–1572. doi: 10.1086/515327. [DOI] [PubMed] [Google Scholar]
- Umemura M, Yahagi A, Hamada S, Begum MD, Watanabe H, Kawakami K, Suda T, Sudo K, Nakae S, Iwakura Y, Matsuzaki G. IL-17-mediated regulation of innate and acquired immune response against pulmonary Mycobacterium bovis bacille Calmette-Guerin infection. J Immunol. 2007;178:3786–3796. doi: 10.4049/jimmunol.178.6.3786. [DOI] [PubMed] [Google Scholar]
- Wilson JD, Castillo M. Magnetic resonance imaging of granulomatous inflammations: sarcoidosis and tuberculosis. Top Magn Reson Imaging. 1994;6:32–40. [PubMed] [Google Scholar]
- Zhou L, Ivanov II, Spolski R, Min R, Shenderov K, Egawa T, Levy DE, Leonard WJ, Littman DR. IL-6 programs T(H)-17 cell differentiation by promoting sequential engagement of the IL-21 and IL-23 pathways. Nat Immunol. 2007;8:967–974. doi: 10.1038/ni1488. [DOI] [PubMed] [Google Scholar]
- Zhou L, Lopes JE, Chong MM, Ivanov II, Min R, Victora GD, Shen Y, Du J, Rubtsov YP, Rudensky AY, Ziegler SF, Littman DR. TGF-beta-induced Foxp3 inhibits T(H)17 cell differentiation by antagonizing RORgammat function. Nature. 2008;453:236–240. doi: 10.1038/nature06878. [DOI] [PMC free article] [PubMed] [Google Scholar]