Abstract
The epithelial Ca2+ channel TRPV5 constitutes the apical entry gate for Ca2+ transport in renal epithelial cells. Ablation of the trpv5 gene in mice leads to a reduced Ca2+ reabsorption. TRPV5 is tightly regulated by various calciotropic hormones, associated proteins, and other factors, which mainly affect channel activity via the C terminus. To further identify the role of the C terminus in TRPV5 regulation, we expressed channels harboring C-terminal deletions and studied channel activity by measuring intracellular Ca2+ concentration ([Ca2+]i) using fura-2 analysis. Removal of amino acid His712 elevated the [Ca2+]i, indicating enlarged TRPV5 activity. In addition, substitution of the positively charged His712 for a negative (H712D) or neutral (H712N) amino acid also stimulated TRPV5 activity. This critical role of His712 was confirmed by patch clamp analysis, which demonstrates increased Na+ and Ca2+ currents for TRPV5-H712D. Cell surface biotinylation studies revealed enhanced plasma membrane expression of TRPV5-H712D as compared with wild-type (WT) TRPV5. This elevated plasma membrane presence also was observed with the Ca2+-impermeable TRPV5-H712D and TRPV5-WT pore mutants, demonstrating that the elevation is not due to the increased [Ca2+]i. Finally, using an internalization assay, we demonstrated a delayed cell surface retrieval for TRPV5-H712D, likely causing the increase in plasma membrane expression. Together, these results demonstrate that His712 plays an essential role in plasma membrane regulation of TRPV5 via a constitutive endocytotic mechanism.
Keywords: Calcium, Calcium Channels, Calcium Transport, Membrane Turnover, TRP Channels
Introduction
Calcium (Ca2+) plays a critical role in many cellular and physiological processes in the human body. Ca2+ homeostasis is maintained via the interplay between intestinal absorption, storage in bone, and renal excretion. Excretion of Ca2+ by the kidney is regulated through the reabsorption of Ca2+ from the glomerular filtrate. This takes place in the proximal tubule and thick ascending limb of Henle via a passive paracellular pathway driven by the Na+ gradient, whereas in the distal part of the nephron, Ca2+ is reabsorbed actively in a trans-cellular manner. The epithelial Ca2+ channel TRPV5 (transient receptor potential vanilloid 5) forms the apical entry gate for transepithelial Ca2+ reabsorption (1, 2). When Ca2+ enters the cell, it is bound by calbindin-D28k and released at the basolateral site where Ca2+ is extruded into the bloodstream by the Na+/Ca2+ exchanger (NCX1) and the plasma membrane Ca2+-ATPase (PMCA1b). The apical influx of Ca2+ is the rate-limiting step in transepithelial Ca2+ transport. This becomes evident in the tight control of TRPV5 protein expression, channel trafficking, and gating at the plasma membrane by various hormones, associated proteins, and other factors (3, 4). Moreover, disruption of the trpv5 gene in mice resulted in profound hypercalciuria due to diminished active Ca2+ reabsorption (5).
TRPV5 belongs to the superfamily of TRP channels, which share the mutual composition of six transmembrane domains and permeability to cations (6). A functional TRPV5 channel consists of four identical subunits, forming a single central pore located between transmembrane domains five and six (7). Within the mammalian TRP family, TRPV5 and its closest homologue TRPV6 are the most Ca2+-selective channels (6). Furthermore, TRPV5 is constitutively open at low [Ca2+]i and is characterized by an inward rectifying ion current-voltage (I-V) profile (8). The membrane-spanning region is flanked by large intracellular N and C termini (9). The N terminus contains several ankyrin repeats, which have been implicated in channel assembly (10, 11). However, the molecular function of these ankyrin repeats remains controversial (12, 13).
Although the function of the TRPV5 N terminus still is largely unresolved, the C terminus plays a central role in TRPV5 channel regulation. Various molecular processes, including protonation, phosphorylation, and protein-protein interactions, affect TRPV5 activity by modulating the C terminus. First, Huang and co-workers (14) found that binding of protons to lysine 607 induced a conformational change of the channel pore, mainly resulting in a reduced channel open probability. Second, the protein kinase A phosphorylation site Thr709 of TRPV5 was identified recently as a target for parathyroid hormone. Protein kinase A-dependent phosphorylation of Thr709 rapidly increases TRPV5 channel open probability and thereby enhances Ca2+ influx (15). Third, the C-terminal PKC phosphorylation site Ser654 appears essential for tissue kallikrein-mediated plasma membrane accumulation of TRPV5 (16). Fourth, the C-terminal VATTV sequence is required for S100A10-TRPV5 interaction. Alanine substitution of the first threonine, T599A, prevents S100A10 binding to TRPV5, leading to the subplasma membrane localization of TRPV5 and thus a nonfunctional channel (17). Fifth, Rab11a targets TRPV5 toward the plasma membrane via C-terminal interaction (18).
Finally, the TRPV5 C terminus has been shown convincingly to be involved in Ca2+-dependent inactivation. Two Ca2+-sensing stretches were identified in the TRPV5 C terminus, one between residues 650 and 653 and the other in the last 30 residues (19). Deleting both stretches resulted in a channel that does not inactivate in the presence of a concentration of 1 μm intracellular Ca2+ (19). In addition, removing only the last 30 residues significantly diminished the Ca2+-dependent inactivation of TRPV5 (19). To explore the exact role of this highly regulated part of the C terminus, we developed a series of TRPV5 C-terminal deletion mutants. The role of these mutants in TRPV5 channel regulation were tested with a combination of live-cell imaging, patch clamp analysis, and various biochemical approaches.
EXPERIMENTAL PROCEDURES
Construction of Mammalian Expression Vectors
The bicistronic expression vector pCINeo/IRES-eGFP was used to co-express rabbit TRPV5 containing an N-terminally fused HA-tag and enhanced green fluorescent protein (eGFP). C-terminal truncations and mutations of TRPV5 were produced by PCR and site-directed mutagenesis (Stratagene), according to the manufacturer's protocol, after which all plasmids were sequence-verified.
Cell Culture and Transfection
Human embryonic kidney (HEK293) cells were grown in Dulbecco's modified Eagle's medium (DMEM, Bio Whittaker Europe, Vervier, Belgium) containing 10% (v/v) fetal calf serum (PAA Laboratories, Linz, Austria), 2 mm l-glutamine, 10 μl/ml nonessential amino acids, and 0.01 mg/ml ciproxin at 37 °C in a humidity-controlled incubator with 5% (v/v) CO2. Cells were transiently transfected with the appropriate plasmids using polyethyleneimine (PEI, Brunswig/PolySciences, Inc.) with a DNA:PEI ratio of 6:1 for biochemical or live-cell imaging experiments. For patch clamp experiments, cells were transiently transfected with the appropriate plasmids using Lipofectamine 2000 (Invitrogen). For all experiments, transfected cells were used after 24 h.
[Ca2+]i Measurement using Fura-2/AM
HEK293 cells were seeded on fibronectin-coated coverslips (inner diameter, 25 mm) and transfected with the appropriate pCINeo/IRES-eGFP vector. After 24 h, cells were loaded with 3 μm fura-2/AM and 0.01% (v/v) Pluronic F-129 (both from Molecular Probes) in DMEM medium at 37 °C for 20 min. After loading, cells were washed twice with PBS and allowed to equilibrate at 37 °C for another 10 min in 132.0 mm NaCl, 4.2 mm KCl, 1.4 mm CaCl2, 1.0 mm MgCl2, 5.5 mm d-glucose, 10 mm HEPES/Tris, pH 7.4. For Ca2+-free conditions, a similar buffer composition was used, in which Ca2+ was substituted with 2 mm EGTA.
After fura-2 loading, cells were placed in an incubation chamber and attached to the stage of an inverted microscope (Axiovert 200M, Carl Zeiss, Jena, Germany). Changes in extracellular [Ca2+] ([Ca2+]e) were facilitated using a perfusion system and resulting changes in [Ca2+]i were monitored with fura-2 and were excited at 340 and 380 nm using a monochromator (Polychrome IV, TILL Photonics, Gräfelfing, Germany). Fluorescence emission light was directed by a 415DCLP dichroic mirror (Omega Optical, Inc., Brattleboro, VT) through a 510WB40 emission filter (Omega Optical, Inc.) onto a CoolSNAP HQ monochrome CCD-camera (Roper Scientific, Vianen, the Netherlands). The integration time of the CCD-camera was set at 200 ms with a sampling interval of 3 s. All hardware was controlled with Metafluor (version 6.0) software (Universal Imaging Corp., Downingtown, PA).
Quantitative image analysis was performed with Metamorph (version 6.0; Molecular Devices Corp., Sunnyvale, CA). For each wavelength, the mean fluorescence intensity was monitored in an intracellular region and, for purpose of background correction, an extracellular region of identical size. After background correction, the fluorescence emission ratio of 340 and 380 nm excitation was calculated to determine the [Ca2+]i. All measurements were performed at room temperature.
Electrophysiology
Electrophysiological methods have been described previously in detail (9, 20).
Cell Surface Biotinylation and Internalization Assay
HEK293 cells were transfected with different TRPV5 constructs in pCINeo/IRES-eGFP using PEI. After 2 days, cell surface proteins were biotinylated for 30 min at 4 °C using sulfo-NHS-LC-LC-biotin or sulfo-NHS-SS-biotin (0.5 mg/ml; Pierce) as described previously (21). In short, cells were kept at 4 °C or incubated for 30 min at 37 °C to allow endocytosis from the plasma membrane. TRPV5 internalization was measured by treating cells with fresh 100 mm 2-mercaptoethanesulfonic acid sodium salt (mesna) for three times for 20 min at 4 °C. After treatment with 120 mm iodoacetic acid to quench mesna, cells were lysed in 150 mm NaCl, 5 mm EGTA, 50 mm Tris-HCl, pH 7.5, Triton X-100 1% (v/v), and protease inhibitors at 4 °C and centrifuged at 14,000 × g for 10 min. Finally, biotinylated proteins in the supernatant were precipitated using neutravidin-coupled beads (Pierce) and analyzed by immunoblotting using anti-HA antibodies.
Statistical Analysis
Numerical results were visualized using Origin Pro 7.5 (OriginLab Corp., Northampton, MA) and presented as the mean ± S.E. Statistical differences were determined using a one-way ANOVA followed by Bonferroni. p values <0.05 were considered significant.
RESULTS
Removal of the Very End of TRPV5 C Terminus Elevates [Ca2+]i
To study TRPV5 function in intact cells, we monitored [Ca2+]i using fura-2. To this extent, HEK293 cells were seeded on fibronectin-coated coverslips and transiently transfected with TRPV5 in pCINeo/IRES-eGFP or the empty vector. After 24 h, cells were loaded with fura-2/AM, equilibrated for 10 min, and placed on the stage of an inverted microscope. Cells expressing eGFP were selected and monitored for changes in [Ca2+]i in response to variation of ([Ca2+]e, which was facilitated by superfusion.
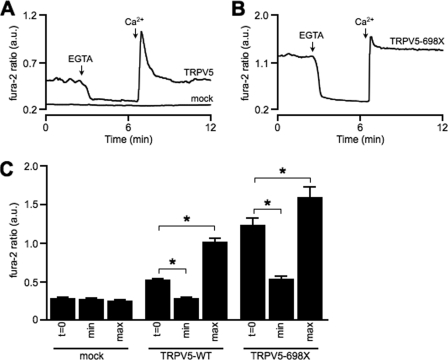
Expression of the TRPV5 channel resulted in an elevated [Ca2+]i compared with mock-transfected cells (Fig. 1, A and C). When medium containing 1.4 mm Ca2+ was exchanged for Ca2+-free medium (no Ca2+, 2 mm EGTA), the [Ca2+]i in TRPV5-expressing cells dropped to levels similar to mock-transfected cells. Exchanging the Ca2+-free medium again for the 1.4 mm Ca2+ solution induced an overshoot; a rapid increase of [Ca2+]i to a maximal level followed by a gradual decrease to basal levels. No significant changes in [Ca2+]i were observed in mock-transfected cells (Fig. 1, A and C).
FIGURE 1.
Monitoring TRPV5 activity using fura-2. Representative trace of fura-2 ratio in arbitrary units (a.u.) in HEK293 cells transiently transfected with TRPV5-WT, mock (A), and TRPV5–698X (B). All procedures were performed at room temperature. C, fura-2 levels at resting conditions (t = 0), minimal fura-2 ratio after EGTA treatment (min), and peak level (max) upon administration of 1.4 mm Ca2+. Average data of mock (n = 19), TRPV5-WT (n = 46), and TRPV5–698X (n = 20) are shown. The asterisk denotes a significant difference (p < 0.05) from indicated condition.
Next, HEK293 cells were transfected with a TRPV5 mutant lacking a part of the C terminus (TRPV5–698X). Previously, a similar mutant displayed a blunted response to Ca2+-induced channel inactivation as measured by patch clamp analysis (19). Fura-2 analysis of TRPV5–698X-expressing HEK293 cells revealed an elevated basal [Ca2+]i compared with TRPV5-WT. TRPV5–698X responded only partially to EGTA treatment (Fig. 1, B and C). Replacing the EGTA medium with Ca2+ medium restored [Ca2+]i to basal levels after a small overshoot (Fig. 1, B and C).
Functional Analysis of C-terminal Deletion Mutants Reveals Residue His712
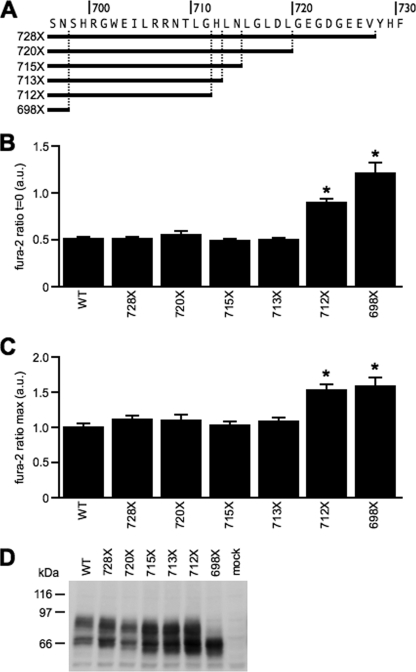
To pinpoint the region responsible for the elevated [Ca2+]i observed in cells expressing TRPV5–698X, shorter deletions within the TRPV5 C terminus were made (Fig. 2A). Deletions up to residue His712 did not affect resting [Ca2+]i as shown in Fig. 2B. However, deletion of His712 (TRPV5–712X) resulted in a significant increased basal [Ca2+]i, although not as high as the 698X mutation (Fig. 2B). Remarkably, fura-2 peak levels (maximal [Ca2+]i) of TRPV-712X were identical to TRPV5–698X as indicated by Fig. 2C. Maximal [Ca2+]i of the shorter deletion mutants were identical to TRPV5-WT. All C-terminal deletions were correctly expressed as judged by immunoblotting (Fig. 2D).
FIGURE 2.
Effect of C-terminal deletion on TRPV5 activity. A, overview of TRPV5 deletion mutants used in this study. Shown are the basal (B) and maximal (C) fura-2 ratio in arbitrary units (a.u.) of TRPV5-WT (n = 46), TRPV5–728X (n = 43), TRPV5–720X (n = 43), TRPV5–715X (n = 32), TRPV5–713X (n = 38), TRPV5–712X (n = 39), and TRPV5–698X (n = 20). *, p < 0.05 compared with TRPV5-WT. D, protein expression of mock, TRPV5-WT, and TRPV5 deletion mutants.
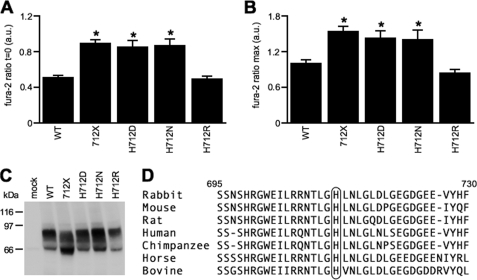
As His712 is positively charged, we examined whether this charge is responsible for the observed effect on [Ca2+]i of TRPV5–712X. Mutation of His712 into a negatively charged aspartic acid (TRPV5-H712D) or a neutral asparagine (TRPV5-H712N) enlarged basal [Ca2+]i to a similar extent as TRPV5–712X (Fig. 3A). In contrast, replacement of His712 with the positively charged arginine (TRPV5-H712R) did not modulate the intracellular Ca2+ levels (Fig. 3A). Analysis of the peak fura-2 levels of these mutants resulted in an identical [Ca2+]i pattern as observed at basal conditions (Fig. 3B). Immunoblotting did not demonstrate large variations in protein expression (Fig. 3C). Interestingly, His712 is highly conserved among different mammalian species (Fig. 3D).
FIGURE 3.
Analysis of critical residue His712 within the TRPV5 C terminus. Basal (A) and maximal (B) fura-2 ratio in arbitrary units (a.u.) of TRPV5-WT (n = 46), TRPV5–712X (n = 39), H712D (n = 22), TRPV5-H712N (n = 18), and H712R (n = 20). *, p < 0.05 compared with TRPV5-WT. C, protein expression of mock, TRPV5-WT, and TRPV5 mutants. D, overview late part of the TRPV5 C terminus of different mammalian species.
Critical role of His712 Is Independent of Protein Kinase A-dependent Phosphorylation
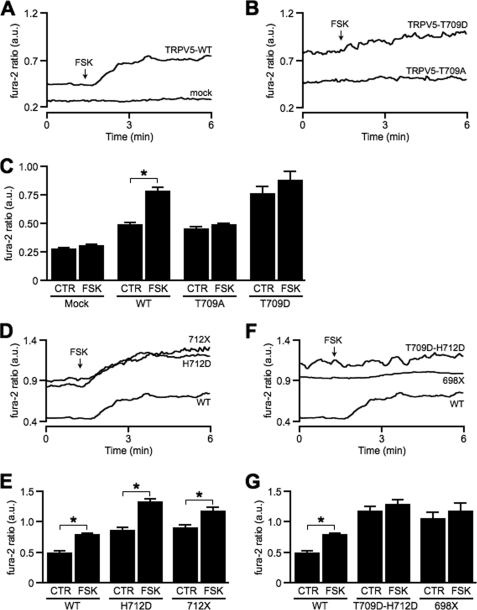
Residue His712 is located very close to a conserved protein kinase A-dependent phosphorylation site 706RRNT*LGH712. Upon phosphorylation of Thr709, the channel open probability increases, resulting in an elevated TRPV5-mediated Ca2+ influx (15). To investigate whether deletion or mutation of His712 affects TRPV5 activation by protein kinase A-dependent phosphorylation, we used the cAMP-elevating agent forskolin and studied its effect on TRPV5 activity using fura-2 analysis. First, to confirm the specificity of the forskolin response, we implemented a phosphorylation-deficient mutant (T709A) and one mimicking a constitutively phosphorylated state (T709D). Forskolin increased [Ca2+]i of cells expressing TRPV5-WT, whereas mock-expressing cells were not affected (Fig. 4, A and C). Fura-2 ratio of cells expressing T709A and T709D was not altered upon forskolin stimulation (Fig. 4, B and C). Notably, basal [Ca2+]i of the T709D mutant was elevated significantly in comparison with TRPV5-WT and TRPV5-T709A (Fig. 4C) and similar to [Ca2+]i of the TRPV5-H712D mutant.
FIGURE 4.
Examination of forskolin response on hyperactive TRPV5 mutants. Typical fura-2 trace in arbitrary units (a.u.) of mock, TRPV5-WT (A), TRPV5-T709A, and TRPV5-T709D (B) upon the addition of forskolin. C, average data representing fura-2 levels before (CTR) and after forskolin (FSK) stimulation of mock (n = 19), TRPV5-WT (n = 47), TRPV5-T709A (n = 27), and TRPV5-T709D (n = 22). CTR, control. *, p < 0.05 compared with resting conditions. Representative (D) and average (E) fura-2 data of TRPV5-WT (n = 47), TRPV5-H712D (n = 25), and TRPV5–712X (n = 28) in basal conditions and upon forskolin stimulation. Representative (F) and average (G) fura-2 ratio of TRPV5-WT (n = 47), TRPV5-T709D/H712D (n = 20), and TRPV5–698X (n = 13) before and after forskolin stimulation.
Next, the forskolin response on TRPV5–712X and TRPV5-H712D was examined. Although basal [Ca2+]i of TRPV5–712X and TRPV5-H712D was already elevated compared with TRPV5-WT, forskolin treatment resulted in a dramatic increase in [Ca2+]i (Fig. 4, D and E). In addition, we developed a double mutant by introducing the T709D mutation into TRPV5-H712D. This double mutant exhibited a similar [Ca2+]i as TRPV5-H712D after forskolin stimulation (Fig. 4, F and G). Furthermore, neither the double mutant nor TRPV5–698X responded to forskolin (Fig. 4, F and G).
TRPV5-H712D Elevates Channel Plasma Membrane Abundance
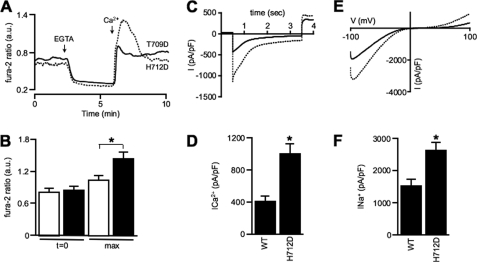
To gain more insight into the molecular features of the TRPV5-H712D mutant, we compared the fura-2 recording traces of TRPV5-H712D and TRPV5-T709D in response to the Ca2+ and Ca2+-free medium. Both mutants displayed a similarly increased basal [Ca2+]i, which fully decreased in Ca2+-free medium (EGTA treatment) (Fig. 5A). Interestingly, the maximal [Ca2+]i of TRPV5-H712D was significantly elevated in comparison with TRPV5-T709D (Fig. 5, A and B).
FIGURE 5.
TRPV5-H712D exhibits an enlarged Ca2+ and Na+ current. A, representative trace of fura-2 ratio in HEK293 cells transiently transfected with TRPV5-T709D and TRPV5-H712D. B, fura-2 levels in arbitrary units (a.u.) at basal conditions (t = 0) and peak level (max) upon administration of 1.4 mm Ca2+. Average data of TRPV5-T709D (n = 19) and TRPV5-H712D (n = 22) as depicted in white and black bars, respectively. The asterisk denotes a significant difference (p < 0.05) from indicated condition. C, inward Ca2+ currents measured with 10 mm extracellular Ca2+ during a 3-s step to −100 mV from a holding potential of +70 mV in HEK293 cells expressing either TRPV5-WT or TRPV5-H712D. D, average peak current density during a voltage step to −100 mV in 10 mm Ca2+. Cells expressing TRPV5-H712D displayed significantly increased Ca2+ peak currents. *, p < 0.05 compared with TRPV5-WT. E, I-V relationship measured from 450-ms voltage ramps in nominally divalent-free solution. F, average current densities at −80 mV in nominally divalent-free solution. Cells expressing H712D displayed significantly increased Na+ currents at −80 mV. *, p < 0.05 compared with TRPV5-WT.
To investigate whether [Ca2+]i plays a role in the elevated activity observed for TRPV5-H712D, the whole cell patch clamp technique was implemented, and Ca2+ and Na+ currents of TRPV5-WT and TRPV5-H712D were evaluated. Application of a hyperpolarizing voltage step to −100 mV from a holding potential of +70 mV showed an increased Ca2+ peak current in H712D-expressing cells compared with TRPV5-WT cells (Fig. 5, C and 5D). Na+ current measurements in nominally divalent-free solution (20 μm EDTA) demonstrated that TRPV5-H712D still exhibited an enlarged macroscopic current (Fig. 5, E and F). The strong inward rectification, which is characteristic for the TRPV5 channel, should also be noted (Fig. 5E) (20).
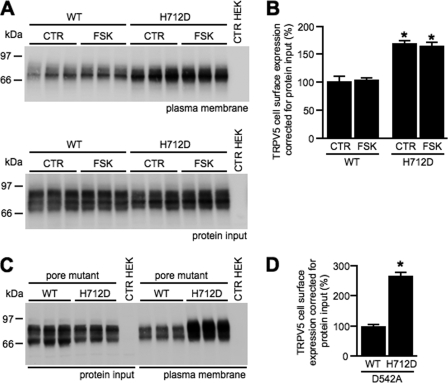
To identify the mechanism underlying the amplified currents of TRPV5-H712D, plasma membrane expression was assessed. A cell surface biotinylation was conducted on HEK293 cells transfected with either TRPV5-WT or TRPV5-H712D. Ten minutes before biotinylation, cells were stimulated with forskolin. Subsequently, cells were lysed, and biotinylated proteins were precipitated with neutravidin-agarose beads, and TRPV5 expression was studied using immunoblotting. Plasma membrane presence of the H712D mutant was elevated clearly in comparison with TRPV5-WT (Fig. 6, A and B). Forskolin stimulation did not affect plasma membrane presence of either protein. Importantly, expression of TRPV5-WT and TRPV5-H712D in whole cell lysates was similar. As a control for H712D, the positively charged arginine 707 was replaced by glutamic acid (R707E). Plasma membrane expression of R707E was not different from TRPV5-WT (supplemental Fig. 1).
FIGURE 6.
Plasma membrane presence of TRPV5-WT and TRPV5-H712D. Biotinylation studies of HEK293 cells expressing either TRPV5-WT or TRPV5-H712D (A) and in combination with the pore mutation TRPV5-D542A (C). B and D, quantification of TRPV5 cell surface expression of biotinylation studies by correcting for TRPV5 expression in total cell lysates. CTR HEK, nontransfected HEK293 cells. Protein input represents TRPV5 expression in total cell lysate. FSK, forskolin. CTR, control.
In 2008, de Graaf et al. (21) reported that [Ca2+]i increases TRPV5 recycling toward the plasma membrane. To verify that the increased plasma membrane expression of TRPV5-H712D was due directly to the H712D mutation and not secondary to an elevated [Ca2+]i, the pore mutation D542A was introduced. This mutation impedes Ca2+ selectivity, whereas Na+ still permeates the channel. Plasma membrane expression of TRPV5-D542A-H712D was increased (Fig. 6, C and D), whereas [Ca2+]i was not different from TRPV5-D542A or mock (data not shown).
Plasma Membrane Retrieval of TRPV5-H712D Is Delayed
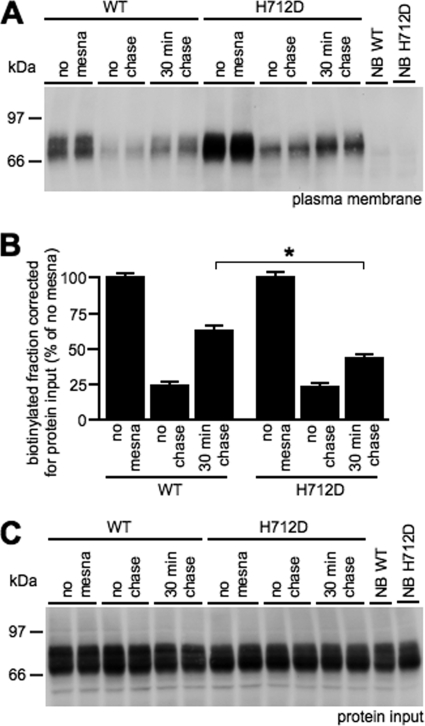
To elucidate how TRPV5-H712D plasma membrane abundance is elevated, an internalization assay was performed using HEK293 cells expressing TRPV5-WT or TRPV5-H712D. In short, cell surface proteins were probed with sulfo-NHS-SS-biotin, and cells were incubated for 30 min at 37 °C to allow internalization of biotinylated proteins. Finally, cells were treated with the membrane-impermeant mesna, removing all biotin bound to remaining cell surface proteins. In agreement with the previous figure, TRPV5-H712D plasma membrane presence was increased (Fig. 7A, no mesna). Mesna treatment removed ∼80% of the biotin attached to TRPV5 proteins in both TRPV5-WT and TRPV5-H712D (Fig. 7, A and B, no chase). A 30-min incubation at 37 °C increased the mesna-resistant fraction of TRPV5-WT by ∼40% (Fig. 7, A and B, 30-min chase). In contrast, only an additional ∼20% of biotinylated TRPV5-H712D was resistant to mesna. Importantly, expression of TRPV5-WT and TRPV5-H712D in total cell lysates was similar (Fig. 7C). This experiment demonstrates that retrieval rate of TRPV5-H712D channels from the cell surface is significantly slower than TRPV5-WT.
FIGURE 7.
Internalization assay demonstrates a delayed retrieval of TRPV5-H712D. A, biotinylated TRPV5-WT or TRPV5-H712D channels after treatment with mesna. NB, no biotin control. B, quantification of the biotinylated fraction of multiple experiments (n = 4) corrected for protein input as shown as percentage of no mesna conditions. C, total cell lysate of TRPV5-WT or TRPV5-H712D transfected HEK293 cells as referred to as protein input.
DISCUSSION
In this study, we identified the C-terminally located His712 as a critical residue for constitutive TRPV5 internalization. This conclusion is based on the following observations. First, functional analysis of C-terminal deletion mutants demonstrated the importance of residue His712 in the regulation of TRPV5 activity. Second, substitution of the positively charged His712 for a neutral or negative residue increased TRPV5 activity. Third, the effects observed for H712D were independent of protein kinase A-mediated phosphorylation of the nearby residue T709. Fourth, cell surface biotinylation revealed an increased abundance of TRPV5-H712D channels at the plasma membrane. Fifth, TRPV5-H712D exhibited a delayed internalization from the cell surface, likely causing the increased plasma membrane presence.
We employed fura-2 analysis to investigate TRPV5 function. Fura-2 is a ratiometric dye and readout of [Ca2+]i is, therefore, independent of the dye concentration, illumination intensity, and optical path length. TRPV5-transfected cells exhibited significantly elevated [Ca2+]i in comparison with mock confirming the constitutive active nature of TRPV5. The observed elevation in resting [Ca2+]i was due to TRPV5-mediated Ca2+ influx as replacement of the extracellular Ca2+ solution by EGTA resulted in a decrease of [Ca2+]i. In this situation, Ca2+ influx into the cell is minimized, whereas [Ca2+]i is pumped out of the cell. Switching back to the [Ca2+]e solution induced a rapid increase of [Ca2+]i, reaching levels above the basal [Ca2+]i. This overshoot in [Ca2+]i, described as maximal [Ca2+]i, is likely a specific TRPV5 characteristic, as it was not observed in cells expressing the heterologous channel TRPV6 (data not shown). This phenomenon might be due to the relatively slow Ca2+-induced inactivation of TRPV5 compared with TRPV6 (22).
Using fura-2 analysis, a critical role for the positive charge of His712 in regulating TRPV5 activity was identified, as deletion or substitution resulted in enhanced channel activity. Residue His712 is in close proximity to the conserved protein kinase A phosphorylation site Thr709 regulating TRPV5 open probability by the calciotropic hormone parathyroid hormone (15). As substitution of both Thr709 and His712 by a negatively charged residue elevated basal [Ca2+]i to a similar extent, we investigated whether both mutants concealed a similar activation mechanism. Nevertheless, protein kinase A-mediated stimulation by forskolin was not compromised in TRPV5-H712D, suggesting independent pathways for the elevated TRPV5 activity. This was confirmed by fura-2 analysis of the maximal [Ca2+]i, which revealed that the overshoot of [Ca2+]i of TRPV5-H712D was increased significantly in comparison with T709D. This implies that the elevated basal activity of both mutants is caused by two distinct molecular mechanisms. Indeed, the T709D mutant leads to an increase in channel open probability (15), whereas cell surface biotinylation studies demonstrated an increased plasma membrane abundance of TRPV5-H712D. Thus, an enlarged maximal [Ca2+]i, as detected by fura-2 analysis, implies an elevation in TRPV5 plasma membrane expression. Moreover, replacing the positively charged Arg707 by glutamic acid (R707E) did not affect the cell surface expression of TRPV5, demonstrating the specific role for His712 in TRPV5 plasma membrane trafficking.
Interestingly, introduction of the D542A mutation, which prevents Ca2+ influx, further increased plasma membrane expression of TRPV5-H712D (supplemental Fig. 2). This indicates that a high [Ca2+]i, as present in cells expressing TRPV5-H712D, prevents full plasma membrane accumulation of this mutant. This is in contrast with observations in neuronal cells, where intracellular Ca2+ elevations induce synaptic vesicle fusion and reduce endocytosis, resulting in an elevated plasma membrane presence of synaptic ion channels (23, 24).
Finally, an internalization assay was implemented to study the role for residue His712 in TRPV5 channel retrieval. Pilot experiments did not reveal any internalization of TRPV5-H712D after a 5-min incubation at 37 °C, which was detected for TRPV5-WT. Analysis after 30 min of incubation at 37 °C demonstrated a significant delayed channel retrieval for the H712D mutant, which ultimately results in an increased plasma membrane abundance. Recent investigations shed light on the process of TRPV5 retrieval from the plasma membrane. In 2007, de Graaf et al. (21) found that constitutive TRPV5 internalization is clathrin-dependent. Cha et al. (25) demonstrated the involvement of caveolae in TRPV5 endocytosis. PKC stimulation via parathyroid hormone or 1-oleoyl-2-acetyl-sn-glycerol activated TRPV5 via an enhanced plasma membrane expression, which was absent in cells treated with caveolin-1 siRNA or caveolin-1-negative cells (25). Using the dominant-negative dynamin mutant K44A, both studies revealed a crucial role for dynamin in TRPV5 endocytosis. In addition, TRPV5 plasma membrane expression is regulated by various physiological stimuli including the β-glucuronidase klotho, tissue kallikrein, and extracellular pH (16, 26, 27). In this study, we identified the first residue within TRPV5 essential for constitutive internalization. It is not yet clear whether physiological stimuli can modify internalization via His712; however, future research should unravel such a mechanism.
The critical role for His712 also became apparent by its conservation among different mammalian species. In general, classical internalization signals (28–30) are composed of several residues, none of them resembling the amino acids surrounding His712. Removal of residues after His712 did not increase TRPV5 activity. Therefore, the contribution of the highly conserved residues upstream of His712 (Leu710 and Gly711) in TRPV5 internalization remains to be investigated in the future. Altogether, this study demonstrated an essential role for residue His712 in TRPV5 plasma membrane trafficking.
Supplementary Material
Footnotes
This work was supported by grants from the Dutch Kidney Foundation (C03.6017 and C06.2170) and the Netherlands Organization for Scientific Research (NWO-ALW 814.02.001, NWO-CW 700.55.302, and ZonMw 9120.6110).

The on-line version of this article (available at http://www.jbc.org) contains supplemental Figs. 1 and 2.
REFERENCES
- 1.van de Graaf S. F., Bindels R. J., Hoenderop J. G. (2007) Rev. Physiol. Biochem. Pharmacol. 158, 77–160 [DOI] [PubMed] [Google Scholar]
- 2.Suzuki Y., Landowski C. P., Hediger M. A. (2008) Annu. Rev. Physiol. 70, 257–271 [DOI] [PubMed] [Google Scholar]
- 3.de Groot T., Bindels R. J., Hoenderop J. G. (2008) Kidney Int. 74, 1241–1246 [DOI] [PubMed] [Google Scholar]
- 4.Schoeber J. P., Hoenderop J. G., Bindels R. J. (2007) Biochem. Soc. Trans. 35, 115–119 [DOI] [PubMed] [Google Scholar]
- 5.Hoenderop J. G., van Leeuwen J. P., van der Eerden B. C., Kersten F. F., van der Kemp A. W., Mérillat A. M., Waarsing J. H., Rossier B. C., Vallon V., Hummler E., Bindels R. J. (2003) J. Clin. Invest. 112, 1906–1914 [DOI] [PMC free article] [PubMed] [Google Scholar]
- 6.Venkatachalam K., Montell C. (2007) Annu. Rev. Biochem. 76, 387–417 [DOI] [PMC free article] [PubMed] [Google Scholar]
- 7.den Dekker E., Hoenderop J. G., Nilius B., Bindels R. J. (2003) Cell Calcium 33, 497–507 [DOI] [PubMed] [Google Scholar]
- 8.Vennekens R., Owsianik G., Nilius B. (2008) Curr. Pharm.. Des. 14, 18–31 [DOI] [PubMed] [Google Scholar]
- 9.Nilius B., Vennekens R., Prenen J., Hoenderop J. G., Droogmans G., Bindels R. J. (2001) J. Biol. Chem. 276, 1020–1025 [DOI] [PubMed] [Google Scholar]
- 10.Chang Q., Gyftogianni E., van de Graaf S. F., Hoefs S., Weidema F. A., Bindels R. J., Hoenderop J. G. (2004) J. Biol. Chem. 279, 54304–54311 [DOI] [PubMed] [Google Scholar]
- 11.Erler I., Hirnet D., Wissenbach U., Flockerzi V., Niemeyer B. A. (2004) J. Biol. Chem. 279, 34456–34463 [DOI] [PubMed] [Google Scholar]
- 12.Phelps C. B., Huang R. J., Lishko P. V., Wang R. R., Gaudet R. (2008) Biochemistry 47, 2476–2484 [DOI] [PMC free article] [PubMed] [Google Scholar]
- 13.Gaudet R. (2008) Mol. Biosyst. 4, 372–379 [DOI] [PMC free article] [PubMed] [Google Scholar]
- 14.Yeh B. I., Yoon J., Huang C. L. (2006) J. Membr. Biol. 212, 191–198 [DOI] [PubMed] [Google Scholar]
- 15.de Groot T., Lee K., Langeslag M., Xi Q., Jalink K., Bindels R. J., Hoenderop J. G. (2009) J. Am. Soc. Nephrol. 20, 1693–1704 [DOI] [PMC free article] [PubMed] [Google Scholar]
- 16.Gkika D., Topala C. N., Chang Q., Picard N., Thébault S., Houillier P., Hoenderop J. G., Bindels R. J. (2006) EMBO J. 25, 4707–4716 [DOI] [PMC free article] [PubMed] [Google Scholar]
- 17.van de Graaf S. F., Hoenderop J. G., Gkika D., Lamers D., Prenen J., Rescher U., Gerke V., Staub O., Nilius B., Bindels R. J. (2003) EMBO J. 22, 1478–1487 [DOI] [PMC free article] [PubMed] [Google Scholar]
- 18.van de Graaf S. F., Chang Q., Mensenkamp A. R., Hoenderop J. G., Bindels R. J. (2006) Mol. Cell. Biol. 26, 303–312 [DOI] [PMC free article] [PubMed] [Google Scholar]
- 19.Nilius B., Weidema F., Prenen J., Hoenderop J. G., Vennekens R., Hoefs S., Droogmans G., Bindels R. J. (2003) Pflugers Arch. 445, 584–588 [DOI] [PubMed] [Google Scholar]
- 20.Vennekens R., Hoenderop J. G., Prenen J., Stuiver M., Willems P. H., Droogmans G., Nilius B., Bindels R. J. (2000) J. Biol. Chem. 275, 3963–3969 [DOI] [PubMed] [Google Scholar]
- 21.van de Graaf S. F., Rescher U., Hoenderop J. G., Verkaart S., Bindels R. J., Gerke V. (2008) J. Biol. Chem. 283, 4077–4086 [DOI] [PubMed] [Google Scholar]
- 22.Hoenderop J. G., Nilius B., Bindels R. J. (2005) Physiol. Rev. 85, 373–422 [DOI] [PubMed] [Google Scholar]
- 23.Stojilkovic S. S. (2005) Trends Endocrinol. Metab. 16, 81–83 [DOI] [PubMed] [Google Scholar]
- 24.Cousin M. A., Robinson P. J. (2000) J. Neurosci. 20, 949–957 [DOI] [PMC free article] [PubMed] [Google Scholar]
- 25.Cha S. K., Wu T., Huang C. L. (2008) Am. J. Physiol. Renal Physiol. 294, F1212–1221 [DOI] [PubMed] [Google Scholar]
- 26.Chang Q., Hoefs S., van der Kemp A. W., Topala C. N., Bindels R. J., Hoenderop J. G. (2005) Science 310, 490–493 [DOI] [PubMed] [Google Scholar]
- 27.Lambers T. T., Oancea E., de Groot T., Topala C. N., Hoenderop J. G., Bindels R. J. (2007) Mol. Cell. Biol. 27, 1486–1494 [DOI] [PMC free article] [PubMed] [Google Scholar]
- 28.McPherson P. S., Ritter B. (2005) Mol. Neurobiol. 32, 73–87 [DOI] [PubMed] [Google Scholar]
- 29.Bonifacino J. S., Traub L. M. (2003) Annu. Rev. Biochem. 72, 395–447 [DOI] [PubMed] [Google Scholar]
- 30.Sorkin A. (2004) Curr. Opin. Cell Biol. 16, 392–399 [DOI] [PubMed] [Google Scholar]
Associated Data
This section collects any data citations, data availability statements, or supplementary materials included in this article.


