Abstract
High concentrations of urea were shown to induce a paradoxical regulatory volume decrease response with K+ channel opening and subsequent hepatocyte shrinkage (Hallbrucker, C., vom Dahl, S., Ritter, M., Lang, F., and Häussinger, D. (1994) Pflügers Arch. 428, 552–560), although the hepatocyte plasma membrane is thought to be freely permeable to urea. The underlying mechanisms remained unclear. As shown in the present study, urea (100 mmol/liter) induced within 1 min an activation of β1 integrins followed by an activation of focal adhesion kinase, c-Src, p38MAPK, extracellular signal-regulated kinases, and c-Jun N-terminal kinase. Because α5β1 integrin is known to act as a volume/osmosensor in hepatocytes, which becomes activated in response to hepatocyte swelling, the findings suggest that urea at high concentrations induces a nonosmotic activating perturbation of this osmosensor, thereby triggering a volume regulatory K+ efflux. In line with this, similar to hypo-osmotic hepatocyte swelling, urea induced an inhibition of hepatic proteolysis, which was sensitive to p38MAPK inhibition. Molecular dynamics simulations of a three-dimensional model of the ectodomain of α5β1 integrin in water, urea, or thiourea solutions revealed significant conformational changes of α5β1 integrin in urea and thiourea solutions, in contrast to the simulation of α5β1 in water. These changes lead to an unbending of the integrin structure around the genu, which may suggest activation, whereas the structures of single domains remained essentially unchanged. It is concluded that urea at high concentrations affects hepatic metabolism through direct activation of the α5β1 integrin system.
Keywords: Integrin, Liver, MAP Kinases (MAPKs), Metabolism, Urea, Osmosensing, Osmosignaling
Introduction
Whereas urea synthesis and transport have been subjected to intense research over many years, little attention has been paid to potential metabolic effects of urea in liver, whose concentration in plasma is ∼5 mmol/liter under physiological conditions but may rise to 100 mmol/liter and more in uremia. Urea is assumed to be metabolically inert, although urea at high concentrations can interfere with enzyme activities (1, 2) and protein structure (2, 3). Despite rapid equilibration across the hepatocyte plasma membrane via aquaporins (4), urea at high concentrations was shown to induce hepatocyte shrinkage due to an opening of K+ channels in the plasma membrane (5). Kinetics and pharmacological characteristics of the urea-induced K+ efflux from the hepatocyte were similar to those observed during volume regulatory decrease in response to hypo-osmotic exposure of perfused rat liver (5) but different from the K+ efflux induced by hydroperoxides (6). The α5β1 integrins, which are the predominant integrins in liver (7), were recently identified as a volume/osmosensing element in perfused rat liver and rat hepatocytes (8), which mediates several metabolic effects of hepatocyte swelling in response to hypo-osmotic exposure or insulin (9, 10). Here, hepatocyte swelling induces rapid activation of the β1 subunit of integrins with a subsequent activation of focal adhesion kinase (FAK), c-Src, and the mitogen-activated protein kinases Erk and p38MAPK (8). Integrin-mediated p38MAPK activation was shown to mediate the inhibition of proteolysis in response to hepatocyte swelling (9), insulin (10), and tauroursodesoxycholate (8), and evidence has been presented that the p38MAPK pathway participates in volume regulatory K+ efflux (11). As shown in the present study, urea at high concentrations can activate the hepatic β1 integrin system and initiate integrin-dependent signaling. Molecular dynamics simulations of the ectodomain of α5β1 integrin revealed significant conformational changes of the protein in urea and thiourea solutions leading to an unbending of the integrin structure, which is required for activation (12).
EXPERIMENTAL PROCEDURES
Materials
The integrin antagonistic GRGDSP peptide (integrin-antagonistic GRGDSP hexapeptide) and the nonantagonistic GRGESP peptide (nonantagonistic GRGESP control hexapeptide) were from Bachem (Heidelberg, Germany). Antibodies recognizing pFAK, p-p38MAPK, pJNK1/2, and total c-Src were from BioSource Int. (Camarillo, CA). The antibodies raised against total FAK and total p38MAPK were from Santa Cruz Biotechnology (Santa Cruz, CA); antibodies against p-c-Src-Tyr418 were from Calbiochem; antibodies against total JNK1/2 were from BD Pharmingen (San Jose, CA); antibodies against pErk1/2 were from Cell Signaling (Beverly, MA); and antibodies against Erk1/2 were from Upstate Biotechnology (Lake Placid, NY). l-[4,5-3H]leucine was from Amersham Biosciences. PP-2 was from Biomol (Plymouth, PA), and FITC-coupled phalloidin was from Sigma. The polyclonal goat anti-α5β1 integrin dimer antibody and the monoclonal mouse anti-β1 integrin subunit active conformation antibody were from Chemicon (Temecula, CA). All other chemicals were from Merck at the highest quality available.
Liver Perfusion
The experiments were approved by the responsible local authorities. Livers from male Wistar rats (120–150 g of body mass), fed a standard chow, were perfused as described previously (13) in a nonrecirculating manner. The perfusion medium was the bicarbonate-buffered Krebs-Henseleit saline plus l-lactate (2.1 mm) and pyruvate (0.3 mm) gassed with O2, CO2 (95:5, v/v). The temperature was 37 °C. In normo-osmotic perfusions, the osmolarity was 305 mosmol/liter. Hypo-osmotic exposure (225 mosmol/liter) was performed by lowering the NaCl concentration in the perfusion medium. The addition of inhibitors to influent perfusate was made either by use of precision micropumps or by dissolution into the Krebs-Henseleit buffer. Viability of the perfused livers was assessed by measuring lactate dehydrogenase leakage into the perfusate, which did not exceed 20 milliunits min−1 g liver−1. The portal pressure was routinely monitored with a pressure transducer (Hugo Sachs Electronics, Hugstetten, Germany) (14). Mean portal pressure was 3.0 ± 0.1 cm H2O (n = 77). Perfusion pressure changes induced upon addition of the respective stimuli and/or inhibitors did not exceed 0.6 cm H2O. The effluent K+ concentration was monitored continuously with a K+-sensitive electrode (Radiometer, Munich, Germany); K+ fluxes were determined by planimetry of areas under curves (15).
Measurement of Proteolysis in Perfused Rat Liver
The rate of proteolysis was assessed by measuring the release of 3H from isolated perfused rat livers after prelabeling of liver proteins in vivo by intraperitoneal injection of 150 μCi of l-[4,5-3H]leucine 16–20 h before the perfusion experiment (16). After a preperfusion period of 80 min, the release of the trichloroacetic acid-soluble 3H label reached a steady state (∼500 cpm min−1 g liver−1) and was associated with effluent leucine by >95% as shown by chromatographic analysis (17). The release of label remained almost constant for another 80–100 min and was seen to be derived from intracellular protein breakdown because leucine is neither synthesized nor catabolized in liver. In these experiments, the influent perfusate was supplemented with unlabeled leucine (100 μmol/liter) to prevent reutilization of [3H]leucine for protein synthesis, although the addition of unlabeled leucine had no effect on 3H-labeled release from the liver, indicating that [3H]leucine reutilization for protein synthesis was negligible. To correct for different labeling of hepatic proteins after intraperitoneal injection in the individual perfusion experiment, the rate of proteolysis was set to 100% under normo-osmotic control conditions, and the extent of inhibition of proteolysis was determined 30 min after institution of the respective conditions, a time point when a new steady state had been reached.
Tissue Processing for Western Blot Analysis
For Western blot determinations, liver lobes from perfused liver were excised in a way that kept portal pressure constant at the respective time points (0, 1, 5, 15, 30, and 60 min after infusion of hypo-osmolarity or urea) and homogenized with an Ultraturrax (Janke & Kunkel, Staufen, Germany) at 0 °C in lysis buffer containing 20 mm Tris/HCl (pH 7.4), 140 mm NaCl, 10 mm NaF, 10 mm sodium pyrophosphate, 1% Triton X-100, 1 mm EDTA, 1 mm EGTA, 1 mm sodium vanadate, 20 mm β-glycerophosphate, and protease inhibitor mixture (Roche Applied Science).
Western Blot Analysis
The lysed samples from the perfused liver were centrifuged at 4 °C, and the supernatant was used for SDS-PAGE and subsequent Western blot analysis. Therefore, an identical volume of 2× gel loading buffer containing 200 mm dithiothreitol (pH 6.8) was added to the lysates. After heating to 95 °C for 5 min, the proteins were subjected to SDS-PAGE. Following electrophoresis, gels were equilibrated with transfer buffer (39 mm glycine, 48 mm Tris/HCl, 0.03% SDS, and 20% methanol). Proteins were transferred to nitrocellulose membranes using a semidry transfer apparatus (Amersham Biosciences). Blots were blocked overnight in 1% bovine serum albumin solubilized in 20 mm Tris/HCl (pH 7.5), containing 150 mm NaCl and 0.1% Tween 20 and then incubated for 3–4 h with the respective primary antibodies raised against pFAK, FAK, p-c-Src-Tyr418, c-Src, p-p38MAPK, p38MAPK, pErk1/2, Erk1/2, pJNK1/2, JNK1/2. Following washing and incubation for 2 h with horseradish peroxidase-coupled secondary antibody (1:10.000), the blots were washed again and developed using enhanced chemiluminescent detection (Amersham Biosciences). Blots were then analyzed densitometrically and normalized to total protein amount.
Immunofluorescence Staining of the α5β1 Integrin Dimer and Active Conformation of β1 Integrin Subunit
Cryosections of perfused livers were analyzed for total α5β1 integrin expression, induction of the active conformation of the β1 integrin subunit, and integrity of the actin cytoskeleton by using a Leica TCS-NT confocal laser scanning system with an argon-krypton laser on a Leica DM IRB inverted microscope (Bensheim, Germany) as described (10). For immunohistochemistry of liver slices as primary antibodies, the polyclonal goat anti-α5β1 integrin dimer antibody (1:100) and the monoclonal mouse anti-β1 integrin subunit active conformation antibody (1:100) were used. To visualize filamentous actin in order to document cell shape, FITC-coupled phalloidin (1 μg/ml) was applied.
Homology Modeling of α5β1 Integrin
To generate a starting structure for molecular dynamics simulations, a three-dimensional model of the ectodomain of α5β1 integrin was obtained by homology modeling. Initially, for human α2–α9 and αV as well as β1–β8 sequences, multiple sequence alignments were generated with ClustalW (version 2.0.12) (18). The alignments were manually curated to optimize the alignment of cystein residues involved in disulfide bridges. Ten homology models each were then constructed for the α5 and β1 subunits using the program MODELLER (version 7.7) (19), and the best models were chosen according to the MODELLER score. The crystal structure of the ectodomain of the αVβ3 integrin was used (Protein Data Bank code 1U8C) as a template, which has a resolution of 3.1 Å (12). In the template structure, the EGF1/2 domains have not been resolved, which would provide a link between the hybrid domain and the EGF3 domain. Hence, these domains are not available in the three-dimensional model of α5β1 integrin either. The electron density of EGF1/2 was not well defined (12), indicating a low structural stability of these domains. Thus, we do not expect a major role of these domains in terms of stabilizing the bent conformation of the α5β1 integrin starting structure. Furthermore, we compare the conformational stability of α5β1 integrin in different solvents. The absence of the EGF1/2 domains should have a similar effect in all of these investigations.
Molecular Dynamics Simulations
Molecular dynamics simulations were performed with the AMBER 10 suite of programs (20) together with the force field as described by Cornell et al. (21) using modifications suggested by Simmerling et al. (22).
For the simulation in explicit water, the α5β1 integrin starting structure was placed into an octahedral periodic box of TIP3P water molecules (23). The distance between the edges of the water box and the closest atom of the protein was at least 11 Å, resulting in a system of ∼210,000 atoms. The system was minimized by 50 steps of steepest descent minimization followed by 450 steps of conjugate gradient minimization. The particle mesh Ewald method (24) was used to treat long range electrostatic interactions, and bond lengths involving bonds to hydrogen atoms were constrained using SHAKE (25). The time step for all molecular dynamics (MD)2 simulations was 2 fs with a direct space, nonbonded cut-off of 8 Å. Applying harmonic restraints with force constants of 5 kcal mol−1 Å−2 to all solute atoms, canonical ensemble (NVT, constant number of particles (N), volume (V), and temperature (T))-MD was carried out for 50 ps, during which the system was heated from 100 to 300 K. Subsequent isothermal isobaric-ensemble (NPT, constant number of particles (N), pressure (P), and temperature (T))-MD was used for 150 ps to adjust the solvent density. Finally, the force constants of the harmonic restraints on solute atom positions were gradually reduced to zero during 100 ps of NVT-MD. The following 200 ns of NVT-MD at 300 K with a time constant of 10 ps for heat-bath coupling were used for analysis, with conformations extracted every 20 ps.
The starting structure of α5β1 integrin for the simulations in urea and thiourea solutions was extracted from the explicit water simulation after 40 ns of simulation time. The structure was placed into octahedral periodic boxes of ∼140 mm urea and thiourea in TIP3P water, respectively, as described above for the explicit water case. These solutions had been prepared by (i) generating atomic charges for urea and thiourea following the RESP procedure (26), (ii) parameterizing urea and thiourea using the GAFF force field (27), and (iii) pre-equilibrating the solvent boxes at 300 K and 1 atmosphere. After equilibration of the protein-solvent systems as described above, 200 ns of NVT-MD at 300 K were performed for production, with conformations extracted every 20 ps.
Statistics
Results from at least three independent experiments are expressed as means ± S.E. of the mean, n refers to the number of independent experiments. Results were analyzed using Student's t test; p < 0.05 was considered statistically significant.
RESULTS
Activation of the Integrin System by Urea and Thiourea
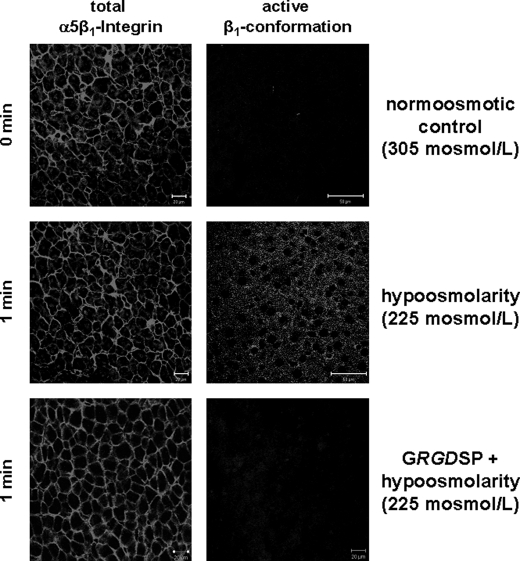
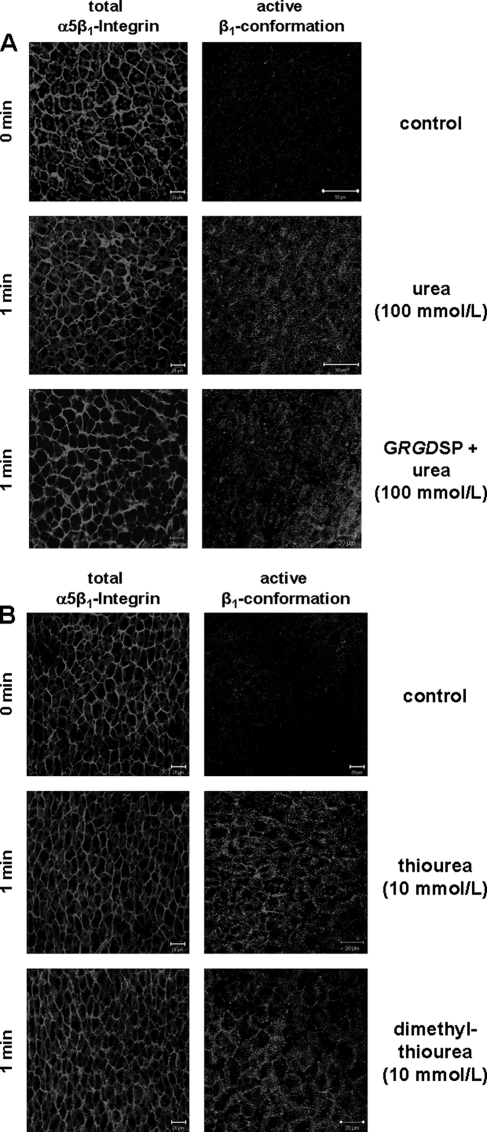
In line with previous data (10), sections of normo-osmotically (305 mosmol/liter) perfused rat liver strongly immunostained for α5β1 integrin, which is predominantly located at the plasma membrane (Fig. 1). Little or no immunostaining is found under these conditions with an antibody, which detects the activated conformation of the β1 subunit only (Fig. 1). When, however, hypo-osmotic (225 mosmol/liter) perfusion is instituted, within 1 min immunoreactivity of the activated β1 conformation becomes detectable, in line with the recently reported activation of integrins by hypo-osmotic hepatocyte swelling. Hypo-osmotic β1-integrin activation was abolished in the presence of an integrin antagonistic peptide (i.e. GRGDSP, 10 mmol/liter) (Fig. 1) (8). As shown in Fig. 2A, a similar response is observed, when urea (100 mosmol/liter) was added to influent perfusate, indicating that the hepatic integrin system is activated by urea. Under these conditions, the osmolarity in influent perfusate increased from 305 to 405 mosmol/liter. However, in contrast to hypo-osmotic-induced integrin activation, urea-induced activation of the integrin system was insensitive to an integrin-antagonistic peptide (i.e. GRGDSP, 10 mmol/liter) suggestive for an unspecific activation of the α5β1 integrin system (Fig. 2A). Thiourea (Fig. 2B) and dimethylthiourea (data not shown), respectively, also induced within 1 min immunoreactivity of the activated β1 integrin subunit at a dose of 10 mmol/liter.
FIGURE 1.
Hypo-osmolarity-induced activation of the β1 integrin subunit in the perfused rat liver. Rat livers were perfused as described under “Experimental Procedures,” and liver samples were taken immediately before (t = 0 min) and after 1 min of hypo-osmotic perfusion (225 mosmol/liter). As indicated, the integrin antagonistic peptide GRGDSP (10 mmol/liter) was added 30 min prior to infusion of hypo-osmolarity. Immunoreactivity of the activated β1 integrin subunit or the α5β1 integrin heterodimer was assessed by confocal laser scanning microscopy of frozen liver sections of the respective liver samples. In line with previous studies (10), hypo-osmolarity induced within 1 min the appearance of activated β1 integrin immunoreactivity, suggesting activation of the integrin system in a GRGDSP peptide-sensitive manner (right panel). Immunoreactivity of the total α5β1 integrin heterodimer (left panel) remained unchanged under these conditions.
FIGURE 2.
Urea-induced activation of the β1 integrin subunit in the perfused rat liver. Rat livers were perfused as described under “Experimental Procedures,” and liver samples were taken immediately before (t = 0 min) and 1 min after the addition of either urea (100 mmol/liter; A), thiourea, or dimethylthiourea (10 mmol/liter each; B). As indicated, the integrin-antagonistic peptide GRGDSP (10 mmol/liter) was added 30 min prior to infusion of urea. Immunoreactivity of the activated β1 integrin subunit or the α5β1 integrin heterodimer were assessed by confocal laser scanning microscopy of frozen liver sections of the respective liver samples. Like hypo-osmolarity, urea, thiourea, and dimethylthiourea also induced within 1 min an increased immunoreactivity of the activated β1 integrin conformation suggestive for an activation of the integrin system (right panel). In contrast to hypo-osmolarity, urea-induced activation of the integrin system was insensitive toward the integrin-antagonistic GRGDSP peptide. Immunoreactivity of the total α5β1 integrin heterodimer (left panel) remained unchanged under these conditions.
Urea Triggers Integrin-dependent Signaling and Downstream Responses
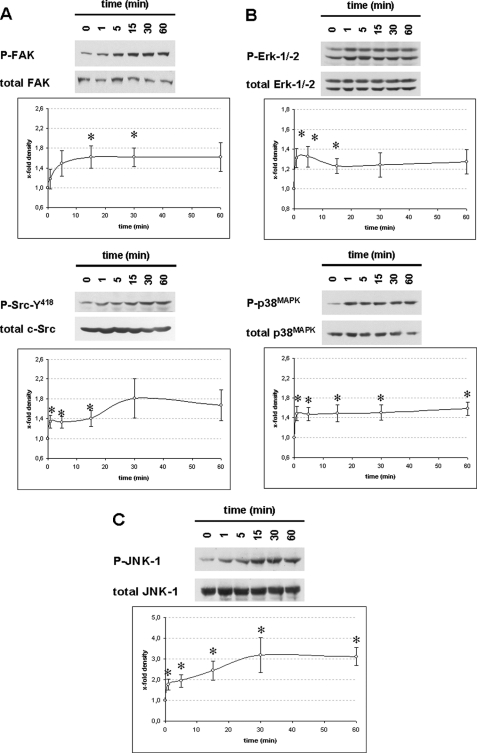
In line with urea-induced integrin activation, urea also triggered integrin-dependent signaling pathways (8). Urea (100 mmol/liter) induced activation of FAK, increased the activating phosphorylation of c-Src at tyrosine 418 (Fig. 3A) and activated extracellular signal regulated kinases (Erks) and p38MAPK (Fig. 3B) as well as JNK (Fig. 3C). Interestingly, phosphorylation of JNK seems to follow a rapid phase (1 min) followed by a slow phase (2–30 min). This biphasic response might be explained by urea acting not only on integrins but on other proteins as well resulting in an unfolding protein response involving JNK activation. Significant urea-induced p38MAPK activation was detectable within 1 min (Fig. 3B).
FIGURE 3.
Urea-induced activation of FAK, c-Src, Erk, p38MAPK and JNK in perfused rat liver. Rat livers were perfused with urea (100 mmol/liter) as described under “Experimental Procedures” for up to 60 min. Liver samples were taken at the time points indicated (t = 0 min, immediately before urea infusion). Activation of FAK (∼125 kDa), c-Src (∼60 kDa), Erk1/2 (∼44/42 kDa), p38MAPK (∼38 kDa), and JNK1/2 (∼46/54 kDa) was analyzed by Western blot using phosphospecific antibodies and subsequent densitometric analysis. Total FAK, c-Src, Erk, p38MAPK, and JNK served as respective loading control. Phosphorylation at t = 0 min was arbitrarily set as 1. Representative blots from at least six independent perfusion experiments are shown. Data are given as means ± S.E. of the mean. *, statistical significance compared with the unstimulated control (i.e. t = 0 min). Urea leads to a significant activation of FAK and c-Src (A), Erk and p38MAPK (B) as well as JNK (C) in the perfused rat liver.
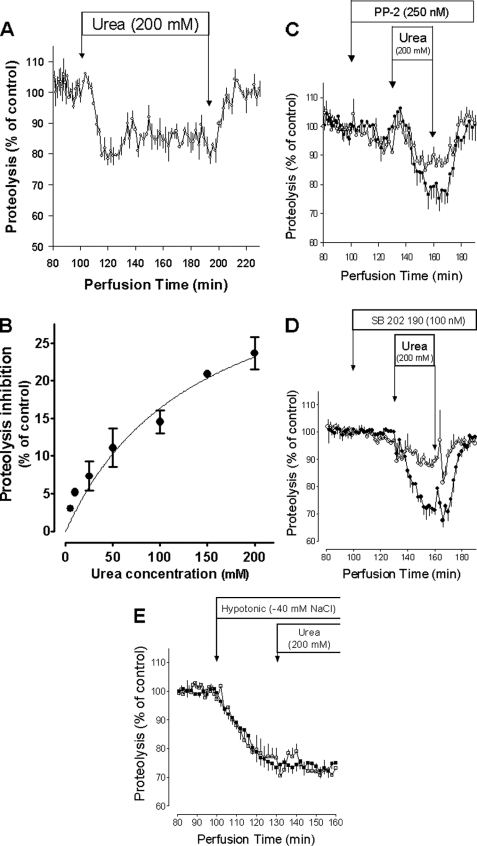
Hypo-osmotic and insulin-induced integrin- and p38MAPK activation was shown recently to mediate an inhibition of autophagic proteolysis in perfused rat liver (9, 10). Similar to this, urea also induced a dose-dependent inhibition of hepatic proteolysis, which was fully reversible upon urea withdrawal (Fig. 4, A and B). Inhibition of c-Src by PP-2 (28) or p38MAPK by SB202190 (29), respectively, strongly blunted the antiproteolytic effect of urea, pointing to a c-Src and p38MAPK dependence of the process (Fig. 4, C and D). Furthermore, the antiproteolytic effect of urea was strongly blunted when integrin-dependent osmosignaling was preactivated by hypo-osmotic exposure (Fig. 4E).
FIGURE 4.
Urea-induced inhibition of autophagic proteolysis in the perfused rat liver. Livers from fed rats were prelabeled in vivo by intraperitoneal injection of 150 μCi of [3H]leucine. 3H-labeled release into effluent was monitored as a measure of hepatic proteolysis in liver perfusion experiments as described previously (16). Because of differences in the labeling of the animals in vivo, the release of radioactivity was set to 100% during control conditions in the identical perfusion experiment. As indicated, PP-2 (250 nmol/liter; C) or SB202190 (100 nmol/liter; D), respectively, were added 30 min prior to infusion of urea. Data are given as means ± S.E of the mean, and are from at least three separate perfusion experiments. Urea inhibited autophagic proteolysis dose-dependently (A and B). Inhibition of c-Src by PP-2 (C; ○) or p38MAPK by SB202190 (D; ○) abolished urea-induced inhibition of autophagic proteolysis (C and D; ●). If urea was added on top of a hypo-osmotic exposure (□), urea did not lead to a further increase in inhibition of proteolysis compared with hypo-osmolarity alone (■) (E) indicating that the effects of both stimuli are not additive.
Urea and its thioanalogues induced a decrease of perfused liver mass (Table 1), suggestive for induction of a regulatory volume decrease (RVD). Such an RVD in response to urea is accompanied by a net K+ release from the liver and leads to hepatocyte shrinkage (5). In response to urea, this RVD, as measured by the urea-induced decrease of liver mass, was sensitive to PP-2 and SB203580 (Table 1), indicating the c-Src and p38MAPK dependence of this process, as it was shown previously for the hypo-osmolarity-induced RVD (9, 11). In contrast to hypo-osmolarity-induced RVD (9), urea- induced RVD was not sensitive to GRGDSP peptide (Table 1). This suggests a ligand-independent integrin activation by urea. Furthermore, the urea-induced, but not the hypo-osmolarity-induced appearance of activated β1 integrin also was insensitive to inhibition by GRGDSP peptide (see Fig. 2A, compare Fig. 1).
TABLE 1.
Urea-induced changes in liver mass in perfused rat liver
Rat livers were perfused as described under “Experimental Procedures.” Data are given as mean ± S.E. of the mean; n refers to the number of independent perfusion experiments. When indicated, integrin-antagonistic GRGDSP peptide (10 mmol/liter), nonantagonistic GRGESP control peptide (10 mmol/liter), PP-2 (250 nmol/liter), or SB203580 (100 nmol/liter) were instituted 30 min prior to the infusion of urea or the respective urea derivates. Liver mass was continuously monitored and maximal change in liver mass, which was reached within 303 ± 15 s (n = 77), was determined.
| Condition | Change in liver mass | n |
|---|---|---|
| % of total liver mass | ||
| Control | ±0.0 ± 0.0 | 3 |
| Urea (5 mm) | ±0.0 ± 0.0 | 3 |
| Urea (100 mm) | −4.6 ± 0.5 | 9 |
| +GRGDSP | −4.0 ± 0.9 | 3 |
| +GRGESP | −5.1 ± 0.2 | 3 |
| +PP2 | −2.7 ± 0.3a | 3 |
| +SB203580 | −1.6 ± 0.8a | 3 |
| Urea (200 mm) | −5.4 ± 0.5 | 11 |
| +SB203580 | −2.6 ± 0.4a | 3 |
| Methylurea (100 mm) | −1.9 ± 0.2 | 3 |
| Dimethylurea (100 mm) | −2.1 ± 0.6 | 3 |
| Thiourea (10 mm) | −1.8 ± 0.3 | 3 |
| Thiourea (50 mm) | −4.4 ± 0.9 | 5 |
| +SB203580 | −1.3 ± 0.8a | 3 |
| Thiourea (100 mm) | −5.6 ± 1.6 | 4 |
| Thiourea (200 mm) | −6.2 ± 0.6 | 3 |
| Dimethylthiourea (100 mm) | −5.1 ± 0.8 | 4 |
| Hypo-osmolarity (−30 mm NaCl) | +10.0 ± 1.3 | 4 |
| Hypo-osmolarity (−40 mm NaCl) | +12.6 ± 0.8 | 4 |
a The asterisk indicates a significant inhibition of urea-induced change in liver mass by the respective inhibitor (p < 0.05).
Molecular Dynamics Simulations of α5β1 Integrin in Urea and Thiourea Solutions
The GRGDSP peptide-insensitivity of urea-induced β1 integrin activation would be compatible with conformational changes of the β1 subunit triggered by unspecific interactions with urea. Therefore, molecular dynamics simulations of the α5β1 ectodomain were performed, starting from a homology model of the ectodomain in a bent conformation.
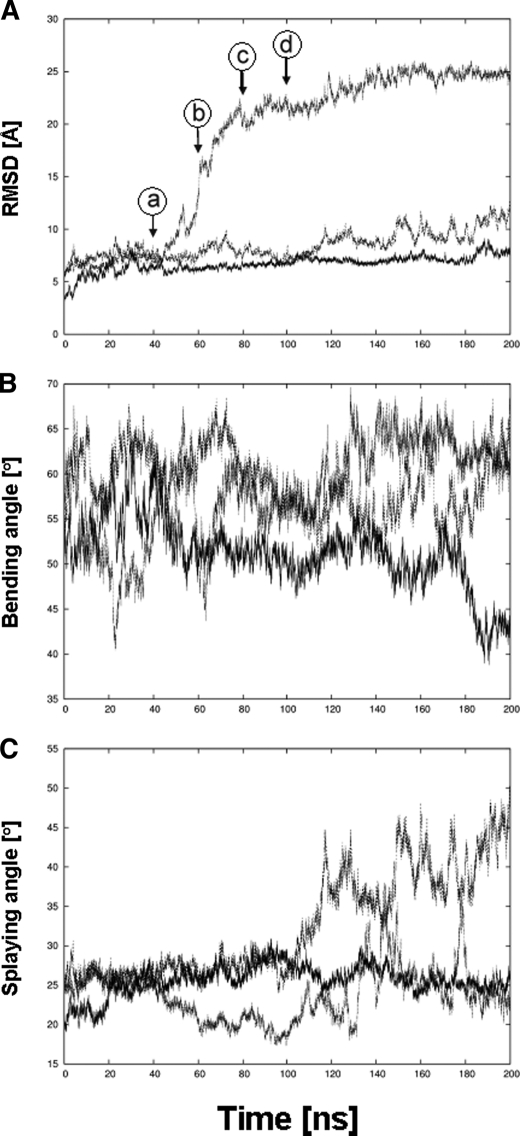
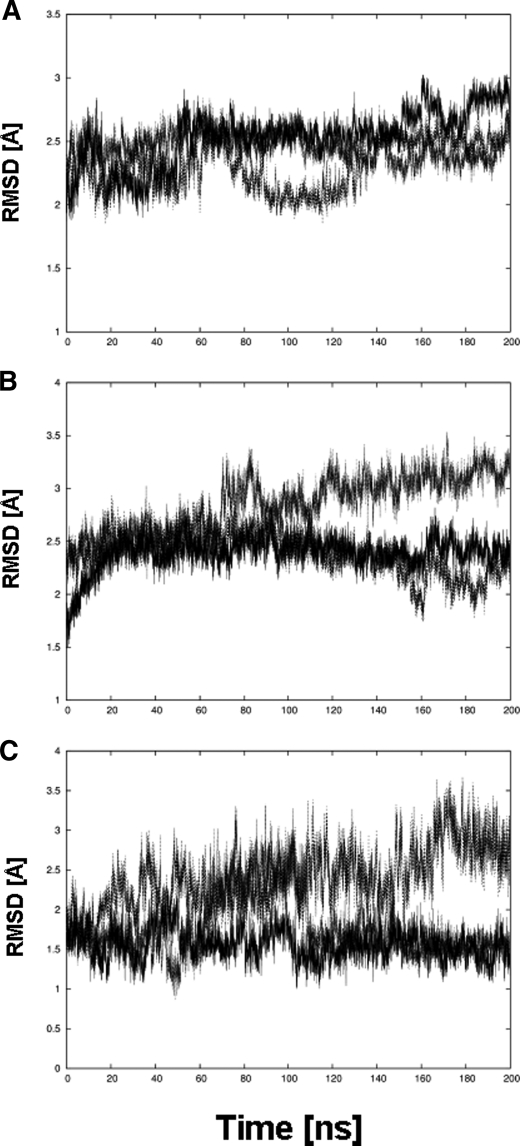
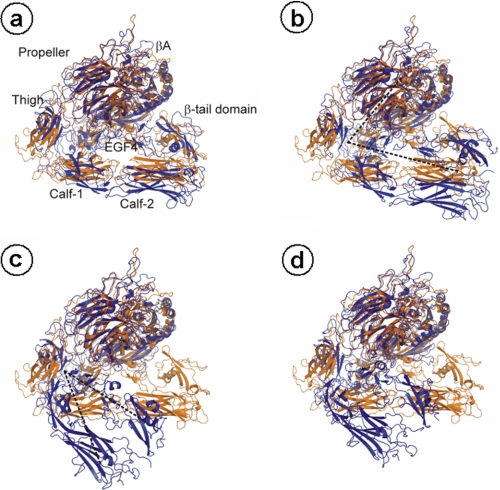
During the simulations, pronounced conformational changes of the ectodomain are observed in urea and, in particular, thiourea solutions (∼140 mm), in contrast to a simulation in water (Fig. 5). In the latter case, the Cα atom root mean square deviation, which describes the extent of structural deviation with respect to the starting structure, remains below 8 Å even after 200 ns, whereas it increases to 12 and 24 Å in the presence of urea or thiourea, respectively (Fig. 5A). These conformational changes do not arise from structural changes in the single domains of the protein, as shown exemplarily for the propeller, Calf-1, and EGF3 domains in Fig. 6; for all three different simulations, the Cα atom root mean square deviation largely remains below 3 Å during the course of the trajectory. Rather, the conformational change originates from a straightening of the genu, such that the head region of the α5β1 ectodomain, in particular that formed by the propeller and βA domains, rises from the two legs, formed by the calf-1/2 domains and the EGF repeats (Fig. 7). The straightening is mirrored by an increase of the bending angle to >60 ° after 200 ns in the case of α5β1 integrin in urea and thiourea solutions (Fig. 5B). In contrast, this angle fluctuates around 50° if only water is used as a solvent. Similarly, the splaying angle fluctuates ∼25 ° in the case of α5β1 integrin in water, whereas it shows much larger fluctuations and a shift to values as large as 45 °, particularly in the case of α5β1 integrin in urea solution (Fig. 5C).
FIGURE 5.
Unbending of the α5β1 integrin ectodomain when simulated in urea and thiourea solution. Time series of geometric parameters of the α5β1 integrin ectodomain simulated for 200 ns in water (straight line), urea solution (dashed line), and thiourea solution (dotted line) are shown. A, root mean square deviation (RMSD) of Cα atoms of α5β1 integrin with respect to the respective starting structure. Arrows indicate when conformations depicted in A–D of Fig. 7 were extracted from the trajectory of α5β1 integrin in thiourea solution. B, bending angle whose vertex is defined by the center of geometry (COG) of the plexin-semaphorin-integrin domain and whose endpoints are, on the one hand, the COG of the propeller and βA domains and, on the other hand, the COG of the calf-2 and β-tail domains. C, splaying angle whose vertex is defined by the Cα atom of G554 in the thigh domain and whose endpoints are, on the one hand, the COG of the calf-2 domain and, on the other hand, the COG of the β-tail domain. A schematic depiction of both angles is given in Fig. 7, B and C.
FIGURE 6.
Structural integrity of domains of α5β1 integrin. Time series of root mean square deviations (RMSD) of Cα atoms of α5β1 integrin domains with respect to the respective starting structure when simulated for 200 ns in water (straight line), urea solution (dashed line), and thiorurea solution (dotted line) are shown. A, propeller domain; B, calf-1 domain; C, EGF3 domain.
FIGURE 7.
Conformational change of the α5β1 integrin ectodomain that leads to unbending when simulated in thiourea solution. Conformations extracted after 40 (A), 60 (B), 80 (C), and 100 (D) ns of simulation time from the trajectory of the α5β1 integrin ectodomain in thiourea solution are depicted in blue. The structures are superimposed with respect to the propeller and βA domains onto the starting structure depicted in orange a, b, c, d (circled) correspond to a, b, c, d (circled) in Fig. 5A. In A, the α5β1 integrin domains are labeled, except the EGF1–3, plexin-semaphorin-integrin, and hybrid domains. In B and C, the black dashed lines schematically depict the bending and splaying angles, respectively.
DISCUSSION
As shown in the present study, urea at high concentrations triggers the activation of the β1 integrin system and activates downstream signaling components, such as FAK, c-Src, and mitogen-activated protein kinases, i.e. Erk1/2 and p38MAPK. Because β1-integrin was shown to act as a swelling-activated volume/osmosensor in hepatocytes (8), and urea does not induce hepatocyte swelling (5), urea apparently acts as a nonosmotic activator of this volume/osmosensor. Urea is known to interfere with protein structures (2, 3), and it is likely that unspecific interference of urea with α5β1 integrin structure promotes development of the active β1 conformation.
This view is corroborated by molecular dynamics simulations of a three-dimensional model of the ectodomain of α5β1 integrin in water as well as urea and thiourea solutions. The starting structure has a genu-flexed, bent conformation such that the head of α5β1 integrin abuts the legs, as provided by the αVβ3 template (12) used for generating the model. During the simulations, significant conformational changes are observed for α5β1 integrin in urea and thiourea solutions, in contrast to the simulation of α5β1 in water. These changes lead to an unbending of the integrin structure around the genu, whereas the structures of single domains remain essentially unchanged. According to current models such a straightening of the genu is required for activation (12), although evidence is beginning to emerge that the degree of extension is both agonist- and integrin-specific (30).
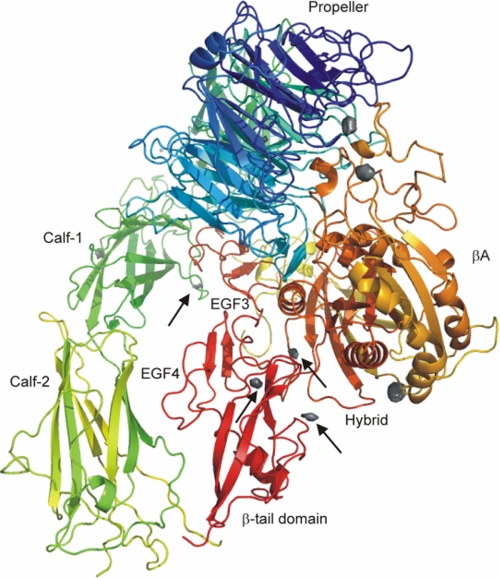
Regarding a possible mechanism, the simulations of α5β1 in thiourea and, in particular, urea solutions reveal a splaying of the leg regions of the α and β subunits, indicating weakened interactions between the legs as compared with α5β1 in water. Disruption of these interactions has been proposed to be the first step in the pathway for inside-out signaling (31), and mutations that disrupt interactions between the α and β subunits resulted in constitutively active integrins (30). Likewise, interactions between the hybrid domain and one leg must be disrupted so that the extended state can be reached. Apparently, the urea and thiourea solutions weaken those interactions, probably by decreasing hydrophobic interactions and interfering with hydrogen bonds (32), whereas they are not concentrated enough to denature single domains of α5β1 integrin. Accordingly, of 10 regions that are most frequently occupied by urea during 200 ns of simulation time, four of these regions are located in the interface between EGF3 and calf-1 domains as well as between the hybrid domain and the EGF4 or β-tail domains, respectively (Fig. 8).
FIGURE 8.
Regions most frequently occupied by urea around the α5β1 integrin ectodomain. Shown is a ribbon drawing of the α5β1 integrin ectodomain together with regions that are most frequently occupied by urea during 200 ns of simulation time (gray isocontour surfaces). Regions in the interface between the two legs or in the interface between the hybrid domain and one of the legs are marked by arrows. The α subunit of α5β1 integrin is colored in green/blue, and the β subunit is colored in yellow/red.
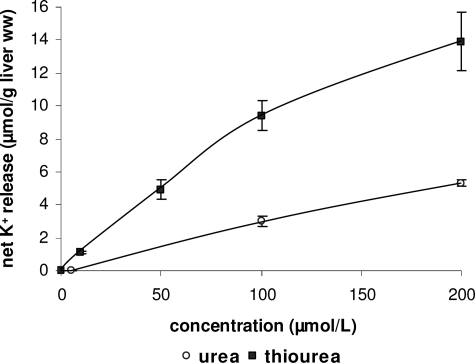
Previously, a relatively greater denaturing effectiveness of thiourea over urea has been reported (33), and this finding has been explained in that thiourea binds to a protein at molar concentrations much lower than those giving comparable binding in urea solvents (34). Similarly, for urea with alkyl substituents, a retained or increased denaturing effectiveness has been described compared with urea, although this effect is protein-specific (33). Both of these lead one to expect a more pronounced weakening of intraprotein interactions due to thiourea and dimethylurea solutions compared with urea solution in α5β1 integrin as well. In agreement with this, thiourea and dimethylurea solutions activate β1 integrin already at a 10-fold lower concentration than urea (Fig. 2), and thiourea is more potent with respect to net K+ efflux from perfused rat liver than urea (Fig. 9). Furthermore, during molecular dynamics simulations, the unbending effect of thiourea solution is much more pronounced than that of urea solution (Fig. 5B).
FIGURE 9.
Urea- and thiourea-induced K+ fluxes in perfused rat liver. Rat livers were perfused with either urea (○) or thiourea (■) at the different concentrations and net K+ release in response to (thio)urea was determined by continuously monitoring effluent K+ concentration with a K+-sensitive electrode and planimetry of areas under curves as described under “Experimental Procedures.” Data are given as means ± S.E. of the mean and represent n = 3–7 independent perfusion experiments for each condition.
In line with such an unspecific integrin activation, the GRGDSP-containing hexapeptide, which prevents hypo-osmotic and insulin-induced integrin activation (8, 10), did not affect urea-induced integrin activation. In contrast to hypo-osmotic and insulin-induced integrin activation (8, 10), urea-induced integrin activation was accompanied by activation of JNKs. This urea-induced JNK activation is therefore probably not mediated via integrin-dependent volume/osmosensing and may reflect a protein misfolding response, which is induced by urea at high concentrations.
Urea-induced integrin activation is functionally relevant, because urea triggers a p38MAPK-sensitive inhibition of proteolysis, similar to the integrin- and p38MAPK-dependent proteolysis inhibition induced by hypo-osmolarity, insulin or tauroursodeoxycholate (8–10). Likewise, the volume regulatory K+ efflux in response to hypo-osmotic hepatocyte swelling is mediated via integrin-dependent p38MAPK activation (8, 11), and the urea-induced K+ efflux with subsequent hepatocyte shrinkage is probably triggered by this signaling pathway as well. Similarly, inhibition of either c-Src using PP-2 or p38MAPK using SB203580 blunted the otherwise observed urea-induced liver mass decrease, which may reflect liver cell shrinkage (Table 1).
The role of urea-induced FAK activation for metabolic urea effects remains unclear. Insulin-and tauroursodesoxycholate-induced integrin activation is accompanied by FAK activation (8, 10), whereas hypo-osmotic integrin activation was not (9). In summary, urea activates the β1 integrin system and can affect hepatocellular metabolism through activation of integrin signaling. This is an example for an unspecific, not volume- or osmolarity-driven activation of a volume sensor that may be relevant under conditions of uremia. It is worth noting that such an activation by thiourea occurs already at concentrations of 10 mmol/liter.
Acknowledgments
We thank Elisabeth Winands and Nicole Eichhorst for excellent technical assistance. We are grateful to the Zentrum für Informations und Medientechnologie (ZIM) (Heinrich-Heine-University, Düsseldorf, Germany) for computational support.
This work was supported by the Deutsche Forschungsgemeinschaft through Sonderforschungsbereich 575 “Experimentelle Hepatologie” (Düsseldorf, Germany).
- MD
- molecular dynamics
- RVD
- regulatory volume decrease
- NVT
- constant number of particles (N), volume (V), and temperature (T).
REFERENCES
- 1.Yancey P. H., Clark M. E., Hand S. C., Bowlus R. D., Somero G. N. (1982) Science 217, 1214–1222 [DOI] [PubMed] [Google Scholar]
- 2.Singh L. R., Dar T. A., Ahmad F. (2009) J. Biosci. 34, 321–331 [DOI] [PubMed] [Google Scholar]
- 3.von Hippel P. H., Wong K. Y. (1964) Science 145, 577–580 [DOI] [PubMed] [Google Scholar]
- 4.Carbrey J. M., Gorelick-Feldman D. A., Kozono D., Praetorius J., Nielsen S., Agre P. (2003) Proc. Natl. Acad. Sci. U.S.A. 100, 2945–2950 [DOI] [PMC free article] [PubMed] [Google Scholar]
- 5.Hallbrucker C., vom Dahl S., Ritter M., Lang F., Häussinger D. (1994) Pflügers Archiv. 428, 552–560 [DOI] [PubMed] [Google Scholar]
- 6.Hallbrucker C., Ritter M., Lang F., Gerok W., Häussinger D. (1993) Eur. J. Biochem. 211, 449–458 [DOI] [PubMed] [Google Scholar]
- 7.Volpes R., van den Oord J. J., Desmet V. J. (1993) Am. J. Pathol. 142, 1483–1492 [PMC free article] [PubMed] [Google Scholar]
- 8.Häussinger D., Kurz A. K., Wettstein M., Graf D., Vom Dahl S., Schliess F. (2003) Gastroenterology 124, 1476–1487 [DOI] [PubMed] [Google Scholar]
- 9.vom Dahl S., Schliess F., Reissmann R., Görg B., Weiergräber O., Kocalkova M., Dombrowski F., Häussinger D. (2003) J. Biol. Chem. 278, 27088–27095 [DOI] [PubMed] [Google Scholar]
- 10.Schliess F., Reissmann R., Reinehr R., vom Dahl S., Häussinger D. (2004) J. Biol. Chem. 279, 21294–21301 [DOI] [PubMed] [Google Scholar]
- 11.vom Dahl S., Schliess F., Graf D., Häussinger D. (2001) Cell Physiol. Biochem. 11, 285–294 [DOI] [PubMed] [Google Scholar]
- 12.Xiong J. P., Stehle T., Goodman S. L., Arnaout M. A. (2004) J. Biol. Chem. 279, 40252–40254 [DOI] [PubMed] [Google Scholar]
- 13.Sies H. (1978) Methods Enzymol. 52, 48–59 [DOI] [PubMed] [Google Scholar]
- 14.vom Dahl S., Hallbrucker C., Lang F., Häussinger D. (1991) Biochem. J. 280, 105–109 [DOI] [PMC free article] [PubMed] [Google Scholar]
- 15.Häussinger D., Lang F., Bauers K., Gerok W. (1990) Eur. J. Biochem. 188, 689–695 [DOI] [PubMed] [Google Scholar]
- 16.Häussinger D., Hallbrucker C., vom Dahl S., Lang F., Gerok W. (1990) Biochem. J. 272, 239–242 [DOI] [PMC free article] [PubMed] [Google Scholar]
- 17.Häussinger D., Schliess F., Dombrowski F., vom Dahl S. (1999) Gastroenterology 116, 921–935 [DOI] [PubMed] [Google Scholar]
- 18.Larkin M. A., Blackshields G., Brown N. P., Chenna R., McGettigan P. A., McWilliam H., Valentin F., Wallace I. M., Wilm A., Lopez R., Thompson J. D., Gibson T. J., Higgins D. G. (2007) Bioinformatics 23, 2947–2948 [DOI] [PubMed] [Google Scholar]
- 19.Sali A., Blundell T. L. (1993) J. Mol. Biol. 234, 779–815 [DOI] [PubMed] [Google Scholar]
- 20.Case D. A., Cheatham T. E., 3rd, Darden T., Gohlke H., Luo R., Merz K. M., Jr., Onufriev A., Simmerling C., Wang B., Woods R. J. (2005) J. Comput. Chem. 26, 1668–1688 [DOI] [PMC free article] [PubMed] [Google Scholar]
- 21.Cornell W. D., Cieplak P., Bayly C. I., Gould I. R., Merz K. M., Ferguson D. M., Spellmeyer D. C., Fox T., Caldwell J. W., Kollman P. A. (1995) J. Am. Chem. Soc. 117, 5179–5197 [Google Scholar]
- 22.Simmerling C., Strockbine B., Roitberg A. E. (2002) J. Am. Chem. Soc. 124, 11258–11259 [DOI] [PubMed] [Google Scholar]
- 23.Jorgensen W. L., Chandrasekhar J., Madura J. D., Imply R. W., Klein M. L. (1983) J. Chem. Phys. 79, 926–935 [Google Scholar]
- 24.Darden T., York D., Pedersen L. (1993) J. Chem. Phys. 98, 10089–10092 [Google Scholar]
- 25.Ryckaert J. P., Ciccotti G., Berendsen H. J. C. (1977) J. Comput. Phys. 23, 327–341 [Google Scholar]
- 26.Bayly C. I., Cieplak P., Cornell W. D., Kollman P. A. (1993) J. Phys. Chem. 97, 10269–10280 [Google Scholar]
- 27.Wang J., Wolf R. M., Caldwell J. W., Kollman P. A., Case D. A. (2004) J. Comput. Chem. 25, 1157–1174 [DOI] [PubMed] [Google Scholar]
- 28.Hanke J. H., Gardner J. P., Dow R. L., Changelian P. S., Brissette W. H., Weringer E. J., Pollok B. A., Connelly P. A. (1996) J. Biol. Chem. 271, 695–701 [DOI] [PubMed] [Google Scholar]
- 29.Young P. R., McLaughlin M. M., Kumar S., Kassis S., Doyle M. L., McNulty D., Gallagher T. F., Fisher S., McDonnell P. C., Carr S. A., Huddleston M. J., Seibel G., Porter T. G., Livi G. P., Adams J. L., Lee J. C. (1997) J. Biol. Chem. 272, 12116–12121 [DOI] [PubMed] [Google Scholar]
- 30.Askari J. A., Buckley P. A., Mould A. P., Humphries M. J. (2009) J. Cell Science 122, 165–170 [DOI] [PMC free article] [PubMed] [Google Scholar]
- 31.Han J. W., Lim C. J., Watanabe N., Soriani A., Ratnikov B., Calderwood D. A., Puzon-McLaughlin W., Lafuente E. M., Boussiotis V. A., Shattil S. J., Ginsberg M. H. (2006) Curr. Biol. 16, 1796–1806 [DOI] [PubMed] [Google Scholar]
- 32.Zou Q., Habermann-Rottinghaus S. M., Murphy K. P. (1998) Proteins 31, 107–115 [PubMed] [Google Scholar]
- 33.Gordon J. A., Jencks W. P. (1963) Biochemistry 2, 47–57 [DOI] [PubMed] [Google Scholar]
- 34.Gordon J. A., Warren J. R. (1968) J. Biol. Chem. 243, 5663–5669 [PubMed] [Google Scholar]


