

Abstract
Recent studies have shown that cooperative interactions in endoplasmic reticulum (ER) membranes between Scap, cholesterol, and Insig result in switch-like control over activation of SREBP-2 transcription factors. This allows cells to rapidly adjust rates of cholesterol synthesis and uptake in response to even slight deviations from physiological set-point levels, thereby ensuring cholesterol homeostasis. In the present study we directly probe for the accessibility of cholesterol in purified ER membranes. Using a soluble cholesterol-binding bacterial toxin, perfringolysin O, we show that cholesterol accessibility increases abruptly at ∼5 mol % ER cholesterol, the same concentration at which SREBP-2 activation is halted. This switch-like change in cholesterol accessibility is observed not only in purified ER membranes but also in liposomes made from ER lipid extracts. The accessibility of cholesterol in membranes is related to its chemical activity. Complex formation between cholesterol and some ER phospholipids can result in sharp changes in cholesterol chemical activity and its accessibility to perfringolysin O or membrane sensors like Scap. The control of the availability of the cholesterol ligand to participate in cooperative Scap/cholesterol/Insig interactions further sharpens the sensitive switch that exerts precise control over cholesterol levels in cell membranes.
Keywords: Cholesterol-binding Protein, Cholesterol Regulation, Cooperativity, Membrane Bilayer, Phospholipid, Insig, Perfringolysin O, Scap, Chemical Activity, Condensed Complexes
Introduction
Cholesterol levels in mammalian cells are maintained within narrow limits by complex regulatory networks. The best understood aspect of this regulation involves a collection of proteins in the endoplasmic reticulum (ER)2 membrane that controls the activation of sterol regulatory element-binding proteins (SREBPs), transcription factors that up-regulate genes responsible for cholesterol synthesis and uptake (1–3). Activation of SREBP occurs when cellular cholesterol levels are low. Under these conditions, SREBP is transported from ER to Golgi where proteolytic cleavage releases the active transcription factor domain, which then travels to the nucleus to turn on target genes and ultimately results in raising cholesterol levels. A tetrameric membrane protein, Scap, that binds to SREBPs and functions as an ER cholesterol sensor is essential in mediating ER-Golgi transport of SREBP. As levels of cholesterol rise, Scap senses this increase through direct binding interactions with cholesterol. The cholesterol-bound form of Scap forms complexes with ER-resident membrane proteins called Insigs. Binding to Insigs prevents transport of Scap·SREBP from ER to Golgi, and subsequent proteolytic activation of SREBP is halted. As a result, transcription of target genes declines, and cholesterol levels eventually fall.
This classic feedback loop is sensitive both to the level of cholesterol and the ratio of Scap:Insig in the ER. A recent study, using highly purified ER membranes, showed that the feedback response is switch-like, resulting in almost complete inactivation or activation of SREBP when the cholesterol concentration in ER membranes increases or decreases by as little as 2 mol % from the physiological set-point of ∼5 mol % (4). This switch-like response was proposed to arise because of cholesterol-mediated cooperative interactions between Scap and Insig.
Here we address the possibility that the chemical activity of cholesterol, as determined by its interaction with membrane phospholipids, may also contribute to this sharp response. It is plausible that the interaction of membrane cholesterol with membrane protein sensors or with soluble acceptors is related to its chemical activity. Sharp changes in the chemical activity of cholesterol would then be expected to lead to sharp changes in its interaction with receptors. In one example of this behavior, rates of cholesterol desorption from model membranes to a soluble acceptor like methyl-β-cyclodextrin showed a step-like dependence on membrane cholesterol concentration (5). In another example, the interaction of perfringolysin O (PFO), a soluble cholesterol-dependent pore-forming toxin, with membranes also showed a step-like dependence on cholesterol concentration (6). This latter example particularly interested us because the binding of PFO to cholesterol in target membranes triggers a cascade of structural changes leading initially to large scale PFO oligomerization (30–50 monomers/oligomer) and culminating in the formation of pores that are 150–250 Å in diameter (6–9). These structural changes can be conveniently assayed by monitoring the intrinsic tryptophan fluorescence (6, 10) or electrophoretic mobility of PFO (11).
In this study, we measured the binding of PFO to purified ER membranes from cells subjected to various manipulations of cholesterol levels. We show that PFO binding to ER membranes undergoes a step-like increase when ER cholesterol rises above the physiological set-point concentration of ∼5 mol %, the same concentration at which activation of SREBP is abruptly halted. The sharp change in accessibility of cholesterol to PFO at the ER membrane surface, and possibly to a cholesterol sensor like Scap, is proposed to arise because of cooperative interactions between cholesterol and phospholipids. Such acute control of accessibility of the cholesterol ligand may enhance the cooperativity of Scap·cholesterol·Insig complex formation, further sharpening the switch-like response that controls cholesterol composition of cell membranes.
EXPERIMENTAL PROCEDURES
Materials
We obtained 1,2-dioleoyl-sn-glycero-3-phosphocholine (DOPC), 1-palmitoyl-2-oleoyl-sn-glycero-3-phosphocholine (POPC), and 1,2-diphytanoyl-sn-glycero-3-phosphocholine (DPhyPC) from Avanti Polar Lipids; hydroxypropyl β-cyclodextrin (HPCD) and randomly methylated β-cyclodextrin (MCD) from Cyclodextrin Technologies; FBS from PAA Laboratories, Inc.; monoclonal anti-polyhistidine-peroxidase antibody, cholesterol, 25-hydroxycholesterol, lanosterol, β-sitosterol, human plasma LDL, newborn calf lipoprotein-deficient serum, and Optiprep density gradient medium (iodixanol) from Sigma-Aldrich; and epicholesterol, desmosterol, dihydrocholesterol, and 19-hydoxycholesterol from Steraloids. Monoclonal antibodies IgG-7D4 and IgG-9D5 against hamster SREBP-2 and hamster Scap, respectively, were generous gifts from M. Brown and J. Goldstein (University of Texas Southwestern Medical Center, Dallas, TX). Solutions of sodium compactin and sodium mevalonate were prepared as described (12). Stock solutions of complexes of cholesterol·MCD were prepared at a final sterol concentration of 2.5 mm and a cholesterol:MCD ratio of 1:10 as described (13).
Buffers and Media
Buffer A contains 50 mm Tris-HCl (pH 7.5) and 150 mm NaCl. Buffer B is Buffer A supplemented with a protease inhibitor mixture (50 μg/ml leupeptin, 25 μg/ml pepstatin A, 10 μg/ml aprotinin, 25 μg/ml PMSF). Medium A is a 1:1 mixture of Ham's F-12 medium and Dulbecco's modified Eagle's medium (Mediatech, Inc.) containing 100 units/ml penicillin and 100 μg/ml streptomycin sulfate. Medium B is Medium A supplemented with 10% (v/v) FBS. Medium C is Medium A supplemented with 5% (v/v) newborn calf lipoprotein-deficient serum, 50 μm sodium compactin, and 50 μm sodium mevalonate.
Preparation of Liposomes
All of the lipids were used without further purification. Mixtures containing the indicated proportions of phospholipids and sterols from stock solutions in chloroform or extracted lipids from purified ER membranes were evaporated to dryness and stored under vacuum overnight. The dried lipid mixtures were hydrated by adding 500 μl of buffer A (final lipid concentration, 800 μm) and agitated on a vortexer for 2 h at room temperature. The lipid dispersions were then placed in a bath sonicator at 37 °C and subjected to sonication for 15 min followed by a 15-min pause for cooling (three cycles). The resulting liposomes were stored at room temperature and used within 6 h.
Overexpression and Purification of His6-PFO(C459A)
The gene encoding PFO from Clostridium perfringens was modified to replace the only cysteine with alanine (C459A) and include an NH2-terminal hexahistidine tag (8). This construct was subsequently cloned into the pRSETB expression vector (Invitrogen) and kindly provided to us by A. Johnson (Texas A & M University, College Station, TX). This version of PFO is designated as His6-PFO(C459A). After transformation into BL21-CodonPlus(DE3)-RIPL Escherichia coli competent cells (Stratagene), protein overexpression was carried out according to the manufacturer's instructions and as described (8). The hexahistidine tag and single amino acid substitution (C459A) did not significantly affect the hemolytic activity of PFO (8, 14). A cell pellet from a 3-liter bacterial culture was resuspended in 75 ml of buffer B containing 0.2% (w/v) lauryl-dimethyl-amino oxide detergent (Anatrace) and 1 mg/ml lysozyme and incubated for 1 h at room temperature. The disrupted cells were homogenized using a Dounce apparatus and subjected to 100,000 × g centrifugation for 45 min, and the resulting supernatant was loaded on a 5-ml column packed with nickel-Sepharose 6 beads (GE Healthcare). The column was washed with 50 ml of buffer A containing 50 mm imidazole, and bound proteins were eluted with buffer A containing 300 mm imidazole. The eluted fractions were pooled and concentrated using an Amicon Ultra 30-kDa cutoff centrifugal filter (Millipore) and further purified by gel filtration chromatography on a Tricorn 10/300 Superose 6 column (GE Healthcare). Protein-rich fractions were pooled, concentrated to 2–6 mg/ml, and stored at 4 °C until use. Protein concentrations were measured using a bicinchoninic acid kit (Pierce).
Assays for Interaction of His6-PFO(C459A) with Liposomes
Reaction mixtures (200 μl) containing 800 μm liposomes (total lipid) and 4 μm His6-PFO(C459A) in buffer A were set up in 96-well plates (Corning Inc.). After incubation for 1 h at 37 °C, tryptophan fluorescence was measured using a Safire2 microplate reader (Tecan Group Ltd.) (excitation wavelength, 290 nm; emission wavelength, 340 nm; band pass, 5 nm for each). Interaction of His6-PFO(C459A) with liposomes was also assayed directly by isolating liposomes by floatation using a sucrose gradient. An aliquot of the reaction mixture (100 μl) was mixed with 900 μl of buffer A containing 50% sucrose (w/v) and loaded at the bottom of a discontinuous sucrose gradient formed by underlaying, in succession, 1-ml layers of buffer A containing 7.5, 30, and 40% sucrose (w/v). After centrifugation for 1 h at 100,000 × g, the gradient was drained from the bottom of the centrifuge tube into two halves (∼2 ml each). The low density and high density gradient fractions were designated “top” and “bottom” fractions, respectively. A portion of each fraction (5 μl) was mixed with SDS loading buffer and subjected to immunoblot analysis as described below. In some assays, an aliquot (0.5% of total) of the reaction mixture was directly mixed with SDS loading buffer (without fractionation on a sucrose density gradient) and subjected to immunoblot analysis as described below.
Cell Culture and Fractionation
CHO-K1 cells were maintained in monolayer culture at 37 °C in 5% CO2. On day 0, the cells were set up in Medium B at 700,000 cells/10-cm dish (VWR International). On day 3, the cells were subjected to the indicated treatments, washed with phosphate-buffered saline, and harvested. The harvested cells were disrupted by 13 passes through a ball-bearing homogenizer with a 10-μm clearance (Isobiotec). A fraction of the homogenate (∼5% of total) was saved for analysis of SREBP-2 processing, and the remainder was used as a source to purify ER membranes as described previously (4).
Lipid Extraction and Analysis
Lipids were extracted from membranes or liposomes and analyzed as described previously (4). Free unesterified cholesterol levels were measured using gas chromatography/mass spectrometry where known amounts of β-sitosterol or desmosterol were added to samples prior to extraction as standards for quantification (15). Total phospholipid levels were measured by a colorimetric assay that measured inorganic phosphate after acidic digestion (16). The content of cholesterol (or other sterols) in ER membranes or liposomes is expressed as a percentage of total lipids on a molar basis. The moles of total lipids are determined using the known molecular masses of cholesterol and other sterols and an estimate of 800 Da for the mean molecular mass of phospholipids.
Immunoblot Analysis
For analysis of SREBP-2 processing, samples containing equal protein amounts were mixed with 5× SDS loading buffer, heated for 10 min at 95 °C, and subjected to 8% SDS-PAGE. For analysis of PFO-membrane interactions, the samples were prepared as described above, heated for 10 min at 37 °C, and subjected to 4% SDS-PAGE. For detection of Scap and SREBP-2 in ER membrane fractions, samples containing equal protein amounts were mixed with 5× SDS loading buffer, heated for 10 min at 37 °C, and subjected to 8% SDS-PAGE. After SDS-PAGE, the proteins were transferred to Trans-Blot nitrocellulose filters (Bio-Rad) and incubated for 1 h at room temperature with anti-SREBP-2 IgG 7D4 (1.6 μg/ml), anti-Scap IgG 9D5 (1.3 μg/ml), or anti-polyhistidine (8.2 μg/ml) to probe for His6-PFO(C459A), as indicated. The filters used to probe for SREBP-2 and Scap were further incubated for 30 min with a 1:5000 dilution of horseradish peroxidase-conjugated, affinity-purified donkey anti-mouse IgG (Jackson ImmunoResearch Laboratories). Bound antibodies were visualized by chemiluminescence (Immun-Star kit; Bio-Rad). Filters were exposed to F-BX810 x-ray film (Phenix Research) at room temperature for 1–60 s. Densitometry analysis was carried out using ImageJ software (NIH, version 1.43r).
Calculation of Cholesterol Chemical Activities
We consider a binary liquid mixture of cholesterol (C) and phospholipid (P) where a complex forms according to the reaction,
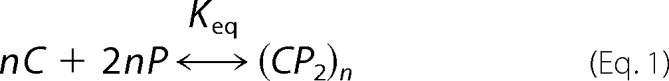 |
where Keq is the equilibrium constant, and n refers to the cooperativity of the reaction. No other interactions are considered. The 1:2 cholesterol:phospholipid stoichiometry is chosen for illustrative purposes. The free energy, G, of this liquid mixture according to a regular solution model has been described elsewhere (17). The chemical activity of cholesterol, ac, is defined as,
where kB is Boltzmann's constant, T is room temperature, and μc is the chemical potential of cholesterol defined as dG/dNC. The calculations are carried out as described in earlier work (17, 18).
RESULTS
Interaction of Purified His6-PFO(C459A) with Liposomes Containing Cholesterol
His6-PFO(C459A) was overexpressed in bacteria, and the resulting recombinant protein was purified to homogeneity using nickel chromatography followed by gel filtration chromatography (see “Experimental Procedures”). Fig. 1A shows the migration of purified His6-PFO(C459A) on SDS-PAGE, as visualized by Coomassie Blue staining (lane 2). Gel filtration studies of purified His6-PFO(C459A), which has a calculated molecular mass of 56 kDa, show that the protein elutes as an ∼140-kDa species (Fig. 1B), consistent with it being a dimer in solution at concentrations of 2–6 mg/ml (19).
FIGURE 1.

Interaction of purified His6-PFO(C459A) with liposomes containing cholesterol. A, Coomassie staining. Recombinant His6-PFO(C459A) was purified in two steps as described under “Experimental Procedures.” An aliquot (5 μg) was subjected to 8% SDS-PAGE, and proteins were visualized with Coomassie Brilliant Blue R-250 stain (lane 2). The molecular masses of protein standards are indicated (lane 1). B, gel filtration chromatography. Buffer A (0.5 ml) containing 100 μg of His6-PFO(C459A) was loaded onto a Superose 6 column and chromatographed at a flow rate of 0.5 ml/min. Absorbance at 280 nm was monitored continuously to identify the purified protein. Standard molecular mass markers (thyroglobulin, 670 kDa; γ-globulin, 158 kDa; ovalbumin, 44 kDa; myoglobin, 17 kDa; and vitamin B12, 1.35 kDa) were chromatographed on the same column (arrows) under the same conditions. The apparent molecular mass of His6-PFO(C459A) is ∼140 kDa. C, tryptophan fluorescence. Each reaction mixture contained 4 μm PFO and 800 μm liposomes composed of DOPC and the indicated amounts of cholesterol. After incubation for 1 h at 37 °C, tryptophan fluorescence from the samples was measured (excitation wavelength, 290 nm; emission wavelength, 340 nm). F0 is defined as the fluorescence from mixtures of His6-PFO(C459A) and liposomes containing 0% cholesterol. Each value is the average of triplicate assays. D, density gradient analysis. An aliquot (50% of total) of the reaction mixtures from C was loaded on the bottom of a discontinuous sucrose gradient as described under “Experimental Procedures.” After centrifugation at 100,000 × g for 1 h, the gradient was drained from the bottom into two fractions. Immunoblot analysis of His6-PFO(C459A) in low density (Top) and high density (Bottom) sucrose gradient fractions was carried out as described under “Experimental Procedures.” M, membrane-bound oligomeric form of PFO; F, free form of PFO. E, lipid analysis. Lipids were extracted from top and bottom fractions from each gradient in D, and the amounts of cholesterol and phospholipids were quantified as described under “Experimental Procedures.”
PFO is a soluble bacterial cytolysin that binds to cholesterol-containing membranes once the cholesterol level exceeds a threshold concentration (6, 8). PFO-membrane interaction is initiated by a β-sheet-rich domain (residues 391–500) that contains six tryptophan residues (of seven total in the whole protein) (6, 10). When this domain binds to and inserts into the nonpolar bilayer core, the intrinsic tryptophan fluorescence of PFO increases by 2–3-fold, providing a convenient assay to measure PFO-membrane interactions. Using tryptophan fluorescence, we monitored the interaction of purified His6-PFO(C459A) with liposomes made of binary mixtures of DOPC and cholesterol. Fig. 1C shows a step-like increase in emission intensity, indicative of His6-PFO(C459A) insertion into the bilayer, when the cholesterol concentration in DOPC liposomes exceeds 35 mol %. We hereafter use the term “switch-point” to refer to the cholesterol concentration corresponding to the midpoint of the switch-like increase in Trp emission intensity. To ensure that this result was not due to reaction kinetics, we extended the time of His6-PFO(C459A)-liposome incubations from 1 h (as in Fig. 1C) to 24 h and observed the same step-like response at the same switch-point cholesterol concentration (data not shown). Moreover, we found that this increase in Trp emission intensity persisted even after cholesterol was subsequently removed from liposome membranes by the addition of 8 mm MCD for 4 h (data not shown). This suggested that the oligomerization of His6-PFO(C459A) after its initial interaction with DOPC liposomes containing >35 mol % cholesterol may be irreversible. The stability of this interaction led us to design an assay to capture the liposome-bound form of His6-PFO(C459A). Aliquots of protein-liposome reaction mixtures, the Trp emission intensities for which are shown in Fig. 1C, were subjected to density gradient centrifugation as described under “Experimental Procedures.” The localization of His6-PFO(C459A) in the sucrose density gradient switches abruptly from the dense fractions (Fig. 1D, bottom panel) to the light fractions containing liposomes (Fig. 1D, top panel) when the cholesterol concentration exceeds 35 mol % (compare lanes 1–6 to lanes 7–11 in Fig. 1D). At the switch-point of 35 mol % cholesterol (lane 6), His6-PFO(C459A) was found in both dense and light fractions. The liposome-bound form of His6-PFO(C459A) (top panel, lanes 6–11) was found to migrate much more slowly than the free protein (bottom panel, lanes 1–6) even under denaturing conditions of SDS-PAGE, consistent with earlier work (11). This difference in electrophoretic mobility, likely reflecting PFO oligomerization upon binding to membranes, simplifies the assay because separation of the two forms of His6-PFO(C459A) by density gradient centrifugation is no longer required (see later).
Lipid analysis of each fraction (Fig. 1E) confirmed that only the light top fractions contained liposomes. The analysis also confirmed that the cholesterol concentration of the top fractions faithfully mimicked the starting compositions used in the liposome preparation process (<10% variation). Spot checks were carried out on a subset of all subsequent liposome preparations to ensure that the actual sterol concentration was within 10% of the expected values.
Specificity of His6-PFO(C459A) Interaction with Liposomes
Using the electrophoretic mobility and tryptophan fluorescence of His6-PFO(C459A) as two convenient assays to monitor its interaction with liposomal membranes, we next focused on studying the switch-point cholesterol concentration in more detail. There have been several earlier studies addressing the dependence of PFO-membrane interaction on phospholipid and sterol structures (8, 20). Here we amplify these earlier studies and focus on providing a framework to address ER cholesterol sensors that control SREBP activation.
We first tested the dependence of the switch-point on the bulk phospholipid of the liposomes using the tryptophan fluorescence assay. We chose three phospholipids with the same phosphocholine headgroup but widely varying acyl chain structures (Fig. 2A). The bulk melting temperature, Tm, of pure phospholipid bilayers in water is a convenient measure of the tendency of phospholipid acyl chains to adopt an ordered conformation. Unsaturated (DOPC) or branched (DPhyPC) acyl chains lower the ordering tendency and thus the Tm of the respective phospholipid. Fig. 2B shows that the switch-point for His6-PFO(C459A) binding to liposomes shifts to lower cholesterol concentrations as the phospholipid Tm is lowered (45 mol % for POPC, 35 mol % for DOPC, and 25 mol % for DPhyPC). We then prepared ternary liposomes containing fixed amounts of cholesterol but varying ratios of POPC and DPhyPC and tested for binding of His6-PFO(C459A). For liposomes containing 20 mol % cholesterol, which lies below the switch-points of both POPC and DPhyPC, no binding of His6-PFO(C459A) was observed for any combination of the two phospholipids (Fig. 2C, first panel). At cholesterol concentrations of 30 and 40 mol %, which lie above the switch-point of DPhyPC but below that of POPC, binding of His6-PFO(C459A) was observed when the phospholipid fraction was DPhyPC-rich and was eliminated as the concentration of POPC rose to exceed that of cholesterol (Fig. 2C, second and third panels). Finally, when the concentration of cholesterol in liposomes was 50 mol %, above the switch-points of both DPhyPC and POPC, binding of His6-PFO(C459A) was observed for all combinations of the two phospholipids (Fig. 2C, fourth panel). These studies show that cholesterol is less accessible to His6-PFO(C459A) when the phospholipid acyl chains are more ordered (high Tm), leading to a shift in the switch-point to higher cholesterol concentrations. Other studies have shown that the switch-point cholesterol composition is also dependent on phospholipid headgroup type (20).
FIGURE 2.

Interaction of His6-PFO(C459A) with liposomes containing cholesterol and various phospholipids. A, chemical structures of phospholipids. The gray ovals labeled PC represent the phosphocholine moiety. The melting temperature (Tm) of each phospholipid is indicated. B and C, tryptophan fluorescence. Each reaction contained 4 μm His6-PFO(C459A) and 800 μm liposomes composed of binary mixtures of cholesterol and indicated phospholipids (B) or ternary mixtures of cholesterol, POPC, and DPhyPC (C). After incubation for 1 h at 37 °C, tryptophan fluorescence from the samples was measured (excitation wavelength, 290 nm; emission wavelength, 340 nm). F0 is defined as the fluorescence from mixtures of His6-PFO(C459A) and liposomes containing only the indicated phospholipids or mixtures of phospholipids (0% cholesterol). Each value is the average of triplicate assays.
We next sought to test whether His6-PFO(C459A) had specificity for structural features of cholesterol. We used DOPC as the bulk phospholipid and prepared liposomes containing increasing amounts of various sterols (Fig. 3A). Fig. 3B shows that His6-PFO(C459A) bound to DOPC liposomes containing >30 mol % cholesterol. A 2–3-fold increase in Trp fluorescence was observed at this switch-point concentration. Binding to liposomes was not affected when dihydrocholesterol, where the 5,6 double bond in the B-ring is reduced, was substituted for cholesterol. Binding was also insensitive to modification of the iso-octyl side chain by introducing unsaturation (desmosterol) or ethyl groups (β-sitosterol). Remarkably, His6-PFO(C459A) showed no binding to liposomes containing epicholesterol, a diastereomer of cholesterol differing only in the orientation of its 3-hydroxyl group. His6-PFO(C459A) also did not bind to liposomes containing 19-hydroxycholesterol or 25-hydroxycholesterol (which have additional hydroxyl groups on the steroid nucleus or iso-octyl side chain, respectively) or to those containing lanosterol, a biosynthetic precursor of cholesterol that has several structural differences. A previous study addressed the interaction of streptolysin O, another cholesterol-dependent cytolysin with similar sterol specificity as PFO, with an enantiomeric form of cholesterol (a mirror image where all eight chiral centers are in opposite configurations). Interestingly, this study showed that, relative to cholesterol, the enantiomeric form of cholesterol was partially active in inducing binding of streptolysin O to liposomes (21). Further structural studies will precisely define details of toxin-sterol interactions.
FIGURE 3.

Sterol specificity of His6-PFO(C459A). A, chemical structures of sterols. Differences from cholesterol are highlighted in red. B, tryptophan fluorescence. Each reaction mixture contained 4 μm His6-PFO(C459A) and 800 μm liposomes composed of DOPC and various amounts of the indicated sterols. After incubation for 1 h at 37 °C, tryptophan fluorescence from the samples was measured (excitation wavelength, 290 nm; emission wavelength, 340 nm). F0 is defined as the fluorescence from mixtures of His6-PFO(C459A) and liposomes containing 0% sterol. Each value is the average of triplicate assays. C, immunoblot analysis. An aliquot (0.5% of total) of the reaction mixtures from B, corresponding to the indicated sterol, was subjected to 4% SDS-PAGE, and immunoblot analysis for PFO was carried out as described under “Experimental Procedures.” M, membrane-bound oligomeric form of PFO; F, free form of PFO. D, densitometric quantification of PFO immunoblots. The percentage of membrane-bound oligomeric form of PFO relative to the total (membrane-bound plus free) is shown. Quantification results are shown for all eight sterols in A, including cholesterol, desmosterol, epicholesterol (immunoblots shown in C), and dihydrocholesterol, β-sitosterol, 19-hydroxycholesterol, 25-hydroxycholesterol, and lanosterol (immunoblots not shown). E, lipid analysis. An aliquot (50% of total) of the reaction mixtures from B, corresponding to the indicated sterol, was loaded on the bottom of a discontinuous sucrose gradient as described under “Experimental Procedures.” After centrifugation at 100,000 × g for 1 h, the gradient was drained from the bottom into two fractions. Lipids were extracted from the low density, liposome-containing fractions from each gradient (see Fig. 1), and the amounts of sterols and phospholipids were quantified as described under “Experimental Procedures.”
We also assayed for His6-PFO(C459A) binding to liposomes containing various sterols by monitoring its electrophoretic mobility during 4% SDS-PAGE. His6-PFO(C459A) showed a shift to a slower migrating liposome-bound form when incubated with liposomes containing >30 mol % cholesterol (Fig. 3C, lanes 1–6) or desmosterol (Fig. 3C, lanes 7–12). Similar behavior was observed with liposomes containing dihydrocholesterol and β-sitosterol (immunoblots not shown). No binding was observed to liposomes containing epicholesterol (Fig. 3C, lanes 13–18). His6-PFO(C459A) also did not bind to liposomes containing 19-hydroxycholesterol, 25-hydroxycholesterol, or lanosterol (immunoblots not shown). Fig. 3D shows densitometric quantification of immunoblot results showing the percentage of His6-PFO(C459A) bound to liposomes relative to total (bound plus free) for all eight sterols. Both assays (Trp fluorescence and electrophoretic mobility) show the same specificity of His6-PFO(C459A) for sterols in membranes.
We next sought to ensure that the various sterols, especially those which were negative in His6-PFO(C459A) binding assays (Fig. 3A, structures e–h), were faithfully incorporated into liposomes. Fig. 3E shows lipid analysis carried out on sterol-containing liposomes isolated by sucrose density gradient fractionation as described earlier. The analysis confirmed that sterol concentration in liposome fractions was within 11 mol % of the expected values in all cases where no binding to His6-PFO(C459A) was observed. Similar lipid analysis carried out on liposomes containing sterols that were positive in His6-PFO(C459A) binding assays (Fig. 3A, structures a–d) showed that the actual sterol concentrations in these cases was within 7 mol % of the expected values (data not shown). It should be noted that the orientation of oxysterols such as 19-hydroxycholesterol and 25-hydroxycholesterol within the bilayer could be significantly different from that of cholesterol, further affecting their accessibility to His6-PFO(C459A).
Interaction of His6-PFO(C459A) with Purified ER Membranes from CHO-K1 Cells
We observed that the sterol specificity of His6-PFO(C459A) (shown in Fig. 3) was identical to that of Scap, an ER membrane protein that binds to cholesterol and controls SREBP-2 activation (22). Furthermore, a recent study showed that SREBP-2 activation showed a switch-like dependence on ER cholesterol concentration (4), much like the switch-point responses seen so far in this study. These similarities led us to hypothesize that the binding of soluble His6-PFO(C459A) to cholesterol in model membranes may share common mechanisms with the binding of membrane-bound Scap to cholesterol in ER membranes. We sought to test whether the accessibility of cholesterol in ER membranes that were purified using a recently described procedure (4) showed a switch-like response with respect to binding of His6-PFO(C459A). Although the concentration of cholesterol in ER membranes, which ranges from 2 to 10 mol % (4), is much lower than the switch-point concentrations found in model liposomes using His6-PFO(C459A), we were encouraged by an earlier study where PFO bound to partially purified ER microsomes (23).
Fig. 4A shows that increasing ER cholesterol by incubating cells with 50 μm cholesterol (in MCD) for various lengths of time blocks the conversion of SREBP-2 from its inactive precursor form to its active cleaved nuclear form (lanes 1–4) and that decreasing ER cholesterol by incubating cells with 1% HPCD for various lengths of time triggers the conversion of SREBP-2 to its active form (lanes 5–8). We then purified ER membranes from the treated cells as described under “Experimental Procedures.” As described in earlier studies (4), ER membrane purity was verified using immunoblot analysis for organelle markers and organelle-specific enzyme assays (data not shown). Lipid analysis of purified ER membranes showed that a decrease in SREBP-2 processing (Fig. 4A, lanes 1–4) occurred when ER cholesterol increased from ∼2 to ∼7 mol % (Fig. 4B, left panel), and that an increase in SREBP-2 processing (Fig. 4A, lanes 5–8) occurred when ER cholesterol decreased from ∼7 to ∼2 mol % (Fig. 4B, right panel). We next measured the binding of His6-PFO(C459A) to these purified ER membranes using the electrophoretic mobility assay and found that binding occurs only when cholesterol concentration is in excess of ∼5 mol % (Fig. 4C, lanes 1–8). This concentration dependence of His6-PFO(C459A) binding correlates remarkably well with suppression of SREBP-2 processing (compare lanes 1–8 in Fig. 4, A and C).
FIGURE 4.

Correlation between SREBP-2 activation in CHO-K1 cells and binding of His6-PFO(C459A) to purified ER membranes. A, on day 0, CHO-K1 cells were set up in medium B (10% FBS), as described under “Experimental Procedures.” On day 3, the cells were washed with PBS and either treated with Medium C (lipoprotein-deficient serum) containing 1% HPCD for 1 h and then switched to Medium C containing 50 μm cholesterol (Chol) complexed to MCD (lanes 1–4) or treated with Medium C containing 1% HPCD (lanes 5–8). At the indicated times, the cells were harvested (∼2 × 10⁸/condition from twenty 10-cm dishes) and disrupted by a ball-bearing homogenizer. A portion of the homogenate (∼5% of total) was saved for immunoblot analysis of SREBP-2 (45 μg/lane) (P = precursor form of SREBP-2; N = cleaved nuclear form of SREBP-2). B, the remainder (95%) of the homogenized cells was used to purify ER membranes. Lipids were extracted from an aliquot (150–200 μg) of purified ER membranes, and the amounts of cholesterol and phospholipids were quantified as described under “Experimental Procedures.” C, reaction mixtures (200 μl total) containing 5 μg of purified His6-PFO(C459A) and 65 μg of purified ER membranes from cells subjected to the indicated treatment, all in buffer A, were incubated for 1 h at 37 °C. An aliquot (0.5% of total) of each reaction mixture was subjected to 4% SDS-PAGE, and immunoblot analysis for His6-PFO(C459A) was carried out as described under “Experimental Procedures.” M, membrane-bound oligomeric form of PFO; F, free form of PFO. D, densitometric quantification of A and C and immunoblots from four other similar experiments showing the percentages of SREBP-2 in the activated, nuclear form relative to the total (nuclear plus precursor) (●) and the percentage of PFO in membrane-bound oligomeric form relative to the total (membrane-bound plus free) (○) as a function of ER cholesterol concentration. The blue shaded region indicates a narrow concentration range where a switch-like response occurs (5–7 mol %). E, correlation plot of the data in D showing the relationship between SREBP-2 activation and binding of PFO to purified ER membranes. The dashed line represents perfect correlation (best fit to data: R2 = 0.98).
To further establish this correlation, we conducted additional experiments where cells were first depleted of cholesterol using 1% HPCD for 1 h and then treated either with various concentrations of cholesterol·MCD (three experiments) or 10 μg/ml LDL (one experiment) for various lengths of time. Analysis of SREBP-2 activation, His6-PFO(C459A) binding to purified ER membranes, and cholesterol concentrations in purified ER membranes was carried out for these four experiments as described for Fig. 4 (A–C). Fig. 4D shows a graph of the combined data from densitometry analysis of immunoblots where the percentages of SREBP-2 in the activated nuclear form (●) and of His6-PFO(C459A) bound to purified ER membranes (○) are plotted as a function of ER cholesterol concentration. This analysis revealed a threshold effect for both SREBP-2 activation and His6-PFO(C459A) binding. When ER cholesterol was less than 5 mol %, more than 80% of SREBP-2 was in the activated form, and His6-PFO(C459A) binding to ER was minimal. As the ER cholesterol rose, there was an abrupt switch over a narrow concentration range (5–7 mol %, blue shaded region in Fig. 4D) in both SREBP-2 activation and His6-PFO(C459A) binding (switch-point at ∼6 mol % cholesterol). This common threshold cholesterol concentration is close to the 5 mol % value reported earlier for SREBP-2 activation (4). Fig. 4E replots the data in Fig. 4D, showing the percentage of SREBP-2 in the activated nuclear form versus that of His6-PFO(C459A) bound to the respective purified ER membranes and shows strong negative correlation (R2 = 0.98).
Interaction of His6-PFO(C459A) with ER Liposomes Prepared from Lipid Extract of Purified ER Membranes
The switch-point observed with binding of His6-PFO(C459A) to purified ER membranes (Fig. 4D) was as sharp as that observed with much simpler binary mixtures of cholesterol and phospholipids (Figs. 1–3). We designed a series of experiments to test whether the ER membrane protein population played a role in setting the cholesterol concentration and sharpness of the switch-point. Similar to previous experiments, we depleted cells of cholesterol by incubation with 1% HPCD for 1 h and then increased cholesterol levels by incubation with 50 μm cholesterol·MCD for various lengths of time. Immunoblots of the whole cell lysates showed a complete block of the activation of SREBP-2 (Fig. 5A, lanes 1–4) as ER cholesterol rose from ∼3 to ∼7 mol % (Fig. 5C, left panel). Lipids were then extracted from purified ER membranes and used to prepare “ER liposomes” as described under “Experimental Procedures.” As shown in Fig. 5B, ER liposomes were devoid of the many proteins present in purified ER membranes (top panel, compare lanes 5–8 to lanes 1–4), including at least one cholesterol-binding protein, Scap (middle panel), and the ER-bound precursor form of SREBP-2 (bottom panel). Fig. 5C shows that cholesterol concentrations in ER liposomes (right panel) are similar to those in purified ER membranes (left panel). Based on these measurements, we conclude that ER liposomes represent the lipid component of purified ER membranes without any detectable proteins. Any pre-existing composition differences between the two leaflets of purified ER membranes would be expected to be lost during liposome preparation because this process generates symmetric bilayers.
FIGURE 5.

Correlation between SREBP-2 activation in CHO-K1 cells and binding of His6-PFO(C459A) to liposomes made from purified ER membrane lipids. A, on day 0, CHO-K1 cells were set up as described under “Experimental Procedures” in Medium B (10% FBS). On day 3, the cells were washed with PBS and treated with Medium C (lipoprotein-deficient serum) containing 1% HPCD for 1 h and then switched to Medium C containing 50 μm cholesterol (Chol) complexed to MCD. At the indicated times, the cells were harvested (∼4 × 10⁸/condition from forty 10-cm dishes) and disrupted by a ball-bearing homogenizer. A portion of the homogenate (∼5% of total) was saved for immunoblot analysis of SREBP-2 (60 μg/lane) (P = precursor form of SREBP-2; N = cleaved nuclear form of SREBP-2). B and C, the remainder (95%) of the homogenized cells was used to purify ER membranes, an aliquot of which (20% of total) was saved for protein and lipid characterization. ER liposomes were prepared using extracted lipids from the remainder of purified ER membranes. Protein, cholesterol, and phospholipid levels were measured as described under “Experimental Procedures.” Purified ER membranes (10 μg of protein/lane; 3 μg of phospholipid/lane) and ER liposomes (0 μg of protein/lane; 10 μg of phospholipid/lane) corresponding to the indicated cholesterol treatment were subjected to 8% SDS-PAGE and analyzed by Coomassie staining (B, top panel) or immunoblot against Scap (B, middle panel) or immunoblot against SREBP-2 (B, bottom panel). The mole fraction of cholesterol in membranes corresponding to each lane is shown in C. D and E, interaction of His6-PFO(C459A) with ER liposomes. Reaction mixtures (200 μl total of buffer A) containing 5 μg of purified His6-PFO(C459A) and ER liposomes (80 μg of phospholipid) prepared from cells subjected to the indicated treatment were incubated for 1 h at 37 °C. An aliquot (0.5% of total) of each reaction mixture was subjected to 4% SDS-PAGE, and immunoblot analysis for His6-PFO(C459A) was carried out as described under “Experimental Procedures” (D). M, membrane-bound oligomeric form of PFO; F, free form of PFO. Tryptophan fluorescence was measured from the remainder of the reaction mixtures (E) (excitation wavelength, 290 nm; emission wavelength, 340 nm). F0 is defined as the fluorescence from mixtures of His6-PFO(C459A) and ER liposomes prepared from cells harvested at the 0-h time point. F, densitometric quantification of A and D and immunoblots from two other similar experiments showing the percentages of SREBP-2 in the activated, nuclear form relative to the total (nuclear plus precursor) (●) and the percentages of PFO in membrane-bound oligomeric form relative to the total (membrane-bound plus free) (○) as a function of ER cholesterol concentration. The blue shaded region indicates a narrow concentration range where a switch-like response occurs (5–7 mol %). G, correlation plot of the data in F showing the relationship between SREBP-2 activation in response to ER cholesterol modulation and binding of PFO to ER liposomes. The dashed line represents perfect correlation (best fit to data: R2 = 0.94).
We tested for the ability of His6-PFO(C459A) to bind to ER liposomes using the electrophoretic mobility assay and once again found a striking correlation with suppression of SREBP-2 processing (Fig. 5, compare D and A, lanes 1–4). We were also able to measure His6-PFO(C459A) binding to ER liposomes by the tryptophan fluorescence assay because there is no background fluorescence associated with ER membrane proteins. Fig. 5E shows that the Trp emission intensity of mixtures of His6-PFO(C459A) and ER liposomes shows an ∼3-fold increase as ER cholesterol rises from ∼3 to ∼7 mol %, also correlating with SREBP-2 processing levels. To further establish this correlation, we conducted two additional experiments where cells were first depleted of cholesterol using 1% HPCD for 1 h and then treated either with 30 or 70 μm cholesterol·MCD for various times. As before, analysis of SREBP-2 activation and His6-PFO(C459A) binding to ER liposomes was carried out for these three experiments. We also measured cholesterol concentrations in both purified ER membranes and ER liposomes for all three experiments (values differed by less than 10% in all cases). Fig. 5F shows a graph of the combined data where the percentages of SREBP-2 in the activated nuclear form (●) and of His6-PFO(C459A) bound to purified ER liposomes (○) are plotted as a function of ER cholesterol concentration. This analysis again revealed a threshold effect for both SREBP-2 processing and His6-PFO(C459A) binding to ER liposomes at a common cholesterol concentration. The switch-point cholesterol concentration in the case of ER liposomes is at ∼5 mol % ER cholesterol, close to the ∼6 mol % value obtained in the case of purified ER membranes (Fig. 4D). Fig. 5G replots the data in Fig. 5F, showing the percentage of SREBP-2 in the activated nuclear form versus that of His6-PFO(C459A) bound to the respective ER liposomes and again shows strong negative correlation (R2 = 0.94).
DISCUSSION
The current study expands our understanding of mechanisms by which the SREBP pathway is able to precisely control membrane cholesterol levels (1–3). Cooperative interactions between Scap·cholesterol·Insig in ER membranes result in switch-like control over SREBP-2 activation in response to small changes in ER cholesterol concentration (1, 3, 4). The expression of genes required for cholesterol biosynthesis and uptake is thus carefully balanced, ensuring constant cholesterol concentrations in cell membranes (2). The pivotal step in triggering this switch-like response to small changes in ER cholesterol levels involves the binding of cholesterol to Scap, a tetrameric ER membrane protein. Here we show that the accessibility of cholesterol in purified ER membranes shows a sharp increase at the same ER cholesterol concentration where SREBP-2 activation is terminated. The accessibility of cholesterol is in turn dependent on the phospholipid composition of the ER membrane. Such control of the availability (chemical activity) of the cholesterol ligand to bind to Scap could provide an additional mode of regulation of SREBP-2 activation.
The studies described here were made possible by the ability to obtain highly purified ER membranes using a recently reported procedure (4). To assay cholesterol accessibility in ER membranes, we took advantage of an extensively characterized bacterial toxin, PFO, which binds to membranes containing cholesterol and forms large oligomers (6–9). The initial interaction of water-soluble PFO with membranes involves direct binding to cholesterol (7). Subsequent membrane insertion and oligomerization of PFO, as judged by its Trp fluorescence and electrophoretic mobility, respectively, show a switch-like dependence on cholesterol concentration (Fig. 1, C and D). It is plausible to assume that the interaction of membrane cholesterol with soluble PFO is proportional to the chemical activity of cholesterol, much like rate constants for cholesterol desorption from membranes to soluble MCD acceptors (5). Strictly speaking, rate constants reflecting the probability that a cholesterol molecule interacts with MCD or PFO would be related to the activity coefficient of cholesterol, which is the chemical activity divided by mole fraction of cholesterol. Sharp changes in chemical activity (or activity coefficients) of cholesterol could then lead to sharp changes in the binding of PFO to membranes (as shown in Fig. 1, C and D). It is equally plausible that the chemical activity of cholesterol conforms to ideal behavior (see later) and that the switch-like response is due primarily to oligomerization of PFO in the membrane. If we assume a pre-equilibrium between PFO and cholesterol (C),
followed by an irreversible reaction,
this would result in irreversible binding of PFO with a dependence on cholesterol concentration raised to the power n. Because the oligomerization parameter, n, has been estimated to be 30–50 (6, 8), PFO binding to membranes could show a steep response to cholesterol levels caused by this effect alone. Nevertheless, the strong dependence of the switch-point cholesterol concentration on phospholipid acyl chain composition (Fig. 2B) suggests that the chemical activity of cholesterol, as determined by its interaction with phospholipids, is an important cue to trigger PFO binding to membranes. Furthermore, the complete absence of PFO binding to membranes containing epicholesterol (Fig. 3), which would be expected to result in bilayers with similar physical properties as those containing cholesterol, suggests that PFO specifically interacts with cholesterol and not merely with bilayers in a particular physical state. It is also unlikely that switch-like binding of PFO to membranes is related to first order liquid-to-gel phase transitions in the bilayer because fluorescence anisotropy measurements show no sharp changes in phospholipid acyl chain packing at PFO switch-point cholesterol concentrations (8).
Sharp changes in cholesterol chemical activity (and activity coefficients) can be obtained using a simple model where cholesterol forms complexes with phospholipid, as illustrated by the calculations in Fig. 6 (see “Experimental Procedures”). In the absence of complex formation or any other interactions between cholesterol and phospholipid (ideal behavior), the chemical activity of cholesterol is simply equal to its concentration (Fig. 6, black curve). As discussed earlier, switch-like transitions in PFO binding to membranes could still occur in this case because of oligomerization of membrane-bound PFO. Formation of a 1:2 cholesterol·phospholipid complex can dramatically alter the chemical activity of cholesterol, leading to a sharp transition at the stoichiometric composition (Fig. 6, blue curve). Formation of a cooperative 10:20 cholesterol·phospholipid complex further sharpens this transition (Fig. 6, red curve). At concentrations below the stoichiometric point of 33 mol %, most of the cholesterol is tied up in complexes, and its chemical activity is low. As cholesterol concentration rises past 33 mol %, the concentration of free cholesterol and its chemical activity rise rapidly. Free cholesterol, characterized by high chemical activity, may be a better substrate for PFO. Steep increases in chemical activity of cholesterol (Fig. 6, red and blue curves) combined with oligomerization of membrane-bound PFO would further sharpen the switch-like transitions in PFO binding to membranes (Figs. 1C and 2B). The hexamer formation of spin labels in cholesterol-containing liposomes may also be relevant to the discussion here (24). The model of cholesterol-phospholipid complexes has been referred to as the “condensed complex” model and has been a useful tool to successfully model phase diagrams, heat capacities, and NMR spectra of cholesterol-containing bilayers (17, 25, 26). Other models involving attractive interactions between cholesterol and phospholipid could also result in abrupt changes in cholesterol chemical activity.
FIGURE 6.

Calculated cholesterol chemical activities as a function of cholesterol concentration. Chemical activities (which are related to chemical potentials) are calculated using Equation 2, as described under “Experimental Procedures,” for binary membrane mixtures of cholesterol and phospholipid assuming no interactions (black curve), a complex containing one cholesterol and two phospholipid molecules (Keq = 200, blue curve) and a cooperative complex containing 10 cholesterol and 20 phospholipid molecules (Keq = 20010, red curve).
Compared with liposomes made of binary and ternary mixtures of cholesterol and phospholipids, ER membranes are much more complicated because they contain a vast array of proteins and lipids. Yet we observed similar sharp switch-points in the binding of PFO to purified ER membranes when cholesterol content was varied about the physiological set-point concentration of 5 mol % (4). Furthermore, the switch-point of PFO binding coincided exactly with the switch-point of SREBP-2 activation (Fig. 4, C and D). Remarkably, the same correlation was observed between SREBP-2 activation and PFO binding to liposomes made of lipids extracted from purified ER membranes (Fig. 5F). These ER liposomes have no detectable protein content (Fig. 5B), suggesting that the chemical activity of cholesterol in ER membranes is largely a function of the ER phospholipid composition. These results also suggest that the chemical activity of cholesterol in ER membranes undergoes a sharp increase at concentrations >5 mol %, resulting in its increased accessibility to a soluble receptor like PFO. We propose that there is a similar sharp increase in cholesterol accessibility to an ER membrane sensor like Scap at ER cholesterol concentrations >5 mol % (the sterol structural specificity for PFO (Fig. 3) and for Scap (22) are identical). Protein oligomerization is also likely to play a role because Scap is a tetramer (27), Insig is a dimer (22), and Scap·cholesterol·Insig complex formation may involve further multimerization (3). Thus, the control of cholesterol accessibility to Scap coupled with subsequent cooperative complex formation between Scap·cholesterol·Insig combine to further sharpen the switch-like modulation of SREBP-2 activation.
To decouple this process and learn the extent to which chemical activity of cholesterol determines SREBP-2 activation, further studies on proteins of the SREBP pathway reconstituted into liposomes made from purified ER lipids will be required. A major unanswered question from this study relates to the phospholipid composition of ER membranes, which leads to switch-like responses at a cholesterol concentration of ∼5 mol %. Fig. 2 shows that the switch-point cholesterol concentration for PFO binding to liposomes is a strong function of phospholipid acyl chain composition. Earlier studies showed that the major phospholipids in mammalian ER membranes by headgroup type were phosphatidylcholine (∼60% of total phospholipids) and phosphatidylethanolamine (∼20–30% of total phospholipids) (28, 29). Unfortunately, more details on ER phospholipid composition, such as chain length, unsaturation, and whether there is a dependence on cholesterol concentration, are currently not available. The ER switch-point cholesterol concentration of ∼5 mol % suggests that cholesterol may form complexes only with a small fraction of ER phospholipids. We hope to address details of interaction of cholesterol with ER phospholipids in future work. Also, an earlier study showed that in CHO-7 cells with increased Insig-1 levels, the cholesterol switch-point concentration for SREBP-2 activation shifted from 5.5 to 3.1 mol % (4). It will be interesting to know whether the switch-point of PFO binding to purified ER membranes from these cells with high Insig:Scap ratios also shifts to lower cholesterol concentrations because of coordinated changes in ER phospholipid composition.
Acknowledgments
We thank Avril Coley for excellent technical assistance during the early phases of this work; Anton Rozenbaum, David Warren, and the Milstein Chemical Biology Core (Weill Cornell Medical College) for assistance with GC/MS analysis of sterols; Mike Brown, Joe Goldstein, and Art Johnson for reagents as indicated; and Harden McConnell, Fred Maxfield, and Jeremy Dittman for many helpful discussions.
Footnotes
- ER
- endoplasmic reticulum
- SREBP
- sterol regulatory element-binding protein
- MCD
- randomly methylated β-cyclodextrin
- PFO
- perfringolysin O
- DOPC
- 1,2-dioleoyl-sn-glycero-3-phosphocholine
- POPC
- 1-palmitoyl-2-oleoyl-sn-glycero-3-phosphocholine
- DPhyPC
- 1,2-diphytanoyl-sn-glycero-3-phosphocholine
- HPCD
- hydroxypropyl β-cyclodextrin.
REFERENCES
- 1.Brown M. S., Goldstein J. L. (1997) Cell 89, 331–340 [DOI] [PubMed] [Google Scholar]
- 2.Horton J. D., Goldstein J. L., Brown M. S. (2002) J. Clin. Invest. 109, 1125–1131 [DOI] [PMC free article] [PubMed] [Google Scholar]
- 3.Brown M. S., Goldstein J. L. (2009) J. Lipid Res. 50, S15–S27 [DOI] [PMC free article] [PubMed] [Google Scholar]
- 4.Radhakrishnan A., Goldstein J. L., McDonald J. G., Brown M. S. (2008) Cell Metab. 8, 512–521 [DOI] [PMC free article] [PubMed] [Google Scholar]
- 5.Radhakrishnan A., McConnell H. M. (2000) Biochemistry 39, 8119–8124 [DOI] [PubMed] [Google Scholar]
- 6.Heuck A. P., Hotze E. M., Tweten R. K., Johnson A. E. (2000) Mol. Cell 6, 1233–1242 [DOI] [PubMed] [Google Scholar]
- 7.Farrand A. J., LaChapelle S., Hotze E. M., Johnson A. E., Tweten R. K. (2010) Proc. Natl. Acad. Sci. U.S.A. 107, 4341–4346 [DOI] [PMC free article] [PubMed] [Google Scholar]
- 8.Flanagan J. J., Tweten R. K., Johnson A. E., Heuck A. P. (2009) Biochemistry 48, 3977–3987 [DOI] [PMC free article] [PubMed] [Google Scholar]
- 9.Rossjohn J., Feil S. C., McKinstry W. J., Tweten R. K., Parker M. W. (1997) Cell 89, 685–692 [DOI] [PubMed] [Google Scholar]
- 10.Nakamura M., Sekino N., Iwamoto M., Ohno-Iwashita Y. (1995) Biochemistry 34, 6513–6520 [DOI] [PubMed] [Google Scholar]
- 11.Shepard L. A., Shatursky O., Johnson A. E., Tweten R. K. (2000) Biochemistry 39, 10284–10293 [DOI] [PubMed] [Google Scholar]
- 12.Brown M. S., Faust J. R., Goldstein J. L., Kaneko I., Endo A. (1978) J. Biol. Chem. 253, 1121–1128 [PubMed] [Google Scholar]
- 13.Brown A. J., Sun L., Feramisco J. D., Brown M. S., Goldstein J. L. (2002) Mol. Cell 10, 237–245 [DOI] [PubMed] [Google Scholar]
- 14.Shepard L. A., Heuck A. P., Hamman B. D., Rossjohn J., Parker M. W., Ryan K. R., Johnson A. E., Tweten R. K. (1998) Biochemistry 37, 14563–14574 [DOI] [PubMed] [Google Scholar]
- 15.Rosenbaum A. I., Zhang G., Warren J. D., Maxfield F. R. (2010) Proc. Natl. Acad. Sci. U.S.A. 107, 5477–5482 [DOI] [PMC free article] [PubMed] [Google Scholar]
- 16.Chalvardjian A., Rudnicki E. (1970) Anal. Biochem. 36, 225–226 [DOI] [PubMed] [Google Scholar]
- 17.Radhakrishnan A., McConnell H. (2005) Proc. Natl. Acad. Sci. U.S.A. 102, 12662–12666 [DOI] [PMC free article] [PubMed] [Google Scholar]
- 18.McConnell H. M., Radhakrishnan A. (2003) Biochim. Biophys. Acta 1610, 159–173 [DOI] [PubMed] [Google Scholar]
- 19.Solovyova A. S., Nöllmann M., Mitchell T. J., Byron O. (2004) Biophys. J. 87, 540–552 [DOI] [PMC free article] [PubMed] [Google Scholar]
- 20.Nelson L. D., Johnson A. E., London E. (2008) J. Biol. Chem. 283, 4632–4642 [DOI] [PubMed] [Google Scholar]
- 21.Zitzer A., Westover E. J., Covey D. F., Palmer M. (2003) FEBS Lett. 553, 229–231 [DOI] [PubMed] [Google Scholar]
- 22.Radhakrishnan A., Ikeda Y., Kwon H. J., Brown M. S., Goldstein J. L. (2007) Proc. Natl. Acad. Sci. U.S.A. 104, 6511–6518 [DOI] [PMC free article] [PubMed] [Google Scholar]
- 23.Crowley K. S., Liao S., Worrell V. E., Reinhart G. D., Johnson A. E. (1994) Cell 78, 461–471 [DOI] [PubMed] [Google Scholar]
- 24.Rey P., McConnell H. M. (1977) J. Am. Chem. Soc. 99, 1637–1642 [DOI] [PubMed] [Google Scholar]
- 25.Anderson T. G., McConnell H. M. (2001) Biophys. J. 81, 2774–2785 [DOI] [PMC free article] [PubMed] [Google Scholar]
- 26.McConnell H., Radhakrishnan A. (2006) Proc. Natl. Acad. Sci. U.S.A. 103, 1184–1189 [DOI] [PMC free article] [PubMed] [Google Scholar]
- 27.Radhakrishnan A., Sun L. P., Kwon H. J., Brown M. S., Goldstein J. L. (2004) Mol. Cell 15, 259–268 [DOI] [PubMed] [Google Scholar]
- 28.van Meer G., Voelker D. R., Feigenson G. W. (2008) Nat. Rev. Mol. Cell Biol. 9, 112–124 [DOI] [PMC free article] [PubMed] [Google Scholar]
- 29.Zambrano F., Fleischer S., Fleischer B. (1975) Biochim. Biophys. Acta 380, 357–369 [DOI] [PubMed] [Google Scholar]