

Abstract
We have previously shown that treatment of steatotic livers with vitamin E succinate decreases liver injury and increases survival after ischemia/reperfusion (I/R). It is now understood that compromised energy status is associated with increased injury following liver ischemia in the setting of hepatic steatosis at least partially as a result of increased reactive oxygen species (ROS) and induction of mitochondrial uncoupling protein-2 (UCP2). Given the association between ROS, mitochondrial function, and UCP2, it was our goal to determine whether the protective effects of vitamin E succinate were associated with decreased ROS injury, down-regulation of UCP2, or improvement of ATP levels following I/R. To test this, leptin deficient (ob/ob) mice with steatotic livers that had received other 50 IU of vitamin E succinate supplement per day or control chow for 7 days were subjected to total hepatic ischemia (15 minutes) followed by reperfusion. We measured liver expressions of ATP, glutathione (GSH), and UCP2 as well as mitochondrial DNA damage. Vitamin E treatment decreased hepatic UCP2 expression and increased ATP and GSH levels prior to I/R. These levels were maintained at 1 hour after I/R. At 24 hours, while hepatic UCP2 expression, ATP, and GSH levels were similar to those of mice not receiving vitamin E, mitochondrial DNA damage was blocked. These results revealed that vitamin E succinate decreased hepatic UCP2 expression, reduced oxidative stress, and improved mitochondrial function in mice with steatotic livers before and after I/R, identifying mechanisms of protection in this setting.
Mitochondrial adaptations to excess metabolic substrate are now believed to increase the sensitivity of steatotic livers to damage following ischemia/reperfusion (I/R). Specifically, mitochondria in steatotic hepatocytes contain high levels of uncoupling protein-2 (UCP2), whereas hepatocytes from lean livers express little or protein.1-3 UCP2 is a member of a family of mitochondrial proteins that are known to uncouple electron transport from oxidative phosphorylation.4,5 The functional significance of UCP2 up-regulation in the liver is not entirely clear; however, through mitochondrial uncoupling it may be involved in homeostasis of cellular energy in the settings of excess substrate and of protection against reactive oxygen species (ROS) production.6-9 We have shown that UCP2 expression contributes to the ATP depletion and injury observed in steatotic livers following I/R.1,10
The availability of excess metabolic substrate to the cells of a steatotic liver results in a sustained shift in the electrochemical potential of mitochondria, resulting in greater amounts of superoxide (O2−) and H2O2 than are present in lean livers.11 UCP2 expression is a protective adaptation to this imbalance. Blockade or deficiency of UCP2 expression has been correlated with observations of increased oxidative stress, including superoxide production in endothelial cells and hepatocytes.7,8 Agents capable of increasing mitochondrial superoxide production increase UCP2 expression and/or activate the uncoupling capacity of UCP2 residing in the mitochondrial matrix.12,13 Thus, UCP2 induced by ROS may serve as a cytoprotective response at rest, but promote injury during stressors such as I/R.14
The transient down-regulation and/or inactivation of UCP2 may be considered to be a protective response in the wake of an ischemic insult. Logical candidates for this down-regulation or inactivation include ROS scavengers, such as vitamin E, whose benefits have generally been attributed to their ability to inhibit ischemic ROS-induced mitochondrial damage and cellular lipid peroxidation.15 α-Tocopherol (vitamin E) can be esterified to succinate to protect the molecule from oxidation and to increase its systemic and liver tissue uptake, making it an ideal candidate to interrupt this effect.16-18
We have previously shown that treatment of mice with steatotic livers with vitamin E succinate (VE) increased survival and decreased liver pathology following I/R.14 We proposed that this protection may be related to the ability of VE to scavenge ROS, reduce UCP2 expression, and increase the efficiency of ATP production in the steatotic liver before and after the onset of I/R.
MATERIALS AND METHODS
Animals and Treatment
Twelve-week-old male ob/ob (leptin−/−) and control C57BL6 mice (Jackson Labs, Bar Harbor, Me, USA) were used for all experiments. The study was approved by our IACUC and conformed to the National Institutes of Health care and use guidelines. Mice placed on a standard 12-hour light/dark cycle were allowed access to food and water ad libitum. Seven days prior to experimentation, mice were placed on either Purina (St. Louis, Mo, USA) #5001 chow or chow supplemented with 1 g/kg of d-alpha-tocopherol succinate (VE) prepared by Dyets (Bethlehem, Penn, United States). Total daily consumption was approximately 50 IU per animal each day. Mice were either humanely killed or subjected to ischemia at the end of the 7-day treatment as previously described.10 All animals subjected to I/R were placed on a control diet following ischemia.
Isolation of Messenger RNA and UCP2 Northern Analysis
Whole tissue (50–100 mg) RNA was prepared with RNA-Bee reagent according to the manufacturer’s instructions (Tel-Test, Friendswood, Tex, USA). It was fractionated by electrophoresis, transferred to a Nytran membrane, and then fixed by ultraviolet (UV) cross-linking. Blots first prehybridized with QuikHyb buffer (Stratagene, La Jolla, Calif, USA) for 15 minutes at 65°C were then hybridized overnight at 65°C with a 32P-UCP2 complementary DNA (cDNA) probe (Stratagene Random Priming Kit) in a rotating oven. Blots were then washed for 30 minutes with 2 × SSC + 0.1% SDS at 55°C and twice for 15 minutes with 0.1 × SSC + 0.1% SDS at 55°C. The dried blot was exposed to Kodak (Rochester, NY, USA) film. For normalization, the blots were stripped and rehybridized in a similar manner substituting an 18S RNA cDNA probe.
Measurement of ATP
Isolated hepatocytes or 50-mg samples from diced frozen livers were homogenized in 500 μL of cell lysis buffer (150 mmol/L NaCl, 50 mmol/L Tris, 1% Triton X-100, 0.1% SDS, and 1% deoxycholate; pH 7.5), then supplemented with 1.5% trichloroacetic acid (TCA) for ATPase inhibition. Homogenates were centrifuged at 20,000g and supernates diluted 1:100 in Tris acetate buffer (TAB; 0.1 mmol/L, containing sodium acetate). Each diluted sample was mixed with reconstituted luciferin-luciferase solution (Enliten, Promega, Madison, Wisc, USA). The ATP concentration was immediately measured luminometrically. For normalization between samples, total cellular protein in each liver homogenate was determined using a bicinchoninic acid (BCA) assay (Pierce, Rockford, Ill). Aliquots of sample homogenates were collected prior to the addition of TCA for the protein assay.
Glutathione Measurement
A colorimetric assay based on the formation of thioethers between 4-chloro-1-methyl-7 trifluromethyl-quinolinium methylsulfate and mercaptans (RSH) was used to determine reduced intracellular glutathione concentrations (Oxford Biomedical Research, GT10) as described by the manufacturer. Homogenized fresh frozen liver was incubated with the provided reagents; the optical density of samples was determined with a spectrophotometer at 400 nm. Solutions of known concentrations of glutathione (GSH) were used to obtain a standard curve and observed levels were normalized to tissue protein concentrations determined by the BCA assay.
Estimation of DNA Damage by Quantitative Polymerase Chain Reaction
Amplification of a 10-kilobase fragment of mitochondrial DNA was performed to measure DNA damage in mitochondria. Quantitative polymerase chain reaction (QPCR) is based on the premise that the DNA damage in the form of strand breaks, base modifications, and apurinic/apyrimidinic sites will block the progression of the polymerase, resulting in decreased amplification of the target sequence.19 Genomic DNA from the liver samples was isolated using QIAamp DNA isolation kit (Qiagen, Chartsworth, Calif, United States) as described by the manufacturer. The concentration of total cellular DNA was estimated by using a fluorescent Picogreen dye (molecular probes) with excitation wavelength of 485 nm and emission of 530 nm using Hind III DNA as a standard. QPCRs were performed using a Biometra gradient PCR machine (Biometra, Goettingen, Germany) with the GeneAmp XL PCR kit (Perkin-Elmer/Roche). Reaction mixtures contained 15 ng of template DNA, 1.1 mg of magnesium, 100 μg/mL of non-acetylated bovine serum albumin, 0.2 mmol/L of deoxynucleotide triphosphates, 0.2 μmol/L of primers, and 1 U of rTth DNA polymerase XL. The PCR was initiated with a hot start addition of polymerase at 75°C. The thermocycler profile included 94°C denaturation step for 15 seconds followed by 18 cycles of 95°C denaturation for 15 seconds and 64°C primer extension for 10 minutes. A final extension for 10 minutes at 72°C was done at the completion of the profile. To ensure that the PCR is quantitative, a control reaction containing 7.5 ng of template DNA was included with each set of PCR reactions. The PCR products were quantitated using fluorescent Picogreen reagent. The relative amplification ratios were calculated by normalizing the amplification of damaged templates (AD) to the amplification of nondamaged control (Ao). DNA damage was calculated as described previously.19,20
Statistical Analysis
Results were reported as mean values ± standard deviations. Groups (n = 5) were compared using Student t test or one-way analysis of variance plus Tukey’s post-hoc analysis when appropriate. An alpha level equal to .05 was defined for statistical significance for all comparisons.
RESULTS
UCP2 expression, ATP, and GSH levels were monitored in ob/ob mice that received a diet supplemented with VE (approximately 50 IU per animal per day for 7 days). The VE-treated mice exhibited a 41% decrease in liver UCP2 messenger RNA (mRNA) expression compared with control mice at the end of the 7-day treatment period (Fig 1a). VE treatment also increased whole liver ATP concentrations by nearly one-fold (0.80) in addition to a significant increase in liver GSH (Fig 1b and c).
Fig 1.
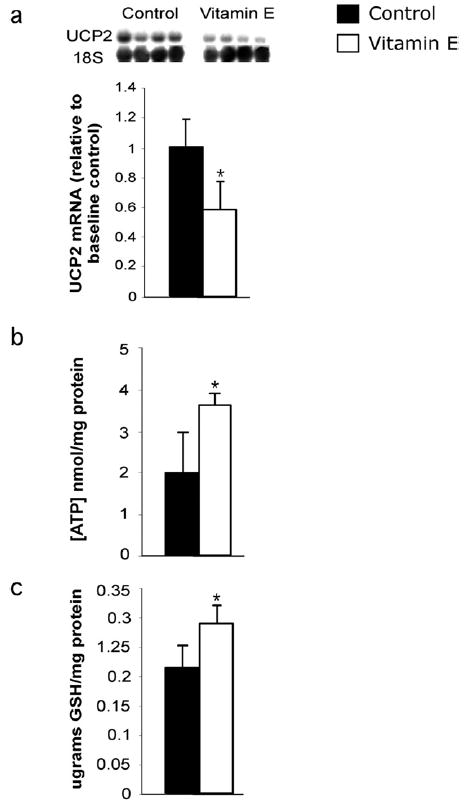
Effect of VE on hepatic UCP2 mRNA expression, ATP, and GSH levels in steatotic livers. Livers of control and VE-fed ob/ob mice were collected following the 7-day VE treatment and analyzed. (a) UCP2 mRNA and 18S RNA were measured using densitometry analysis and UCP2 expression was standardized (n = 4 per group). (b) Liver ATP concentrations standardized to protein (n = 5 per group). (c) Liver GSH levels standardized to protein. Values are expressed as means ± SD (n = 5 per group). *P < .05 vs control for each measurement.
To determine the consequences of these changes after I/R, mice were exposed to 15 minutes of ischemia, followed by reperfusion for 1 and 24 hours. For this study, the animal survival rate was 100%. Liver damage was not significant following I/R or between groups based upon serum ALT, H&E, or TUNEL analysis (not shown). Supplementation with VE decreased liver UCP2 mRNA levels to 58% of control values at 1 hour postreperfusion, which was not different from the baseline levels. UCP2 content was steady over the course of I/R in control animals. However, UCP2 mRNA levels returned to control levels at 24 hours postreperfusion (Fig 2a). ATP levels in control mice decreased 1 hour postreperfusion from the concentrations observed at baseline (1.3-fold; Fig 2b). ATP levels in the VE-treated mice were 56% higher than control levels after 1 hour of reperfusion, but 3-fold lower than the VE baseline concentrations. At 24 hours postreperfusion, ATP concentrations in both groups increased from 1 hour, but there were no differences between VE-treated and control groups at this time.
Fig 2.
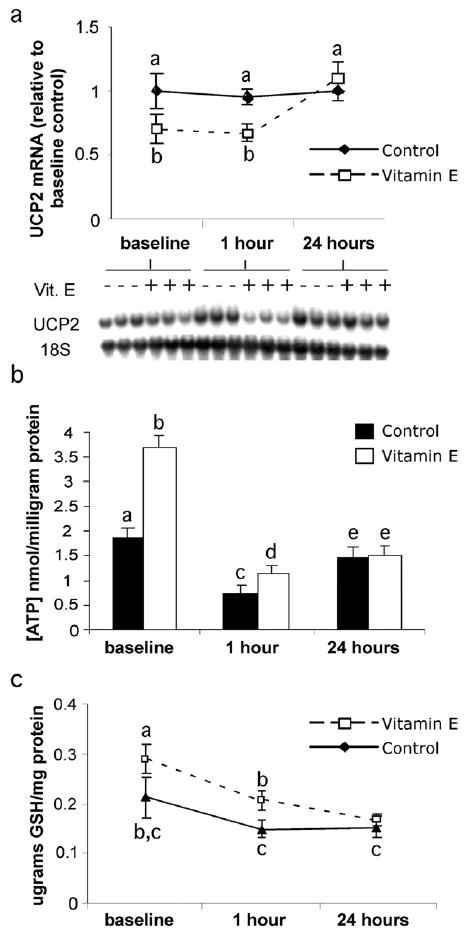
Effect of VE on hepatic UCP2 expression and ATP and GSH levels following I/R. Treated and untreated groups were subjected to 15 minutes of total hepatic ischemia and 1 hour or 24 hours of reperfusion; liver tissue was collected for analysis. (a) UCP2 mRNA was measured using densitometry analysis and standardized to measured 18S RNA. (b) Liver ATP levels standardized to protein. (c) Liver GSH levels standardized to protein. Values are expressed as means ± SD (n = 5 per group). Means with different superscripts are significantly different; P < .05.
In addition to increased GSH concentrations at baseline, VE supplementation significantly protected the stores of reduced liver GSH content until 24 hours postreperfusion (Fig 2c). GSH concentrations in VE-treated livers were 40% higher than ob/ob controls at baseline. After 1 hour of reperfusion, control values were less than those in the VE-treated group; by 24 hours the concentrations were the same in both groups. The liver GSH concentrations were significantly decreased in the VE-treated population at 24 hours compared with its baseline and 1-hour values, whereas control values remained unchanged throughout the process of I/R.
In an effort to directly measure the effects of VE treatment of ROS-induced mitochondrial injury before and following I/R, mitochondrial DNA damage was measured. Levels of liver mitochondrial DNA lesions were not significantly different at baseline between control ob/ob mice and mice treated with VE. At 24 hours postreperfusion, liver mitochondrial DNA lesions increased 3-fold (Fig 3). VE treatment completely blocked the formation of liver mitochondrial DNA lesions at 24 hours postreperfusion; the levels were not different from baseline. No differences in nuclear DNA damage were observed before or after ischemia, or with or without VE treatment.
Fig 3.
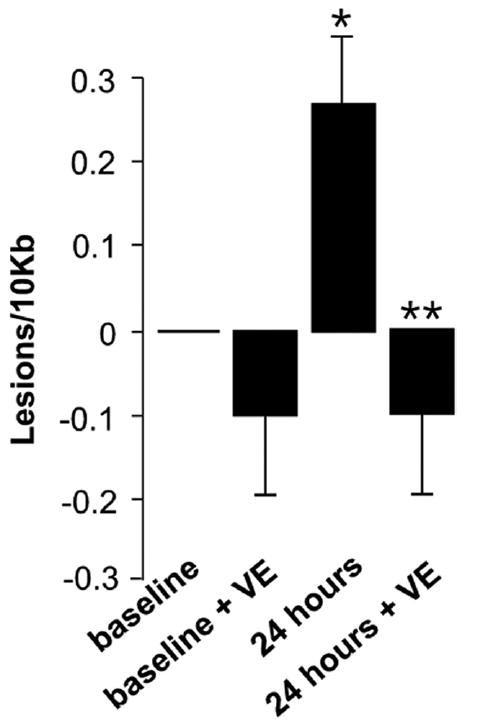
Effect of VE on mitochondrial DNA lesions following I/R. Mitochondrial DNA lesions were measured using QPCR. Values are expressed as means ± SD (n = 5 per group). *P < .05 vs baseline control; **P < .05 vs 24-h control.
DISCUSSION
In a previous study, we showed that treatment of ob/ob mice with the same regimen of VE protected their livers from I/R injury.14 To eliminate the confounding variables of cell death, we used a nonlethal model of I/R. In this study we evaluated VE, an intramatrix superoxide scavenger, for its ability to alter UCP2 expression and energy status of the steatotic liver and to inhibit ROS-induced oxidative damage at baseline and following I/R. The present results suggested that VE supplementation significantly decreased the levels of UCP2 expression, resulting in a significant increase in ATP stores in the steatotic liver both before and after I/R.
The ability of VE to reduce oxidative stress was confirmed at baseline and following I/R with observations of increased concentrations of liver GSH and reductions in mitochondrial DNA damage. Consistent with the observations of ATP and UCP2 at 24 hours following reperfusion, the concentration of GSH was not appreciably different between treatment groups at this time. Over the course of I/R we observed a steady reduction in GSH concentrations in the VE-treated groups, whereas no significant decrease was observed in the control groups. This observation suggested that GSH levels, which are compromised in the resting steatotic liver, improve with VE treatment, only to return to control levels after the onset of I/R and cessation of VE treatment. In addition, the fact that GSH levels decreased after I/R suggested that UCP2 expression alone was insufficient to combat the increased ROS load at baseline and after I/R in steatotic livers. This observation is consistent with our previous UCP2 studies,10 which have shown that UCP2 deficiency has no effect on lipid peroxidation after ischemic challenge. Although mitochondrial oxidative DNA damage was significantly increased in the control group following I/R, there was no evidence of complete failure of that organelle because necrosis was not observed, and the concentrations of ATP was not significantly reduced at 24 hours post-I/R in the control group.
The results presented herein served to support the hypothesis that, in the steatotic liver, VE indirectly improves the cellular energy status by reducing the ROS load, thereby down-regulating UCP2. VE is therefore acting on the steatotic liver following I/R in two potential ways. First, VE helps reverse mitochondrial dysfunction, improving the ability of the steatotic hepatocyte to produce ATP, which is critically important to preserve ATP-dependent cellular processes during I/R. Second, the burden of oxidative stress, which dramatically increases during reperfusion regardless of liver phenotype, is alleviated by the additional ROS scavenging provided by VE. The consequence of each property of VE likely accounts for the observed protection.
I/R injury is multifactorial, especially in the context of the metabolically complex steatotic liver. The alterations afforded to the steatotic liver by preadministration of VE as observed in this study offer a promising strategy to protect against I/R, which is not applicable in the lean liver, where UCP2 is expressed at inconsequential levels. Thus, administration of vitamin E to the steatotic donor may protect by multiple mechanisms, and improve steatotic graft outcomes. Additional studies are necessary to determine the effectiveness of a short-term course of VE and to determine its rate of hepatic consumption following I/R.
References
- 1.Chavin KD, Yang S, et al. Obesity induces expression of uncoupling protein-2 in hepatocytes and promotes liver atp depletion. J Biol Chem. 1999;274:5692. doi: 10.1074/jbc.274.9.5692. [DOI] [PubMed] [Google Scholar]
- 2.Kimura K, Jung BD, et al. Induction of uncoupling protein (ucp) 2 in primary cultured hepatocytes. FEBS Letters. 1999;457:75. doi: 10.1016/s0014-5793(99)00987-4. [DOI] [PubMed] [Google Scholar]
- 3.Larrouy D, Laharrague P, et al. Kupffer cells are a dominant site of uncoupling protein 2 expression in rat liver. Biochem Biophys Res Comm. 1997;235:760. doi: 10.1006/bbrc.1997.6852. [DOI] [PubMed] [Google Scholar]
- 4.Ricquier D, Bouillaud F. Mitochondrial uncoupling proteins: from mitochondria to the regulation of energy balance. J Physiol. 2000;529:3. doi: 10.1111/j.1469-7793.2000.00003.x. [DOI] [PMC free article] [PubMed] [Google Scholar]
- 5.Ricquier D, Bouillaud F. The uncoupling protein homologues: Ucp1, ucp2, ucp3, stucp and atucp. Biochem J. 2000;345:161. [PMC free article] [PubMed] [Google Scholar]
- 6.Cortez-Pinto H, Chatham J, et al. Alterations in liver atp homeostasis in human nonalcoholic steatohepatitis: a pilot study. JAMA. 1999;282:1659. doi: 10.1001/jama.282.17.1659. [DOI] [PubMed] [Google Scholar]
- 7.Duval C, Negre-Salvayre A, et al. Increased reactive oxygen species production with antisense oligonucleotide directed against uncoupling protein 2 in murine endothelial cells. Biochem Cell Biol. 2002;80:757. doi: 10.1139/o02-158. [DOI] [PubMed] [Google Scholar]
- 8.Horimoto M, Fulop P, et al. Uncoupling protein-2 deficiency promotes oxidant stress and delays liver regeneration in mice. Hepatology. 2004;39:386. doi: 10.1002/hep.20047. [DOI] [PubMed] [Google Scholar]
- 9.Negre-Salvayre A, Hirtz C, et al. A role for uncoupling protein-2 as a regulator of mitochondrial hydrogen peroxide generation. Faseb J. 1997;11:809. [PubMed] [Google Scholar]
- 10.Evans ZP, Ellett JD, et al. Mitochondrial uncoupling protein-2 mediates steatotic liver injury following ischemia/reperfusion. J Biol Chem. 2008;283:8573. doi: 10.1074/jbc.M706784200. [DOI] [PMC free article] [PubMed] [Google Scholar]
- 11.Yang S, Zhu H, et al. Mitochondrial adaptations to obesity-related oxidant stress. Arch Biochem Biophys. 2000;378:259. doi: 10.1006/abbi.2000.1829. [DOI] [PubMed] [Google Scholar]
- 12.Echtay KS, Murphy MP, et al. Superoxide activates mitochondrial uncoupling protein 2 from the matrix side. Studies using targeted antioxidants. J Biol Chem. 2002;277:47129. doi: 10.1074/jbc.M208262200. [DOI] [PubMed] [Google Scholar]
- 13.Echtay KS, Roussel D, et al. Superoxide activates mitochondrial uncoupling proteins. Nature. 2002;415:96. doi: 10.1038/415096a. [DOI] [PubMed] [Google Scholar]
- 14.Evans ZP, Ellett JD, et al. Vitamin E succinate reduces ischemia/reperfusion injury in steatotic livers. Transplant Proc. 2008;40:3327. doi: 10.1016/j.transproceed.2008.06.076. [DOI] [PMC free article] [PubMed] [Google Scholar]
- 15.Packer L. Protective role of vitamin e in biological systems. Am J Clin Nutr. 1991;53:1050S. doi: 10.1093/ajcn/53.4.1050S. [DOI] [PubMed] [Google Scholar]
- 16.Cheeseman KH, Holley AE, et al. Biokinetics in humans of rrr-alpha-tocopherol: the free phenol, acetate ester, and succinate ester forms of vitamin E. Free Radic Biol Med. 1995;19:591. doi: 10.1016/0891-5849(95)00083-a. [DOI] [PubMed] [Google Scholar]
- 17.Hidiroglou N, McDowell LR, et al. Bioavailability of vitamin E compounds in lambs. J Anim Sci. 1992;70:2556. doi: 10.2527/1992.7082556x. [DOI] [PubMed] [Google Scholar]
- 18.Jensen SK, Engberg RM, et al. All-rac-alpha-tocopherol acetate is a better vitamin e source than all-rac-alpha-tocopherol succinate for broilers. J Nutr. 1999;129:1355. doi: 10.1093/jn/129.7.1355. [DOI] [PubMed] [Google Scholar]
- 19.Yakes FM, Van Houten B. Mitochondrial DNA damage is more extensive and persists longer than nuclear DNA damage in human cells following oxidative stress. Proc Natl Acad Sci U S A. 1997;94:514. doi: 10.1073/pnas.94.2.514. [DOI] [PMC free article] [PubMed] [Google Scholar]
- 20.Van Houten B, Illenye S, et al. Homodinuclear (pt,pt) and heterodinuclear (ru,pt) metal compounds as DNA-protein cross-linking agents: potential suicide DNA lesions. Biochemistry. 1993;32:11794. doi: 10.1021/bi00095a007. [DOI] [PubMed] [Google Scholar]